Atomic Force Microscopy (AFM) in Biomedical Research: A Comprehensive Guide to Nanoscale Surface Imaging and Analysis
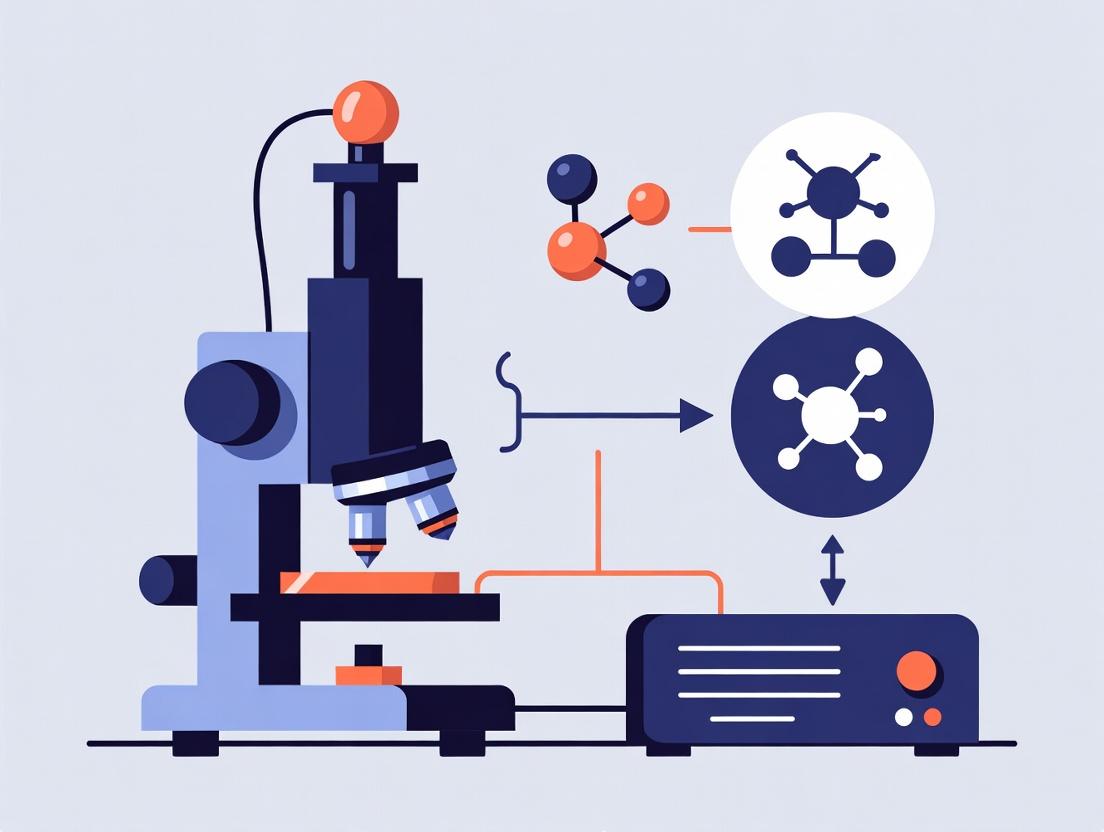
This article provides a detailed exploration of Atomic Force Microscopy (AFM) as a critical tool for nanoscale surface characterization in biomedical and pharmaceutical research.
Atomic Force Microscopy (AFM) in Biomedical Research: A Comprehensive Guide to Nanoscale Surface Imaging and Analysis
Abstract
This article provides a detailed exploration of Atomic Force Microscopy (AFM) as a critical tool for nanoscale surface characterization in biomedical and pharmaceutical research. Tailored for researchers, scientists, and drug development professionals, it covers fundamental principles of AFM operation, key methodological approaches including contact, tapping, and PeakForce Tapping modes, and their specific applications in imaging biomolecules, cells, and nanomaterials. The guide delves into practical troubleshooting for common artifacts and optimization strategies for imaging soft biological samples. Finally, it validates AFM data through comparative analysis with complementary techniques like SEM and TEM, and discusses quantitative nanomechanical mapping for material property assessment. The synthesis offers a roadmap for leveraging AFM to advance drug delivery systems, biomaterials, and fundamental biological understanding.
Understanding AFM: Core Principles and Capabilities for Nanoscale Exploration
What is Atomic Force Microscopy? Defining the Core Imaging Mechanism
Atomic Force Microscopy (AFM) is a high-resolution scanning probe microscopy technique fundamental to nanoscale surface imaging research. Its core mechanism involves physically raster-scanning a sharp probe across a sample surface to measure local tip-sample interactions, generating a three-dimensional topographic map without the need for lenses or light. This guide details its operational principles, modalities, and protocols within a thesis context focused on advancing nanoscale characterization in materials and life sciences.
Core Imaging Mechanism
The defining component of an AFM is a microfabricated cantilever with a nanoscale tip. As this tip is brought into proximity with a sample surface, forces (e.g., van der Waals, mechanical contact, electrostatic, magnetic) cause the cantilever to deflect. This deflection is monitored by a laser spot reflected from the top of the cantilever onto a position-sensitive photodetector. A feedback loop maintains a constant interaction force (or other parameter) by vertically moving the scanner. The scanner's movement at each (x, y) data point is recorded to construct the image.
AFM primarily operates in several modes:
- Contact Mode: The tip remains in constant physical contact with the sample surface. The feedback loop maintains constant cantilever deflection (constant force).
- Intermittent Contact (Tapping) Mode: The cantilever is oscillated at or near its resonance frequency. Tip-sample interactions alter the oscillation's amplitude, phase, and frequency. The feedback loop maintains a constant oscillation amplitude, minimizing lateral forces.
- Non-Contact Mode: The cantilever oscillates just above the sample surface where attractive forces dominate. Changes in the oscillation's resonance frequency or phase are used for feedback.
Quantitative Comparison of AFM Operational Modes
The following table summarizes the key parameters and applications of the primary imaging modes.
Table 1: Quantitative Comparison of Core AFM Imaging Modes
| Mode | Typical Force Regime | Lateral Resolution | Vertical Resolution | Key Advantage | Primary Risk |
|---|---|---|---|---|---|
| Contact Mode | Repulsive (nN) | 0.5 - 5 nm | 0.05 nm | High speed, good for flat, hard samples. | Sample deformation, tip wear, high lateral forces. |
| Intermittent Contact (Tapping) Mode | Intermittent Repulsive/Attractive (pN-nN) | 1 - 10 nm | 0.1 nm | Minimized lateral forces, suitable for soft samples (e.g., polymers, cells). | Slightly slower than contact mode. |
| Non-Contact Mode | Attractive (pN) | 5 - 20 nm | 0.1 nm | Minimal sample contact, preserves delicate surfaces. | Lower resolution, can be unstable in ambient conditions. |
| PeakForce Tapping (Bruker) | Pulsed Repulsive (pN) | 1 - 10 nm | 0.05 nm | Direct, quantitative force control at kHz rates, minimizes damage. | Requires advanced scanner and control electronics. |
Detailed Experimental Protocol: High-Resolution Tapping Mode Imaging of Lipid Bilayers
This protocol is cited from contemporary methodologies for biological nanostructure imaging.
Objective: To obtain high-resolution topography and phase images of a supported lipid bilayer (SLB) in fluid.
Materials: See "The Scientist's Toolkit" below.
Procedure:
- Substrate Preparation: Clean a freshly cleaved mica disk (Ø 15 mm) using adhesive tape. Mount it on the AFM sample disc using a double-sided adhesive tab.
- Lipid Bilayer Deposition: a. Prepare a 0.1 mg/mL solution of DOPC lipids in chloroform. b. Deposit 20 µL of the lipid solution onto the mica surface and allow the chloroform to evaporate in a desiccator for 30 minutes. c. Place the sample in a vacuum desiccator for a minimum of 2 hours to ensure complete solvent removal. d. Hydrate the lipid film by adding 1 mL of the imaging buffer (e.g., 10 mM HEPES, 150 mM NaCl, pH 7.4). Incubate at 60°C for 1 hour, then cool to room temperature to form a fluid SLB.
- AFM Setup & Calibration: a. Mount the liquid cell on the AFM scanner. Inject the imaging buffer to prevent air exposure of the bilayer. b. Install an ultra-sharp silicon nitride cantilever (k ≈ 0.1 N/m, f₀ ≈ 20 kHz in fluid) into the holder. c. Insert the probe holder into the AFM head and engage the laser alignment. Adjust to maximize the sum signal and center the deflection on the photodetector. d. Perform a thermal tune to determine the cantilever's resonance frequency in fluid.
- Engagement and Imaging: a. Position the scanner over the sample and initiate the automated engage routine, setting a low engagement force threshold (≤ 100 pN). b. Once engaged, switch to Tapping Mode in fluid. Set the drive frequency just below the resonant peak. c. Optimize imaging parameters: * Setpoint: Adjust to 0.8-0.9 times the free oscillation amplitude (V₀). * Scan Rate: 1-2 Hz. * Feedback Gains (P/I): Adjust to maintain stable tracking without oscillation (typical P: 1-2, I: 0.1-0.5). d. Acquire images (typically 512 x 512 or 1024 x 1024 pixels) over areas ranging from 20x20 µm² down to 500x500 nm².
- Data Analysis: Flatten images using first- or second-order line fitting. Analyze bilayer thickness via cross-sectional height profiles and domain morphology via phase images.
Visualizing the AFM Feedback Control System
AFM Feedback Loop for Topography
The Scientist's Toolkit: Research Reagent Solutions for AFM Bioscience
Table 2: Essential Materials for Bio-AFM Experiments
| Item | Function / Rationale |
|---|---|
| Freshly Cleaved Mica (V1 Grade) | An atomically flat, negatively charged substrate ideal for adsorbing biomolecules and lipid bilayers. |
| Ultra-Sharp AFM Probes (e.g., MSNL, TR400PSA) | Silicon nitride or silicon tips with low spring constants (0.01-0.6 N/m) and high resonance frequency for sensitive, high-resolution imaging in fluid. |
| AFM Liquid Cell (Closed/Sealed) | Enables imaging in a controlled fluid environment, maintaining sample hydration and allowing buffer exchange. |
| HEPES Buffered Saline Solution (10-50 mM, pH 7.4) | A physiologically relevant, non-coordinating buffer that maintains biomolecular structure and function during imaging. |
| Divalent Cations (MgCl₂, CaCl₂, 1-10 mM) | Often added to promote adsorption of negatively charged biomolecules (like DNA or certain proteins) to the mica surface. |
| BSA (Bovine Serum Albumin, 0.1-1 mg/mL) | Used to passivate substrates and liquid cell components to minimize non-specific adsorption of target molecules. |
| Ni-NTA Functionalized Tips & Substrates | For Force Spectroscopy: Enables specific, His-tag-mediated tethering of proteins for single-molecule unfolding studies. |
| PLL-PEG (Poly-L-Lysine-grafted-PEG) | A polymer brush coating for substrates or tips to create a non-adhesive, passivated background for specific binding experiments. |
Experimental Workflow for a Standard AFM Imaging Study
Standard AFM Imaging Workflow
Atomic Force Microscopy (AFM) represents a paradigm shift in nanoscale surface imaging, distinguished by its operational principle of mechanical probing rather than electromagnetic or electron beam irradiation. Within the broader thesis of nanoscale characterization, AFM is not merely an alternative to electron microscopy or optical super-resolution techniques; it is a complementary modality that provides unique, quantitative data unattainable by other methods. For biological and soft materials—including live cells, proteins, lipid bilayers, and hydrogels—AFM transcends the traditional imaging metric of spatial resolution. Its advantages lie in its ability to operate in physiologically relevant fluid environments, quantify nanomechanical properties, map molecular interaction forces, and manipulate samples, all while providing three-dimensional topographical data with sub-nanometer vertical resolution. This whitepaper details these capabilities through current technical insights, protocols, and data.
Quantitative Nanomechanical Mapping (QNM)
While high-resolution topographical imaging is a cornerstone, the capacity to simultaneously map elasticity (Young’s modulus), adhesion, deformation, and dissipation is AFM's standout feature for soft materials.
Experimental Protocol: PeakForce QNM on a Living Cell
- Probe Selection: Use a silicon nitride cantilever with a sharp tip (nominal radius < 10 nm) and a known spring constant (typically 0.1 - 0.6 N/m). Pre-calibrate the deflection sensitivity and spring constant via thermal tune.
- Sample Preparation: Culture adherent cells (e.g., HEK293, fibroblasts) on a glass-bottom Petri dish. Maintain in appropriate buffer/medium at 37°C using a stage-top incubator during imaging.
- Instrument Setup: Engage the PeakForce QNM mode. Set the PeakForce amplitude to 100-300 nm and frequency to 1-2 kHz to minimize sample disturbance.
- Data Acquisition: Map a scan area (e.g., 20 µm x 20 µm) at a resolution of 256 x 256 pixels. The system records force-distance curves at each pixel.
- Analysis: Fit the retraction segment of the force curve using the Derjaguin–Muller–Toporov (DMT) or Hertzian contact model to calculate Young’s modulus. Adhesion force is extracted from the minimum force of the retraction curve.
Table 1: Representative Nanomechanical Data from Biological Samples
| Sample | Young’s Modulus (kPa) | Adhesion Force (pN) | Measurement Mode | Key Insight |
|---|---|---|---|---|
| Living Mammalian Cell (Cytoplasm) | 1 - 10 | 50 - 200 | PeakForce QNM in fluid | Stiffness correlates with cytoskeletal organization; heterogeneity reveals subcellular compartments. |
| Collagen I Fibril | 1,000 - 5,000 | 100 - 500 | PeakForce QNM | High stiffness and D-periodicity (~67 nm) are clearly resolved, informing on fibril maturity. |
| Lipid Bilayer (Supported) | 100 - 300 | N/A (Breakthrough force) | Force Spectroscopy | Breakthrough force (~5-30 nN) quantifies bilayer mechanical integrity and phase state. |
| Alginate Hydrogel | 10 - 100 | 20 - 100 | PeakForce QNM | Maps cross-linking density gradient; informs drug release matrix design. |
Molecular Force Spectroscopy and Recognition Imaging
AFM can measure specific inter- and intra-molecular forces, transforming it into a single-molecule biomechanics tool.
Experimental Protocol: Single-Molecule Force Spectroscopy (SMFS) on a Protein
- Functionalization: Covalently attach the protein of interest (e.g., titin I27 domain) to a gold-coated substrate via a flexible PEG linker.
- Tip Modification: Functionalize a silicon nitride cantilever with the complementary binding partner (e.g., an antibody) or leave bare for unfolding studies.
- Force Curve Acquisition: In buffer solution, approach the tip to the surface, allow for binding, and retract at a constant velocity (500-1000 nm/s). Record 1000+ force-extension curves.
- Data Analysis: Identify specific binding/unfolding events by their characteristic force peaks and contour lengths. Fit the force-extension data with the Worm-Like Chain (WLC) model to obtain persistence length and contour length increment.
Diagram 1: Single-Molecule Force Spectroscopy Workflow
Title: Force Spectroscopy Experimental and Analysis Pathway
Operational in Physiological Fluids
This is AFM's most critical advantage for biology. It allows dynamic observation of processes like cell migration, protein assembly, and membrane remodeling in real-time.
Experimental Protocol: Time-Lapse Imaging of Protein Aggregation
- Sample Preparation: Immobilize a low concentration of amyloid-β (1-42) peptide on freshly cleaved mica in PBS buffer (pH 7.4).
- Imaging Setup: Use tapping mode in fluid with a soft cantilever (0.1-0.5 N/m). Set a slow scan rate and small scan size (e.g., 2 µm, 128 lines).
- Data Acquisition: Continuously scan the same area over 1-2 hours. Maintain temperature control at 37°C.
- Analysis: Measure the height and volume of oligomeric structures over time to derive aggregation kinetics.
The Scientist's Toolkit: Essential Research Reagents & Materials
Table 2: Key Reagent Solutions for Bio-AFM
| Item | Function & Explanation |
|---|---|
| Silicon Nitride Cantilevers (Soft) | Probes for imaging in liquid. Low spring constant (0.01-0.6 N/m) minimizes sample damage. Tip often functionalized. |
| MPC-coated Cantilevers | Prevents non-specific protein adsorption to the probe, crucial for clean force spectroscopy in biological fluids. |
| PEG Crosslinkers (e.g., NHS-PEG-NHS) | Provides a flexible, covalent tether for immobilizing biomolecules (proteins, DNA) to substrates or tips for SMFS. |
| Aminosilane (APTES) Solution | Functionalizes mica/glass/silicon substrates with amine groups for subsequent biomolecule attachment. |
| Ni-NTA Functionalized Tips/Substrates | Enforces specific, oriented binding of His-tagged proteins for recognition imaging or controlled force measurements. |
| Liquid Cell/Stage-Top Incubator | Maintains temperature, pH, and gas control (e.g., CO₂) for long-term imaging of live cells or tissues. |
| Calibration Gratings (e.g., TGZ1, PS/LDPE) | Verifies scanner accuracy and tip shape in both XY (pitch) and Z (height) dimensions before/after experiments. |
Diagram 2: AFM Modalities for Biological Research
Title: Core AFM Modalities and Primary Biological Applications
The thesis that AFM is indispensable for nanoscale surface imaging research is unequivocally supported by its application to biological and soft materials. Its advantages extend far beyond horizontal spatial resolution. By providing quantitative, multidimensional datasets—integrating topography, mechanics, and specific interaction forces under native conditions—AFM delivers insights fundamental to structural biology, biophysics, biomaterials engineering, and drug development. From characterizing the mechanical phenotype of cancer cells to measuring the binding strength of a drug candidate to its target, AFM empowers researchers to interrogate the nano-world in a physiologically relevant and quantitatively rigorous manner.
Within the framework of advanced nanoscale surface imaging research, the Atomic Force Microscope (AFM) stands as a cornerstone instrument. Its capability to provide three-dimensional topographical data with atomic-scale resolution under various environmental conditions has revolutionized materials science, biology, and pharmaceutical development. This technical guide delves into the four core components that define the functionality and performance of any AFM system: the cantilever, the tip, the laser, and the photodetector. The precise interplay between these elements enables the transduction of nanomechanical forces into quantifiable electrical signals, forming the basis for all AFM imaging modes.
The Cantilever: The Force Transducer
The cantilever is a flexible micro-fabricated beam that serves as the primary force sensor. Its mechanical properties dictate the system's sensitivity, speed, and operational mode.
Key Parameters:
- Spring Constant (k): Determines the force needed to deflect the cantilever. Must be matched to the sample's stiffness.
- Resonant Frequency (f₀): Critical for dynamic (tapping) mode operation. Higher frequencies enable faster scanning.
- Quality Factor (Q): A measure of damping, affecting sensitivity and response time in liquid vs. air environments.
Quantitative Data: Common Cantilever Types
| Parameter | Contact Mode Cantilever | Tapping Mode Cantilever | High-Resolution Cantilever (Bio) |
|---|---|---|---|
| Spring Constant | 0.01 - 0.5 N/m | 1 - 50 N/m | 0.1 - 0.6 N/m |
| Resonant Frequency | 5 - 40 kHz | 150 - 400 kHz | 10 - 70 kHz (in fluid) |
| Tip Radius | 10 - 30 nm | < 10 nm | < 10 nm |
| Typical Material | Si₃N₄, Si | Silicon | Silicon Nitride (Si₃N₄) |
Experimental Protocol: Cantilever Calibration via Thermal Tune Method
- Isolation: Place the AFM in an acoustically and vibrationally isolated environment.
- Engagement: Bring the cantilever close to, but not in contact with, a rigid sample surface.
- Data Acquisition: With the feedback loop disengaged, record the cantilever's deflection signal over time (≥ 1 sec at ~ 1 MHz sampling rate).
- Spectral Analysis: Perform a Fast Fourier Transform (FFT) on the time-domain data to obtain the power spectral density (PSD).
- Fitting: Fit the PSD peak corresponding to the fundamental resonant frequency to a simple harmonic oscillator model.
- Calculation: Calculate the spring constant (k) using the Equipartition Theorem: k = k_B T / ⟨x²⟩, where k_B is Boltzmann's constant, T is temperature, and ⟨x²⟩ is the mean-squared deflection from the thermal spectrum.
Diagram: Workflow for Cantilever Calibration via Thermal Tune.
The Tip: The Nanoscale Probe
The tip, located at the free end of the cantilever, is the physical point of interaction with the sample. Its geometry and chemistry define the lateral resolution and interaction forces.
Key Parameters:
- Tip Radius: Defines the sharpness; smaller radii yield higher resolution.
- Aspect Ratio: Height vs. width; high aspect ratios are needed for trench imaging.
- Coating: Functional coatings (e.g., diamond, magnetic, conductive) enable specialized modes.
Quantitative Data: Tip Specifications
| Tip Type | Nominal Radius | Aspect Ratio | Typical Coating | Primary Application |
|---|---|---|---|---|
| Standard Silicon | < 10 nm | Medium (3:1-5:1) | None or reflective Al | Topography in air |
| Ultra-Sharp Silicon | < 5 nm | Medium | None | High-res topography |
| High-Aspect Ratio | < 10 nm | High (≥ 10:1) | None or Diamond | Deep trenches, rough surfaces |
| Diamond-Coated | 20 - 50 nm | Low/Medium | Polycrystalline Diamond | Wear-resistant, hard samples |
| Conductive | 20 - 50 nm | Medium | Pt/Ir or Ti/Pt | EFM, KPFM, SSRM |
Experimental Protocol: Tip Characterization via Blind Reconstruction
- Characterization Sample: Image a known, sharp nanostructure (e.g., TipCheck grating with sharp spikes) at high resolution (512x512 pixels).
- Data Collection: Obtain a 3D topographic image of the characterization sample.
- Algorithmic Processing: Use deconvolution software (e.g., blind tip reconstruction). The algorithm treats the image as a dilation of the tip shape with the true sample shape.
- Iteration: The software iteratively estimates the tip shape that, when convolved with an estimated sample, would produce the measured image.
- Output: A 3D model of the tip apex geometry, providing effective tip radius and sidewall angles.
The Laser & Photodetector: The Deflection Measurement System
This optical lever system is the standard method for measuring cantilever deflection with sub-angstrom precision.
Key Components:
- Laser Diode: A coherent, low-noise light source (typically 650-850 nm wavelength) focused on the cantilever's free end.
- Position-Sensitive Photodetector (PSPD): A quadrant photodiode that converts the position of the reflected laser beam into electrical currents.
Principle: As the cantilever bends, the reflected laser spot moves on the PSPD. The differential current between quadrants is proportional to deflection (for topography) or oscillation amplitude/phase (for tapping mode).
Diagram: Optical Lever System for Deflection Detection.
Experimental Protocol: Alignment and Sensitivity Calibration
- Rough Alignment: Visually align the laser spot onto the cantilever end using a CCD camera.
- Fine Alignment: Adjust mirrors to maximize the sum signal (A+B+C+D) on the PSPD, centering the spot.
- Deflection Sensitivity Calibration: a. Engage the tip on a hard, clean surface (e.g., sapphire or freshly cleaved mica). b. Acquire a force-distance curve by extending and retracting the piezoelectric scanner. c. Identify the region of constant slope in the retract curve where the tip is in hard contact with the surface. d. Measure the slope of this linear segment (in volts vs. scanner displacement in nm). e. The inverse of this slope is the deflection sensitivity (nm/V), relating PSPD voltage to actual cantilever bending.
- Spring Constant Application: The force is then calculated using Hooke's Law: F = k * (Deflection Sensitivity * Voltage).
The Scientist's Toolkit: Essential Research Reagent Solutions
| Item | Function & Rationale |
|---|---|
| Calibration Gratings (TGZ series) | Grids with known pitch and height (e.g., 10μm pitch, 180nm step) for verifying scanner linearity and image dimensional accuracy in X, Y, and Z. |
| Tip Characterization Samples | Samples with sharp, sub-10 nm features (e.g., sharp spike arrays, carbon nanospikes) for performing blind tip reconstruction to determine effective tip shape. |
| Functionalized Cantilefers | Tips coated with specific chemical groups (e.g., -COOH, -NH2, biotin) or molecules (antibodies, ligands) for Chemical Force Microscopy (CFM) to map chemical or biological binding forces. |
| Conductive Probes (Pt/Ir coated) | Metal-coated tips with a conductive pathway for electrical characterization modes like Kelvin Probe Force Microscopy (KPFM) or conductive-AFM (C-AFM). |
| Mica Discs (Muscovite) | An atomically flat, easily cleavable substrate essential for preparing samples for high-resolution imaging of biomolecules (DNA, proteins, lipids) and soft materials. |
| Liquid Cell & O-rings | A sealed fluid chamber that allows AFM operation in buffer solutions, enabling in situ imaging of biological processes, electrochemical reactions, or polymer swelling. |
| Cantilever Cleaning Plasma | Oxygen or argon-oxygen plasma used to clean organic contaminants from cantilevers and samples, crucial for reproducible force measurements and imaging. |
| Vibration Isolation Platform | An active or passive air table that dampens environmental acoustic and seismic noise, which is critical for achieving stable imaging at atomic resolution. |
The cantilever, tip, laser, and photodetector form an integrated sensing chain where each component's performance critically impacts the final data's fidelity. In nanoscale research, particularly in drug development where characterizing macromolecular interactions or nanoparticle morphology is paramount, a rigorous understanding and precise calibration of these components are non-negotiable. The protocols and specifications outlined here provide a framework for researchers to optimize their AFM instrumentation, thereby ensuring that the nanoscale surface imaging data underpinning their thesis work is both quantitatively accurate and scientifically robust.
Atomic Force Microscopy (AFM) is a cornerstone technique for nanoscale surface imaging in materials science, biophysics, and drug development. Its resolution and contrast are fundamentally governed by the interplay of nanoscale forces between the probe tip and the sample surface. This whitepaper provides an in-depth technical analysis of the three primary forces—Van der Waals, electrostatic, and chemical—that dictate AFM imaging modes, outlines experimental protocols for their quantification, and situates this discussion within the broader thesis that precise control and understanding of these forces are critical for advancing quantitative nanomechanical and molecular recognition imaging.
Theoretical Framework of Nanoscale Forces
Van der Waals Interactions
Van der Waals (vdW) forces are ubiquitous, short-range attractions arising from correlated fluctuations of electron densities. In AFM, they dominate in non-polar environments and at small tip-sample separations (<10 nm). The interaction is often described by the Lennard-Jones potential, combining attractive (vdW) and repulsive (Pauli exclusion) components.
Table 1: Characteristics of Core Nanoscale Forces in AFM
| Force Type | Origin | Effective Range | Typical Magnitude (AFM) | Dependence on Distance (r) | Primary AFM Mode |
|---|---|---|---|---|---|
| Van der Waals | Transient dipole-induced dipole interactions | 0.2 - 10 nm | 0.1 - 10 nN | ∝ 1/r^6 (non-retarded) | Contact Mode, Non-contact Mode |
| Electrostatic | Coulomb interaction between charges | 1 nm - 1 μm | 0.01 - 100 nN | ∝ 1/r^2 (point charges) | Kelvin Probe Force Microscopy (KPFM), Electrostatic Force Microscopy (EFM) |
| Chemical/Bond | Orbital overlap, covalent/ionic bonding | < 0.5 nm | 0.1 - 10 nN (specific) | Exponential decay | Chemical Force Microscopy (CFM), PeakForce Tapping |
Electrostatic Interactions
Electrostatic forces arise from Coulombic attraction or repulsion between charged or polarized surfaces. In aqueous biological AFM, they are modulated by ionic strength and pH. They are long-range and critical for imaging in ambient or vacuum conditions, where surface potentials can be significant.
Chemical Interactions
Chemical forces are short-range, high-magnitude forces resulting from the formation of covalent, ionic, or hydrogen bonds. They require atomic-scale contact and specific molecular recognition (e.g., ligand-receptor pairs). Their measurement enables functional group identification and single-molecule binding studies.
Experimental Protocols for Force Measurement and Mapping
Force-Distance (F-D) Curve Spectroscopy
Objective: To quantitatively dissect the contribution of each force component as a function of tip-sample separation. Protocol:
- Probe Functionalization: Cantilevers are cleaned in UV-ozone or piranha solution. For chemical mapping, tips are silanized and conjugated with specific molecules (e.g., thiols, biotin).
- Calibration: The optical lever sensitivity (nm/V) and the cantilever's spring constant (typically 0.01-1 N/m for bio-AFM) are calibrated via thermal tuning or the Sader method.
- Data Acquisition: The piezo scanner extends the sample towards the tip at a controlled rate (10-1000 nm/s). The deflection is recorded vs. position.
- Analysis: The raw data is converted to force vs. separation using Hooke's Law (F = -k * δ). The jump-to-contact, adhesion pull-off force, and the slope in contact are analyzed to infer vdW, electrostatic, and chemical contributions.
Kelvin Probe Force Microscopy (KPFM)
Objective: To map surface potential and decouple electrostatic from topographic signals. Protocol:
- Setup: A conductive, metal-coated tip (e.g., Pt/Ir) is used in a two-pass lift mode (AM- or FM-KPFM).
- First Pass: Topography is captured in tapping mode.
- Second Pass: The tip lifts to a constant height (10-100 nm). An AC voltage (ω) is applied, and a DC nulling voltage is automatically adjusted via feedback to nullify the electrostatic force at frequency ω. This DC voltage equals the contact potential difference (CPD).
- Mapping: The CPD is mapped pixel-by-pixel, providing a quantitative work function or surface charge map.
Chemical Force Microscopy (CFM)
Objective: To map chemical heterogeneity via adhesion force mapping. Protocol:
- Tip and Sample Functionalization: Tips and samples are modified with self-assembled monolayers (SAMs) terminating in specific functional groups (e.g., -CH3, -COOH, -NH2).
- Adhesion Mapping: In force-volume or PeakForce QNM mode, an array of F-D curves is acquired over the surface.
- Data Processing: The adhesion force (pull-off force) from each curve is extracted and plotted as a 2D map. Statistical analysis of adhesion histograms identifies distinct chemical domains.
Diagram Title: AFM Nanoscale Force Measurement Workflow
The Scientist's Toolkit: Essential Research Reagents & Materials
Table 2: Key Research Reagent Solutions for AFM Force Studies
| Item | Function/Description | Example Product/Chemical |
|---|---|---|
| Functionalized AFM Probes | Tips coated with specific chemicals or biorecognition elements for CFM or biosensing. | Bruker MLCT-BIO-DC (biotinylated), NanoAndMore HQ:NSC18/Cr-Au (alkanethiol-ready). |
| Self-Assembled Monolayer (SAM) Kits | For controlled functionalization of gold-coated tips/samples with -CH3, -COOH, -NH2 terminal groups. | 1-Octadecanethiol, 11-Mercaptoundecanoic acid, (3-Aminopropyl)triethoxysilane (APTES). |
| Ionic Solution Concentrates | To control electrostatic double-layer forces by adjusting ionic strength and pH in liquid AFM. | Phosphate Buffered Saline (PBS), Tris-EDTA Buffer, HEPES Buffer. |
| Cantilever Calibration Kits | Certified reference samples for accurate spring constant and sensitivity calibration. | Bruker PN: 001-900, Asylum Research ARC2 Calibration Sample. |
| UV-Ozone Cleaner | For rigorous cleaning and activation of probe and sample surfaces prior to functionalization. | Novascan PSD-UV Series, Jelight 42A-220. |
| PeakForce QNM Capture Fluid | Optimized liquid for stable, high-resolution mechanical property mapping in liquid. | Bruker PF-Capture-Fluid. |
| Specific Ligand-Receptor Pairs | For single-molecule force spectroscopy (SMFS) studies of binding kinetics. | Biotin-Streptavidin, Antigen-Antibody conjugates, Integrin-RGD peptide. |
Data Interpretation and Integration into AFM Imaging Thesis
The deconvolution of force contributions is essential for artifact-free imaging and quantitative analysis. For instance, in PeakForce Tapping mode, the peak repulsive force is precisely controlled, allowing the simultaneous mapping of topography, adhesion (chemical/electrostatic), and elasticity. Integrating force spectroscopy with high-speed imaging enables dynamic studies, such as monitoring drug-induced changes in cell membrane mechanics or the assembly of protein complexes in real time. This forms the core thesis: that modern AFM transcends simple topography to become a multidimensional nanoscience platform, where the deliberate exploitation of vdW, electrostatic, and chemical forces unlocks functional and mechanical property mapping critical for drug targeting, polymer science, and semiconductor diagnostics.
Diagram Title: Force Regimes in AFM Tip-Sample Interaction
This whitepaper provides an in-depth technical comparison between Atomic Force Microscopy (AFM) and Optical Microscopy, contextualized within the broader thesis that AFM is an indispensable tool for nanoscale surface imaging research. The drive to visualize and manipulate matter at the nanometer scale is fundamental in materials science, nanotechnology, and drug development. While optical microscopy offers accessibility and live-cell imaging, its resolution is fundamentally limited by the diffraction of light. AFM overcomes this barrier by employing a physical probe, achieving atomic-scale resolution and providing quantitative mechanical and topological data. This document details the core principles, experimental protocols, and applications of both techniques, with a focus on bridging the informational gap between them for research professionals.
Core Principles and Resolution Limits
The defining difference lies in their imaging mechanisms and the consequent resolution limits.
Optical Microscopy utilizes lenses to focus visible light (∼400-700 nm wavelength) to form a magnified image. Its maximum lateral resolution, as defined by the Abbe diffraction limit, is approximately half the wavelength of light used, typically around 200-250 nm. Axial resolution is lower, often >500 nm. Advanced techniques like Stimulated Emission Depletion (STED) or Single-Molecule Localization Microscopy (SMLM: PALM/STORM) can bypass this limit, but often require specialized fluorophores and complex sample preparation.
Atomic Force Microscopy employs a sharp tip (radius of curvature ∼1-10 nm) mounted on a flexible cantilever. The tip is raster-scanned across a surface, and forces between the tip and sample (van der Waals, mechanical contact, electrostatic) cause cantilever deflection. This deflection is measured, typically via a laser beam reflected off the cantilever onto a photodetector. By maintaining a constant force or height, a topographical map is generated. AFM resolution is determined by tip sharpness and operational environment, achieving sub-nanometer lateral and atomic-scale vertical resolution. It requires no lenses or specific wavelength, operating in vacuum, air, or liquid.
The quantitative comparison is summarized in Table 1.
Table 1: Quantitative Comparison of AFM and Optical Microscopy
| Parameter | Optical Microscopy (Widefield/Confocal) | Super-Resolution Optical (STED/SMLM) | Atomic Force Microscopy (AFM) |
|---|---|---|---|
| Lateral Resolution | ∼200-250 nm (diffraction-limited) | 20-50 nm | 0.5-10 nm (sub-nanometer achievable) |
| Axial Resolution | ∼500-800 nm (confocal: ∼500 nm) | 50-100 nm | <0.1 nm (vertical) |
| Working Distance | Millimeters | Millimeters | Nanometers (tip-sample distance) |
| Field of View | Millimeters | 10s of Micrometers | Micrometers to ∼100 µm |
| Imaging Medium | Air, liquid (live-cell compatible) | Air, liquid (often fixed samples) | Vacuum, air, liquid (live-cell compatible) |
| Throughput/Speed | High (real-time video rate) | Low (seconds to minutes per frame) | Low (seconds to minutes per frame) |
| Sample Requirement | Often requires labeling/fluorescence | Requires specific fluorophores, often fixed | Minimal preparation; conductive/non-conductive; can be label-free |
| Data Type | Optical intensity, color, fluorescence | Super-resolved fluorescence localization | 3D Topography, mechanical (elasticity, adhesion), electrical, magnetic |
Experimental Protocols
Protocol 1: Tapping Mode AFM for Nanoscale Topography in Liquid
This protocol is critical for imaging soft, biological samples like lipid bilayers or live cells in physiological conditions.
- Cantilever Selection: Choose a silicon nitride cantilever with a nominal spring constant of ∼0.1-0.5 N/m and a resonant frequency of ∼5-20 kHz in liquid. Ensure the tip is sharp (radius <10 nm).
- Sample Preparation: Immobilize the sample (e.g., supported lipid bilayer, fixed cells) firmly on a clean glass or mica substrate. For live cells, use a biocompatible petri dish. Place the substrate in the AFM fluid cell.
- System Setup: Mount the chosen cantilever. Inject the appropriate buffer solution into the fluid cell, avoiding bubbles. Engage the laser and align the photodetector to maximize sum and minimize difference signals.
- Frequency Tune: Drive the cantilever with a piezo and perform a frequency sweep to identify its resonant frequency in the current liquid medium.
- Engagement and Scanning: Approach the tip to the surface using a slow, automated approach. Engage in Tapping Mode (AC mode) at ∼90-95% of the resonant frequency. Set the amplitude setpoint to minimize force while maintaining stable tracking. Scan at a rate of 0.5-2 Hz with 512x512 pixels.
- Data Acquisition: Record height (topography), amplitude (error), and phase (material property) channels simultaneously. Apply online flattening to remove tilt.
Protocol 2: dSTORM Super-Resolution Imaging of Cellular Cytoskeleton
This protocol highlights a leading super-resolution optical method for bridging the resolution gap.
- Sample Preparation: Culture cells on high-precision #1.5 coverslips. Fix, permeabilize, and label the target (e.g., actin with phalloidin conjugated to a photoswitchable dye like Alexa Fluor 647).
- Imaging Buffer Preparation: Prepare a photoswitching buffer containing: 50-100 mM mercaptoethylamine (MEA, an oxygen scavenger), glucose oxidase, catalase, and 5-10% glucose in PBS. This buffer induces stochastic blinking of the fluorophores.
- Microscope Setup: Use a Total Internal Reflection Fluorescence (TIRF) microscope equipped with high-power 640 nm and 405 nm lasers, and a high-quantum-efficiency, low-noise EMCCD or sCMOS camera.
- Data Acquisition: Initially use high-intensity 640 nm laser to switch most fluorophores to a dark state. Use a low level of 405 nm activation light to stochastically reactivate a sparse subset of molecules. Image this subset until they bleach. Repeat this cycle for 10,000-50,000 frames.
- Localization and Reconstruction: Use specialized software (e.g., ThunderSTORM, Picasso) to fit the Point Spread Function (PSF) of each detected single molecule to a 2D Gaussian, determining its centroid with nanometer precision (±10-20 nm). Render all localized positions into a final super-resolution image.
Logical Workflow for Technique Selection
The following diagram illustrates the decision-making process for selecting between AFM and Optical Microscopy based on research goals.
Technique Selection Workflow for Nanoscale Imaging
The Scientist's Toolkit: Key Research Reagent Solutions
Table 2: Essential Materials for Nanoscale Imaging Experiments
| Item | Function/Description | Typical Application |
|---|---|---|
| Freshly Cleaved Mica Discs (V1 Grade) | Atomically flat, negatively charged silicate substrate. | Ideal substrate for AFM imaging of biomolecules (DNA, proteins, lipid bilayers) and nanoparticles. |
| Silicon Nitride AFM Cantilevers (e.g., Bruker SNL, Olympus RC800PSA) | Low spring constant (∼0.1-0.6 N/m) for soft samples; sharp tip. | Tapping Mode AFM in liquid for biological samples. |
| Photoswitchable Fluorophores (e.g., Alexa Fluor 647, CF680) | Fluorophores that can be cycled between fluorescent and dark states with specific wavelengths. | Essential for Single-Molecule Localization super-resolution microscopy (dSTORM/PALM). |
| Oxygen Scavenging System (Glucose Oxidase, Catalase, β-Mercaptoethylamine) | Reduces photobleaching and induces stochastic blinking of dyes. | Critical buffer component for dSTORM imaging to achieve single-molecule localization. |
| Poly-L-Lysine or Cell-Tak | Adhesive coatings for immobilizing cells or biomolecules on substrates. | Improves sample adherence for both AFM and optical microscopy, preventing drift. |
| High-Precision #1.5 Coverslips (≤170 µm thick) | Optical glass with strict thickness tolerance for high-NA oil immersion objectives. | Required for optimal performance in super-resolution and confocal microscopy. |
| AFM Calibration Gratings (e.g., TGZ1, PG, HS-100MG) | Grids with known pitch and step height (from nm to µm). | Critical for verifying the lateral and vertical scale calibration of the AFM scanner. |
The resolution gap between optical microscopy and the nanometer scale is bridged by two complementary approaches: super-resolution optical techniques, which cleverly circumvent the diffraction limit, and Atomic Force Microscopy, which abandons optical principles entirely for physical probing. Within the thesis of advancing nanoscale surface imaging, AFM stands out for its unmatched vertical resolution, label-free operation, and multiparametric nanomechanical capability. However, the choice is not mutually exclusive. Correlated microscopy, integrating the molecular specificity of super-resolution optics with the topographical and mechanical data from AFM, represents the most powerful frontier. For researchers and drug development professionals, the strategic selection and potential integration of these tools, guided by the specific requirements of throughput, sample type, and data needed, are paramount to unlocking discoveries at the nanoscale.
Atomic Force Microscopy (AFM) has become a cornerstone technique for nanoscale surface imaging research, providing three-dimensional topographic data with sub-nanometer resolution. Beyond simple height mapping, modern AFM leverages multiple detection channels to simultaneously extract diverse mechanical and chemical properties. This technical guide provides an in-depth analysis of the three primary imaging modes: Topography, Force, and Phase. Within the broader thesis of AFM for advanced material and biological research, these channels form an integrated toolkit for correlating structure with function at the nanoscale, a capability critical for fields ranging from polymer science to drug development.
Core Imaging Channels: Principles and Data
Topography Channel
The topography channel is the fundamental output of AFM, mapping the vertical (z-axis) displacement of the cantilever as it traces the sample surface. In contact mode, this is a direct measure of height. In intermittent contact (tapping) mode, a feedback loop maintains constant oscillation amplitude, converting the required z-piezo movement into a height image.
Key Quantitative Parameters:
- Vertical Resolution: <0.1 nm (under ideal conditions).
- Lateral Resolution: 0.5 - 5 nm, dependent on tip radius.
- Typical Scan Rate: 0.5 - 2 Hz per line.
Force Channel (Force-Volume & Force-Distance Curves)
This channel measures the interaction force between the tip and sample as a function of their separation. By recording the cantilever deflection vs. z-piezo position at each pixel (or selected points), a force-distance curve is generated, yielding quantitative nanomechanical properties.
Key Quantitative Parameters from Force-Distance Analysis:
Table 1: Measurable Parameters from Force-Distance Curves
| Parameter | Symbol | Typical Units | Physical Meaning |
|---|---|---|---|
| Adhesion Force | F_adh | nN | Minimum force in retraction curve; work required to separate tip from sample. |
| Elastic Modulus | E | kPa - GPa | Derived from indentation region using models (e.g., Hertz, Sneddon). |
| Deformation | δ | nm | Sample indentation depth at maximum load. |
| Stiffness / Young's Modulus | k, E | N/m, Pa | Slope of the contact region; material rigidity. |
Phase Channel (in Tapping Mode)
In tapping mode, the phase channel records the phase lag (φ) between the sinusoidal signal driving the cantilever and its actual oscillation response. This lag is sensitive to energy dissipation processes during tip-sample interaction, including viscoelasticity, adhesion, and capillary forces.
Key Quantitative Interpretation:
- Negative Phase Shift (φ < 0): Indicates a "hard" or elastic interaction (energy transfer from cantilever to sample).
- Positive Phase Shift (φ > 0): Indicates a "soft" or inelastic interaction (e.g., adhesion, plasticity, high dissipation).
- Magnitude of Shift: Correlates with the extent of energy dissipation.
Table 2: Comparison of Primary AFM Imaging Channels
| Channel | Primary Measurand | Information Conveyed | Main Artifacts | Best For |
|---|---|---|---|---|
| Topography | Height (z-piezo motion) | 3D surface morphology, roughness, feature dimensions. | Tip convolution, scanner nonlinearities, drift. | Mapping surface shape and texture at the nanoscale. |
| Force | Cantilever deflection vs. distance | Adhesion, modulus, stiffness, deformation, long-range forces. | Tip contamination, thermal drift, slow acquisition. | Quantifying nanomechanical properties and specific binding forces. |
| Phase | Phase lag of oscillation | Material contrast, viscoelasticity, energy dissipation, composition. | Sensitive to drive frequency & amplitude; qualitative without modeling. | Differentiating materials in composite samples and mapping dissipative interactions. |
Experimental Protocols
Protocol 1: Simultaneous Topography and Phase Imaging in Tapping Mode
This is the most common multimodal experiment for correlated structural and material property mapping.
- Sample Preparation: Mount sample firmly on a magnetic or adhesive disk. For biological samples, immobilize in appropriate buffer via adsorption or chemical fixation.
- Cantilever Selection: Choose a cantilever with a resonant frequency (f₀) appropriate for the medium (e.g., 70-90 kHz in air, 20-40 kHz in liquid) and a spring constant (k) of 1-40 N/m.
- System Setup: Engage the laser alignment on the cantilever back. Adjust photodetector to obtain a sum signal near maximum and zero vertical/horizontal deflection signals.
- Tuning: Autotune the cantilever to find f₀. Set the drive frequency slightly below f₀ for stable oscillation. Adjust drive amplitude (Adrive) to achieve a free-air amplitude (Afree) of 10-100 nm.
- Engagement & Setpoint Optimization: Engage the tip onto the surface. Set the amplitude setpoint (Asp) to 70-90% of Afree to establish stable, low-force imaging.
- Scan Parameter Definition: Set scan size, resolution (e.g., 512x512 pixels), and scan rate (0.5-1.5 Hz). Enable simultaneous capture of Height (topography) and Phase data channels.
- Data Acquisition: Initiate scan. Monitor both channels in real-time, adjusting setpoint and feedback gains (proportional and integral) to optimize tracking and minimize noise.
- Post-processing: Apply first-order flattening or plane fitting to topography data. Phase data is typically presented raw or with a zero-order flatten.
Protocol 2: Force-Volume Imaging for Nanomechanical Mapping
This protocol spatially maps force curves to create images of adhesion and modulus.
- Steps 1-3: As per Protocol 1 for initial setup.
- Cantilever Calibration: Precisely calibrate the cantilever's spring constant (k) using the thermal tune method. Calibrate the optical lever sensitivity (InvOLS) by acquiring a force curve on a hard, clean surface (e.g., sapphire).
- Force Curve Parameter Setup: Define the force curve trigger. Key parameters:
- Trigger Mode: Relative (deflection setpoint, e.g., 5-20 nN).
- Extend/Retract Velocity: 0.5-2 µm/s to minimize hydrodynamic effects.
- Z-length: Sufficient to include non-contact and contact regions (e.g., 500 nm).
- Samples per Curve: 512-1024 points.
- Scan Grid Definition: Define the scan area and the grid of points where force curves will be acquired (e.g., 32x32 or 64x64 over the area of interest).
- Acquisition: Initiate Force-Volume scan. The system will approach, acquire a force curve, retract, and move to the next pixel.
- Data Analysis: Use specialized software (e.g., AtomicJ, NanoScope Analysis, JPK DP) to batch-analyze all curves. Fit the contact region with the Hertz/Sneddon model to extract elastic modulus (E) and record adhesion force (F_adh) for each pixel.
- Image Reconstruction: Generate 2D maps from the arrays of calculated E and F_adh values, correlating them with the topographic map of the same grid.
Visualizing AFM Multimodal Data Acquisition
Diagram Title: AFM Multimodal Data Acquisition Workflow
The Scientist's Toolkit: Essential Research Reagents & Materials
Table 3: Key Materials for Advanced AFM Imaging Research
| Item | Function & Rationale |
|---|---|
| Silicon Nitride (Si₃N₄) Cantilevers (e.g., Bruzer MLCT, SWCNL) | Standard for contact mode and force spectroscopy in liquid. Low spring constant (0.01-0.6 N/m) minimizes sample damage. Coated with reflective gold or aluminum. |
| Silicon (Si) Cantilevers (e.g., Budget Sensors Tap300, NanoWorld ARROW) | Standard for tapping mode in air and liquid. Typical resonance frequency 70-350 kHz. Tips are sharp (radius <10 nm) for high resolution. |
| Functionalized Tips (e.g., tips with COOH, NH₂, or streptavidin) | Enable chemical force microscopy and specific molecular recognition. Coating allows measurement of specific adhesion or mapping of ligand-receptor distributions. |
| Calibration Gratings (e.g., TGZ, PG, HS Series) | Essential for verifying scanner accuracy and tip sharpness. Provide known pitch and step heights (from nm to µm). Common materials: silicon, silicon oxide. |
| Mica Substrates (Muscovite) | An atomically flat, negatively charged surface. Used as a substrate for imaging biomolecules (DNA, proteins) and 2D materials (graphene) after cleaving. |
| Polydimethylsiloxane (PDMS) Sheets | Used as a soft, elastomeric substrate for studying cell mechanics or as a stamp for patterning. Its known modulus serves as a reference for force calibration. |
| Buffer Solutions (PBS, HEPES, Tris) | Maintain physiological pH and ionic strength for biological samples in liquid imaging. Prevent dehydration and denaturation. |
| Adhesive Tabs / Mounting Discs | Double-sided, high-tack adhesive. Securely immobilize the sample onto the AFM specimen stub to prevent drift during scanning. |
Practical AFM Modes and Cutting-Edge Applications in Biomedicine
Atomic Force Microscopy (AFM) is a cornerstone technique in nanoscale surface imaging research, enabling the visualization and quantification of topographical and mechanical properties at the atomic and molecular scale. The selection of the operational imaging mode—Contact, Tapping (also known as AC mode or Intermittent Contact), or Non-Contact—is a fundamental decision that directly dictates data fidelity, sample integrity, and the type of extractable information. This technical guide, framed within the broader thesis of optimizing AFM for advanced research in nanoscience and drug development, provides a detailed comparison of these core modes, their underlying physical principles, and their application-specific protocols.
Core Principles & Quantitative Comparison
The operational mode is defined by the force regime in which the probe tip interacts with the sample surface. The central parameter is the tip-sample force, which must be minimized to avoid sample damage while maintaining sufficient interaction for signal detection.
Table 1: Quantitative Comparison of Primary AFM Modes
| Parameter | Contact Mode | Tapping Mode (AC) | Non-Contact Mode |
|---|---|---|---|
| Tip-Sample Force | High (10⁻⁹ to 10⁻⁷ N) | Low (10⁻¹⁰ to 10⁻⁹ N) | Very Low (< 10⁻¹⁰ N) |
| Tip Oscillation | None (Static Deflection) | Large Amplitude (20-100 nm), Intermittent Contact | Small Amplitude (< 10 nm), No Contact |
| Lateral Forces | High (Significant Shear) | Negligible | None |
| Typical Resolution | Atomic Lattice (in liquid) | Molecular (~1 nm lateral) | Atomic (in UHV) |
| Sample Damage Risk | Very High for soft samples | Low | Extremely Low |
| Optimal Environment | Liquid, Controlled Gas | Air, Liquid | Ultra-High Vacuum (UHV) |
| Primary Feedback Signal | Static Cantilever Deflection | Oscillation Amplitude or Phase | Oscillation Frequency/Phase Shift |
| Key Measurable Properties | Topography, Friction (LFM) | Topography, Phase (Material Stiffness/Adhesion) | Topography, Magnetic/Electric Forces |
Detailed Methodologies & Experimental Protocols
Contact Mode Protocol
Principle: The probe tip is in constant physical contact with the sample surface. A feedback loop maintains a constant cantilever deflection (constant force) by adjusting the scanner height.
- Probe Selection: Use a cantilever with a low spring constant (k ≈ 0.01 - 0.5 N/m) to minimize indentation force. Sharp, non-coated tips (e.g., Si₃N₄) are standard.
- Engagement: Approach the surface until a pre-set deflection threshold (e.g., 0.5 - 1 V) is detected.
- Feedback Parameter Tuning: Set the integral and proportional gains to achieve stable tracking without oscillation. Typical scan rates are 1-3 Hz.
- Imaging: Record height (Z-actuator displacement) and deflection error signal channels simultaneously.
Tapping Mode (AC Mode) Protocol
Principle: The cantilever is driven at or near its resonant frequency (f₀). The oscillating tip lightly "taps" the surface, causing a reduction in amplitude, which is used as the feedback parameter.
- Probe Selection: Use a cantilever with a moderate spring constant (k ≈ 1-50 N/m) and a high resonant frequency. Coated reflective backside is standard.
- Drive Tuning: Prior to engagement, tune the drive frequency to the resonant peak in air or liquid. Set the free oscillation amplitude (A₀), typically 20-100 nm.
- Engagement & Setpoint: Engage the surface. The setpoint amplitude (Asp) is chosen as a fraction of A₀ (e.g., Asp = 0.7–0.9 A₀). A lower ratio increases force.
- Imaging: Record height and phase shift (lag between drive and tip oscillation) channels. The phase image provides compositional contrast.
Non-Contact Mode Protocol
Principle: The cantilever oscillates with a very small amplitude (<10 nm) close to, but not touching, the surface. Long-range van der Waals forces cause a shift in the resonant frequency (∆f), which is the feedback parameter.
- Environment & Probe: Requires ultra-high vacuum (UHV) or extremely clean, dry conditions to prevent meniscus formation. Use very stiff cantilevers (k > 100 N/m) with high f₀ and high Q-factor.
- Frequency Modulation (FM) Detection: The system locks into the resonant frequency. The frequency shift ∆f is the primary feedback signal.
- Engagement: Approach until a detectable ∆f (e.g., -10 to -100 Hz) is achieved.
- Imaging: Maintain a constant ∆f while scanning. Force gradients are mapped directly.
Diagram 1: AFM Mode Decision Workflow
The Scientist's Toolkit: Key Research Reagent Solutions
Table 2: Essential AFM Materials & Reagents
| Item | Function & Rationale |
|---|---|
| Si₃N₄ Tips (Low k) | For Contact Mode in liquid. Biocompatible, low spring constant minimizes cell or soft material damage. |
| Silicon Tips (RTESPA) | Standard for Tapping Mode in air. Moderate stiffness (~40 N/m) and high resonance frequency for stable oscillation. |
| Heavily Doped Si Tips (PPP-FMR) | For Non-Contact MFM/EFM. High conductivity and stiff lever (k > 100 N/m) for detecting magnetic/electric forces. |
| Cantilever Calibration Grid | A grating with known pitch and step height (e.g., TGZ1/TGQ1) for lateral and vertical sensitivity calibration. |
| Mica Discs (V1 Grade) | An atomically flat, negatively charged substrate for adsorbing biomolecules (DNA, proteins) or 2D materials. |
| PLL or Poly-L-Lysine Solution | A cationic polymer used to coat substrates (mica, glass) to enhance adhesion of cells or negatively charged samples. |
| Liquid Cell (Fluid Chamber) | A sealed chamber for imaging in physiological buffers, enabling live-cell or in-situ electrochemical AFM. |
| Vibration Isolation Table | Critical infrastructure to decouple the AFM from ambient building vibrations (sub-Ångstrom stability required). |
Diagram 2: Key AFM Substrate Functionalization for Biosamples
The choice between Contact, Tapping, and Non-Contact AFM modes is not merely technical but strategic, influencing the success of nanoscale research. Contact mode, while powerful for atomic imaging in liquids and friction studies, imposes high lateral forces. Tapping mode emerges as the versatile workhorse for delicate soft materials, including polymers and biological specimens, by virtually eliminating shear forces. Non-Contact mode, under stringent vacuum conditions, achieves the highest resolution and enables direct force gradient mapping for advanced physical property studies. Integrating the correct mode with the appropriate protocols and materials, as detailed in this guide, is essential for generating reliable, high-fidelity data that advances the frontiers of nanoscience and pharmaceutical development.
Within the broader thesis on Atomic Force Microscopy (AFM) for nanoscale surface imaging research, this work establishes the critical role of advanced AFM modalities in structural biology. The central thesis posits that high-resolution imaging under near-native, physiological conditions is not merely complementary but essential for elucidating the structure-function relationships of biomolecular complexes, thereby directly informing rational drug design and mechanistic studies.
Core Imaging Modalities and Quantitative Comparison
The following table summarizes the key AFM-based techniques for near-native biomolecular imaging, their capabilities, and limitations.
Table 1: Quantitative Comparison of AFM Modalities for Biomolecular Imaging
| Technique | Typical Resolution (Lateral/Vertical) | Optimal Buffer Conditions | Key Biomolecular Application | Throughput | Key Limitation |
|---|---|---|---|---|---|
| Contact Mode | 2-5 nm / 0.1 nm | Low ionic strength (<150 mM), no divalent cations | Lipid bilayer morphology, large protein complexes | Medium | High shear forces can displace/damage samples. |
| Amplitude Modulation (Tapping) | 1-3 nm / 0.1 nm | Physiological buffers (PBS, Tris), up to 150 mM NaCl | Proteins, DNA-protein complexes, live cells | High | Can induce transient interactions with tip. |
| Frequency Modulation (FM-AFM) | 0.5-1 nm / 50 pm | Liquid, ultra-pure water or mild buffers | Sub-molecular protein features, DNA duplexes | Low | Extremely sensitive to thermal drift and vibration. |
| High-Speed AFM (HS-AFM) | 2-4 nm / 0.2 nm (per frame) | Low viscosity buffers, 37°C | Dynamic processes (membrane protein diffusion, enzymatic action) | Very High | Lower single-image resolution, sample must be firmly adsorbed. |
| PeakForce Tapping | 1-2 nm / 10 pm | Full physiological conditions, including serum | Force spectroscopy mapping, fragile protein assemblies | Medium-High | Complex feedback optimization required. |
Detailed Experimental Protocols
Protocol for Imaging Supported Lipid Bilayers (SLBs) in Buffer
Objective: To image the nanoscale organization and phase separation of lipid bilayers under physiological ionic strength.
- Substrate Preparation: Cleave Muscovite mica using adhesive tape. Treat in plasma cleaner for 60 seconds to achieve a hydrophilic surface.
- Vesicle Preparation: Dissolve lipids (e.g., DOPC/DPPC/Cholesterol 1:1:1) in chloroform, dry under nitrogen, and desiccate overnight. Hydrate lipid film in HEPES buffer (20 mM HEPES, 150 mM NaCl, pH 7.4) to 1 mg/mL. Extrude through a 50 nm polycarbonate membrane 21 times.
- Bilayer Formation: Deposit 100 µL of vesicle solution onto freshly cleaved mica in a fluid cell. Incubate for 30 minutes at 60°C. Rinse extensively with imaging buffer (same as above) to remove unfused vesicles.
- AFM Imaging: Mount cell on AFM. Use a silicon nitride cantilever (k ≈ 0.1 N/m, f₀ ≈ 10 kHz in liquid). Engage in amplitude modulation mode with a drive frequency slightly below resonance. Set amplitude ~1 nm and setpoint ~95% of free amplitude. Scan at 1-2 Hz.
Protocol for High-Resolution DNA and DNA-Protein Complex Imaging
Objective: To visualize the contour length and protein-binding sites of double-stranded DNA.
- Sample Adsorption: Dilute linearized plasmid DNA (e.g., 3 kbp) to 1-2 ng/µL in deposition buffer (10 mM NiCl₂, 10 mM HEPES, pH 7.5). Deposit 20 µL onto freshly cleaved mica for 2 minutes. Rinse gently with ultrapure water and blow dry with argon.
- For Complexes: Pre-incubate DNA with protein (e.g., a transcription factor) at a 1:5 molar ratio in binding buffer for 15 minutes at room temperature before deposition.
- AFM Imaging: Perform imaging in air using tapping mode with a high-resonance-frequency silicon tip (f₀ > 300 kHz, k ~ 40 N/m). Use low amplitude (~10 nm) and low scan rate (0.5-1 Hz) for optimal resolution.
Protocol for PeakForce Tapping Imaging of Membrane Proteins
Objective: To map the topography and mechanical properties of reconstituted membrane proteins in a lipid bilayer without displacement.
- Sample Preparation: Reconstitute purified protein (e.g., GPCR) into proteoliposomes as per standard biochemistry protocols. Fuse proteoliposomes onto mica to form a bilayer as in Protocol 3.1.
- Cantilever Calibration: Calibrate a sharp PeakForce Tapping cantilever (e.g., ScanAsyst-Fluid+, k ~ 0.7 N/m) in the imaging buffer using the thermal tune method.
- Imaging Parameters: Set PeakForce frequency to 1-2 kHz. Adjust the PeakForce Setpoint to the minimum value that maintains stable contact (typically 50-150 pN). Optimize the feedback gains to track topography accurately. Scan at 0.5-1 Hz.
Visualization of Workflows
Workflow for Near-Native AFM Imaging
AFM Informs Drug Design via Mechanism
The Scientist's Toolkit: Essential Research Reagents & Materials
Table 2: Key Research Reagent Solutions for Near-Native AFM
| Item | Function & Rationale | Example Product/Chemical |
|---|---|---|
| Muscovite Mica (V1 Grade) | Atomically flat, negatively charged substrate for adsorbing biomolecules via cation bridges (e.g., Mg²⁺, Ni²⁺). | SPI Supplies V-1 Quality |
| Aminosilane-Functionalized Substrates | Provides positive charge for electrostatic anchoring of negatively charged samples (e.g., DNA, membranes). | (3-Aminopropyl)triethoxysilane (APTES) |
| Lipids for Bilayer Formation | High-purity lipids to form stable, fluid supported lipid bilayers (SLBs) as native-like membranes. | Avanti Polar Lipids: DOPC, DPPC, Cholesterol |
| Biocompatible Imaging Buffer | Maintains physiological pH and ionic strength while minimizing tip-sample interactions. | HEPES (20 mM) with NaCl (150 mM), pH 7.4 |
| Divalent Cation Solution | Facilitates adsorption of polyanionic biomolecules (DNA, certain proteins) to mica. | MgCl₂ or NiCl₂ (5-10 mM) |
| BSA or Casein | Used as a blocking agent to passivate surfaces and minimize non-specific adhesion. | Bovine Serum Albumin (Fraction V) |
| Protease/Phosphatase Inhibitors | Critical cocktail for maintaining integrity of purified proteins during extended imaging. | Commercial cocktails (e.g., from Roche or ThermoFisher) |
| AFM Cantilevers for Liquid | Low spring constant, sharp tips designed for minimal force and high resolution in fluid. | Bruker ScanAsyst-Fluid+, Olympus BL-AC40TS |
This guide is framed within a broader thesis on the application of Atomic Force Microscopy (AFM) for nanoscale surface imaging research in cellular biology. While AFM provides unparalleled, label-free topographical data at nanometer resolution under near-physiological conditions, its full potential is realized when correlated with optical microscopy techniques that visualize specific molecular targets and dynamic processes. This integration bridges the gap between ultrastructural mapping and functional imaging, providing a comprehensive view of cellular architecture and its real-time transformations.
Core Imaging Modalities: Principles and Applications
Atomic Force Microscopy (AFM)
AFM operates by scanning a sharp tip attached to a cantilever across a sample surface. Forces between the tip and the sample cause cantilever deflection, measured via a laser spot, to generate a topographical map.
- Live-Cell AFM: Enables imaging in liquid with minimal sample preparation. Measures mechanical properties (elasticity, adhesion) and real-time processes like membrane remodeling or drug-induced morphological changes.
- Fixed-Cell AFM: Provides high-resolution, static topography of subcellular structures (e.g., cytoskeleton, nuclear pores) without concerns over viability.
Correlative Light and AFM (CL-AFM)
Combines fluorescence microscopy (confocal, TIRF, super-resolution) with AFM. Fluorescence identifies and localizes specific proteins or organelles, which are then probed structurally and mechanically by AFM.
Quantitative Data Comparison
Table 1: Comparative Analysis of Key Imaging Techniques for Cellular Topography
| Technique | Spatial Resolution (XY) | Depth Resolution | Imaging Speed | Live Cell Compatible | Key Measurable Parameters |
|---|---|---|---|---|---|
| AFM (Contact Mode) | 0.5 - 2 nm | 0.1 nm | Slow (min/frame) | Yes | Topography, adhesion force, elasticity (Young's modulus) |
| AFM (PeakForce Tapping) | 1 - 5 nm | 0.1 nm | Moderate | Yes | Topography, nanomechanical mapping (modulus, deformation, adhesion) |
| Confocal Microscopy | 200 - 250 nm | 500 - 700 nm | Fast (ms/frame) | Yes | 3D fluorescence localization, intracellular dynamics |
| STORM/PALM | 20 - 30 nm | 50 nm | Very Slow (min-hr) | Limited (fixed) | Super-resolution molecular localization |
| Expansion Microscopy | ~70 nm (post-expansion) | ~70 nm | N/A (fixed) | No | Super-resolution on standard microscopes via physical expansion |
Table 2: Representative AFM Nanomechanical Data from Cell Studies
| Cell Type | Condition | Apparent Young's Modulus (kPa) | Average Height (µm) | Measurement Technique | Reference Year |
|---|---|---|---|---|---|
| MCF-7 (Breast Cancer) | Control | 1.2 ± 0.3 | 3.5 ± 0.4 | PeakForce QNM | 2022 |
| MCF-7 | Treated (10µM CytD) | 0.6 ± 0.2 | 4.1 ± 0.5 | PeakForce QNM | 2022 |
| Primary Neuron | Soma (Day in vitro 7) | 0.8 ± 0.2 | 5.2 ± 1.1 | Force Spectroscopy | 2023 |
| Red Blood Cell | Healthy | 20 ± 5 | 1.0 ± 0.2 | Force Spectroscopy | 2023 |
| Activated T-Cell | Pre-stimulation | 3.5 ± 1.0 | 6.0 ± 0.8 | JPK CellHesion | 2024 |
Experimental Protocols
Protocol for Correlative Live-Cell Fluorescence and AFM Imaging
Objective: To visualize drug-induced cytoskeletal dynamics and concurrent nanomechanical changes.
Materials: See "The Scientist's Toolkit" below. Method:
- Sample Preparation: Seed cells onto a 35 mm glass-bottom dish. Culture until 60-70% confluent.
- Fluorescent Labeling: Transfer dish to microscope stage. For actin dynamics, add 100 nM SiR-actin live-cell dye to culture medium. Incubate for 1 hour at 37°C, 5% CO₂.
- Initial Fluorescence Imaging: Using a confocal microscope equipped with an environmental chamber (37°C, 5% CO₂), acquire a time-lapse series (e.g., every 30 seconds for 5 minutes) of the actin network in a region of interest (ROI).
- AFM Integration: Carefully replace the confocal objective with the AFM scan head mounted on the correlative microscope. Align the AFM tip with the previously imaged ROI using integrated navigation cameras.
- Live-Cell AFM Measurement: Engage the AFM tip (MLCT-Bio-DC probe, k≈0.1 N/m) in PeakForce Tapping mode in the same culture medium. Set a peak force amplitude < 500 pN to minimize cell disturbance. Acquire a topographical map (e.g., 50x50 µm) and simultaneous quantitative nanomechanical (QNM) data channel (elasticity, adhesion).
- Intervention & Continued Correlation: Pause AFM scan. Add the drug of interest (e.g., 1 µM Latrunculin A) directly to the dish. Resume simultaneous time-lapse fluorescence imaging and AFM QNM mapping at the same location for the desired duration (e.g., 20 minutes).
- Data Correlation: Use software (e.g., JPK SPM, Bruker NanoScope Analysis) to overlay fluorescence timestamps with AFM data streams, aligning spatial coordinates.
Protocol for High-Resolution AFM on Fixed Cytoskeletal Structures
Objective: To achieve nanometer-resolution imaging of the actin cortex. Method:
- Fixation: Rinse cells (on a 15 mm mica disk) with PBS and fix with 4% paraformaldehyde + 0.1% glutaraldehyde in PBS for 10 minutes at room temperature.
- Permeabilization & Staining (Optional for correlation): Permeabilize with 0.1% Triton X-100 for 5 min. Stain with Alexa Fluor 488-phalloidin (1:200) for 20 min. Rinse.
- Critical Point Drying (Optional): For highest resolution in air, dehydrate through an ethanol series (30%, 50%, 70%, 90%, 100%) and use a critical point dryer.
- AFM Imaging in Air/Liquid: Mount the sample. For imaging in liquid, keep hydrated in PBS. Use a high-resolution probe (e.g., OTESPA-R3, k≈26 N/m) in tapping mode. Optimize drive frequency and set a low scan rate (0.5-1 Hz) for high fidelity.
Visualizing Key Pathways and Workflows
Title: Correlative Live-Cell AFM Workflow
Title: Drug-Induced Cytoskeletal & Mechanical Signaling
The Scientist's Toolkit
Table 3: Essential Research Reagent Solutions for Correlative AFM-Cell Studies
| Item | Function & Rationale | Example Product/Type |
|---|---|---|
| Glass-Bottom Culture Dishes | Provide optical clarity for high-resolution fluorescence and a rigid, flat substrate for stable AFM scanning. | MatTek P35G-1.5-14-C, Ibidi µ-Dish 35 mm high |
| Live-Cell Compatible AFM Probes | Silicon nitride tips with low spring constants (~0.01-0.1 N/m) and reflective gold coating. Minimize cell damage. | Bruker MLCT-Bio-DC, Olympus BL-AC40TS |
| Live-Cell Fluorescent Probes | Enable specific labeling of structures (actin, tubulin, membranes) with minimal phototoxicity and high photostability. | SiR-actin/tubulin (Spirochrome), CellMask dyes (Thermo), GFP transfection. |
| Biofunctionalization Kits | For coating AFM tips with ligands (e.g., RGD peptides, antibodies) to measure specific molecular interaction forces. | PEG linkers, silanization kits (e.g., from NPOCS or Sigma). |
| Cell Culture Media for Imaging | Phenol-red free, HEPES-buffered media maintains pH outside a CO₂ incubator during AFM/optical setup. | FluoroBrite DMEM (Thermo), Leibovitz's L-15. |
| High-Resolution AFM Probes (Fixed Cells) | Sharp, stiff probes for high-resolution imaging of fixed samples. | Bruker OTESPA-R3 (k=26 N/m), Olympus OMCL-AC160TS. |
| Correlative Microscopy Alignment Slides | Contain standardized grids (e.g., 500 µm squares) to facilitate precise relocation of cells between microscope and AFM. | Mikromasch NPR-50-GRID, Zeiss Finder Slides. |
| Softwares for Data Correlation | Align and analyze spatial-temporal data from fluorescence and AFM channels. | JPK SPM Data Processing, Bruker NanoScope Analysis, open-source (FIJI/ImageJ with plugins). |
Characterizing nanoparticles (NPs) for drug delivery is a critical step in ensuring their safety, efficacy, and reproducibility. Key physicochemical parameters—size, size distribution, and morphology—directly influence in vivo biodistribution, cellular uptake, drug release kinetics, and toxicity. This technical guide details advanced methodologies for these analyses, framed within a broader thesis on Atomic Force Microscopy (AFM) as a cornerstone technique for nanoscale surface imaging research.
Core Characterization Techniques: Principles and Protocols
Dynamic Light Scattering (DLS) for Hydrodynamic Size and Distribution
Principle: DLS measures temporal fluctuations in scattered laser light from particles undergoing Brownian motion to calculate the hydrodynamic diameter (Dh) via the Stokes-Einstein equation.
Experimental Protocol:
- Sample Preparation: Dilute the NP suspension in an appropriate aqueous buffer (e.g., 1x PBS, pH 7.4) to achieve an optimal scattering intensity. Filter the dispersant (0.1 µm or 0.02 µm filter) to remove dust.
- Instrument Calibration: Calibrate the instrument using a standard latex nanosphere of known size (e.g., 100 nm).
- Measurement: Load the sample into a clean, dust-free cuvette. Equilibrate to the set temperature (typically 25°C) for 2 minutes.
- Data Acquisition: Perform measurements at a backscatter angle (commonly 173°) to minimize multiple scattering. Run a minimum of 10-15 sub-runs per measurement.
- Data Analysis: Use the instrument software to calculate the intensity-weighted size distribution, polydispersity index (PDI), and Z-average diameter. Report the hydrodynamic diameter (Z-avg) and PDI from a minimum of three independent samples.
Atomic Force Microscopy (AFM) for Topography and Morphology
Principle: AFM scans a sharp tip across a sample surface, measuring tip-sample interactions (e.g., van der Waals forces) to construct a three-dimensional topographic map with sub-nanometer resolution.
Experimental Protocol for NP Imaging (Tapping Mode):
- Substrate Preparation: Clean a freshly cleaved mica substrate (approx. 1 cm x 1 cm) with adhesive tape. Treat with (3-aminopropyl)triethoxysilane (APTES) or poly-L-lysine for 2 minutes, rinse with DI water, and dry under nitrogen to promote NP adhesion.
- Sample Deposition: Dilute the NP suspension appropriately (e.g., 1-5 µg/mL). Pipette 20-50 µL onto the treated mica surface. Allow adsorption for 10-15 minutes.
- Rinse and Dry: Gently rinse the mica with 2-3 mL of filtered DI water to remove salts and unbound particles. Dry under a gentle stream of nitrogen.
- Imaging: Mount the sample on the AFM stage. Engage a silicon cantilever (resonant frequency ~300 kHz, spring constant ~40 N/m) in Tapping Mode. Scan areas from 10 µm x 10 µm down to 500 nm x 500 nm at a scan rate of 0.5-1.0 Hz.
- Image Analysis: Use AFM software (e.g., Gwyddion, NanoScope Analysis) for plane fitting, flattening, and particle analysis. Manually or automatically trace individual particles to determine height (morphology) and lateral dimensions.
Electron Microscopy (TEM/SEM) for High-Resolution Morphology
Principle: Transmission Electron Microscopy (TEM) transmits a beam of electrons through an ultra-thin sample, while Scanning Electron Microscopy (SEM) scans a focused electron beam across the surface, detecting emitted secondary electrons to provide high-resolution morphological data.
Experimental Protocol for TEM of Polymeric NPs:
- Grid Preparation: Use a carbon-coated copper grid (200-400 mesh). Glow-discharge the grid for 30-45 seconds to make it hydrophilic.
- Sample Deposition: Dilute the NP suspension to a low concentration. Pipette a 5-10 µL droplet onto the grid. Allow to adsorb for 1-2 minutes.
- Staining (Optional): For polymeric NPs, wick away excess liquid and add a drop of 1-2% uranyl acetate or phosphotungstic acid negative stain for 30 seconds.
- Wicking and Drying: Carefully wick away the stain with filter paper from the grid edge. Air-dry the grid completely.
- Imaging: Insert the grid into the TEM holder. Image at accelerating voltages between 80-120 kV. Capture images at various magnifications.
Quantitative Data Comparison
Table 1: Comparison of Key Nanoparticle Characterization Techniques
| Technique | Measured Parameter(s) | Size Range | Sample State | Key Output Metrics | Advantages | Limitations |
|---|---|---|---|---|---|---|
| Dynamic Light Scattering (DLS) | Hydrodynamic Diameter | ~1 nm - 10 µm | Liquid dispersion | Z-average (nm), PDI, Intensity Distribution | Fast, easy sample prep, measures in native state. | Intensity-weighted; low resolution for polydisperse samples; assumes spheres. |
| Atomic Force Microscopy (AFM) | Topography, Height, Lateral Dimension | ~0.5 nm - 5 µm | Dry or liquid (on substrate) | Height (nm), Diameter (nm), 3D Morphology | Provides 3D topography; measures in liquid/air; no labeling required. | Tip-sample convolution; slow; requires substrate attachment; statistical analysis needed. |
| Transmission Electron Microscopy (TEM) | Core Size, Morphology, Crystallinity | ~0.1 nm - 5 µm | Dry (on grid) | Core Diameter (nm), Shape, Lattice Structure | Highest resolution; direct visualization of shape & structure. | Vacuum required; complex sample prep; potential beam damage; 2D projection only. |
| Scanning Electron Microscopy (SEM) | Surface Morphology, Aggregation | ~10 nm - 1 mm | Dry (on substrate) | Surface Features, Agglomeration State | Great depth of field; good for surface texture. | Requires conductive coating for non-conductive samples; lower resolution than TEM. |
The Scientist's Toolkit: Essential Research Reagents & Materials
Table 2: Key Research Reagent Solutions for Nanoparticle Characterization
| Item | Function/Application | Example & Notes |
|---|---|---|
| Freshly Cleaved Mica Discs | Atomically flat substrate for AFM and TEM sample deposition. | Muscovite Mica, V1 Grade. Provides an ultra-smooth, negatively charged surface for NP adhesion. |
| Poly-L-Lysine Solution | Positively charged adhesion promoter for anchoring NPs to mica/silicon substrates. | 0.1% w/v aqueous solution. Treat substrate for 5 min, rinse. Enhances attachment of anionic NPs. |
| Phosphate Buffered Saline (PBS), 10X | Isotonic buffer for NP dilution and DLS measurement in physiologically relevant conditions. | Filter through 0.02 µm filter before use to eliminate particulate interference in DLS. |
| Uranyl Acetate, 2% Aqueous | Negative stain for TEM to enhance contrast of organic/polymeric nanoparticles. | Caution: Radioactive and toxic. Use with appropriate PPE and disposal protocols. |
| Carbon-Coated Copper TEM Grids | Standard support film for TEM sample preparation. | 200-400 mesh. Glow discharge prior to use to improve hydrophilicity and NP distribution. |
| Size Standard Nanospheres | Calibration and validation of DLS, AFM, and electron microscopy instruments. | e.g., NIST-traceable polystyrene beads (100 nm ± 3 nm). Essential for quality control. |
| Silicon AFM Cantilevers | Probes for Tapping Mode AFM imaging of soft nanomaterials like liposomes and polymers. | Nominal frequency: 300 kHz; spring constant: 40 N/m. Reduces sample damage during imaging. |
Integrated Characterization Workflow
Diagram 1: Integrated Nanoparticle Characterization Workflow (77 chars)
Diagram 2: AFM Sample Preparation Protocol for NPs (73 chars)
A robust characterization strategy for drug delivery nanoparticles requires a synergistic, multi-technique approach. While DLS provides essential hydrodynamic data in the native state, AFM offers unparalleled 3D topographic and mechanical profiling, central to a thesis on nanoscale surface imaging. TEM/SEM delivers definitive morphological verification. Correlating data from these complementary techniques is non-negotiable for establishing structure-function relationships, meeting regulatory standards, and successfully translating nanomedicines from the lab to the clinic.
Atomic Force Microscopy (AFM) has evolved from a premier nanoscale surface imaging tool into a multifunctional platform for quantifying nanomechanical properties. Within a broader thesis on AFM for nanoscale research, force spectroscopy emerges as an indispensable advanced mode. It transitions the instrument from a passive observer of topography to an active interrogator of mechanical forces, binding kinetics, and elastic responses at the single-molecule and single-cell level. This capability provides a critical biophysical dimension to structural imaging, enabling correlative studies that link form with function, essential for researchers in biophysics, mechanobiology, and drug development.
Core Principles & Quantitative Foundations
Force spectroscopy measures the interaction force between the AFM tip and a sample as a function of their separation. The deflection of a calibrated cantilever (Hooke's Law, F = -k·Δx) is recorded versus piezoelectric scanner displacement to generate force-distance (F-D) curves.
Table 1: Key Quantitative Parameters in Force Spectroscopy
| Parameter | Typical Range (Single Molecule) | Typical Range (Single Cell) | Description & Significance |
|---|---|---|---|
| Unbinding Force | 50 - 500 pN | N/A | Force at which a specific ligand-receptor bond ruptures. Reveals binding strength. |
| Adhesion Energy | N/A | 10 - 1000 nJ | Work of separation, integral of the retraction force curve. Measures overall stickiness. |
| Elastic Modulus (Young's Modulus) | N/A | 0.1 - 100 kPa | Stiffness derived from indentation data (e.g., Hertz, Sneddon models). Cell health indicator. |
| Rupture Length | 10 - 100 nm | N/A | Extension at unbinding, related to molecular elasticity and unfolding. |
| Loading Rate | 10 - 10^6 pN/s | 10^3 - 10^7 pN/s | Rate of force application. Critical for dynamic force spectroscopy (DFS). |
| Tether Pulling Force | 50-150 pN | N/A | Force plateau indicating unfolding of modular proteins or extraction of membrane tethers. |
Dynamic force spectroscopy (DFS) analyzes how unbinding force depends on the loading rate, yielding insights into the energy landscape of the interaction (k_off, transition state distance Δx).
Experimental Protocols
Single-Molecule Force Spectroscopy (SMFS) Protocol
Aim: To measure the specific interaction force between a single ligand on the tip and a single receptor on the surface.
Key Reagent Solutions:
- PEG Crosslinker: Heterobifunctional poly(ethylene glycol) (e.g., NHS-PEG-Maleimide) for tethering molecules to the tip/surface, providing mechanical flexibility and reducing non-specific adhesion.
- Functionalized AFM Tips/Canine Cells: Cantilevers with reactive coatings (gold, silicon nitride with -OH, -COOH groups) or pre-coated with specific chemical groups (e.g., NHS, Maleimide).
- Purified Target Proteins: Recombinant proteins or domains with accessible reactive amino acids (e.g., cysteine for maleimide coupling).
- Blocking Agents: Bovine serum albumin (BSA) or casein to passivate unreacted surfaces.
Methodology:
- Tip Functionalization: Cantilever is cleaned (UV/Ozone, plasma), aminofunctionalized with APTES. A heterobifunctional PEG spacer is covalently attached via its NHS ester end to the amine groups. The ligand molecule is then coupled to the free (e.g., maleimide) end of the PEG tether.
- Substrate Preparation: A clean gold or mica substrate is similarly functionalized with the receptor protein via PEG crosslinkers.
- Measurement: Conducted in relevant physiological buffer (e.g., PBS). Thousands of F-D curves are acquired at different positions. Specific binding is confirmed via block/control experiments (soluble ligand, mutated receptor).
- Data Analysis: Curves showing specific interactions are selected. Rupture forces and lengths are pooled into histograms. DFS is performed by varying the retraction speed.
Single-Cell Mechanical Testing Protocol
Aim: To map the local elastic modulus and adhesion properties of a living cell.
Key Reagent Solutions:
- Colloidal Probe Tips: Micron-sized silica or polystyrene beads attached to tipless cantilevers, enabling well-defined geometry for contact mechanics models and reducing local damage.
- Cell Culture Media: Appropriate, buffered media (e.g., DMEM + HEPES) to maintain cell viability during measurement.
- Cell Adhesion Substrata: Petri dishes or glass-bottom dishes coated with extracellular matrix proteins (e.g., fibronectin, collagen) to promote cell spreading.
- Cytoskeletal Modulators: Drugs such as Latrunculin A (actin disruptor) or Nocodazole (microtubule disruptor) for perturbation studies.
Methodology:
- Cell Preparation: Cells are seeded sparsely on the coated substrate and allowed to adhere and spread for a defined period (e.g., 12-24 hours).
- Cantilever Calibration: The spring constant (k) of the bead-functionalized cantilever is calibrated (thermal tune, Sader method). Bead diameter is precisely measured.
- Force Volume Mapping: The scanner performs a raster scan, acquiring a full F-D curve at each pixel (e.g., 32x32 or 64x64 grid over a 20x20 μm area). Approach and retraction speeds are kept low (~1-5 μm/s) to minimize viscous effects.
- Data Analysis: The approach curve's indentation segment is fit with the Hertz or Sneddon model (for a spherical indenter) to extract the local Young's Modulus (E). Adhesion force and energy are extracted from retraction curves.
Visualization of Workflows & Concepts
Diagram 1: SMFS Experimental Workflow
Diagram 2: Dynamic Force Spectroscopy Energy Landscape
Diagram 3: Cellular Mechanotransduction Pathway Simplified
The Scientist's Toolkit: Essential Research Reagents & Materials
Table 2: Key Research Reagent Solutions for Force Spectroscopy
| Item | Function & Rationale |
|---|---|
| Biolever Tips (BL-TR400PB) | Silicon nitride cantilevers with ultra-low spring constants (~0.02-0.1 N/m), optimized for SMFS in liquid to detect pN forces. |
| PEG-based Crosslinkers (e.g., NHS-PEG-Maleimide, 24-36 units) | Flexible, inert spacers that isolate the single-molecule interaction from non-specific tip-surface adhesion, crucial for clean SMFS data. |
| Functionalization Kits (e.g., Bio-FT Kit, SMB-FS Kit) | Commercial kits providing standardized protocols and reagents (SAMs, linkers) for reliable tip and substrate functionalization. |
| Polystyrene/Silica Microspheres (2-10 μm diameter) | Used to create colloidal probes for single-cell mechanics, providing a defined, reproducible spherical indenter for elastic modulus calculation. |
| Live-Cell Imaging Media (no phenol red, + HEPES) | Maintains pH and osmolality outside a CO2 incubator during prolonged AFM experiments, ensuring cell viability. |
| Cytoskeleton Modulators (Latrunculin A, Jasplakinolide, Nocodazole) | Pharmacological tools to disrupt or stabilize actin/microtubule networks, used to validate the mechanical role of the cytoskeleton. |
| Recombinant Proteins with Engineered Tags (e.g., AviTag, HaloTag) | Allows for site-specific, oriented immobilization on streptavidin- or HaloLink-coated surfaces, improving binding efficiency in SMFS. |
| Calibration Gratings (TGZ & HS-TG Series) | Reference samples with precise pitch and height for lateral and vertical calibration of the piezoelectric scanner, ensuring accurate distance measurement. |
Applications in Drug Development & Mechanobiology
Force spectroscopy provides direct, quantitative metrics for drug discovery. In single-molecule studies, it can measure the effect of therapeutic candidates (small molecules, antibodies) on the strength and kinetics of pathogenic protein-protein interactions (e.g., SARS-CoV-2 Spike-ACE2). At the single-cell level, it serves as a phenotypic readout for drug efficacy. For instance, chemotherapeutic agents often alter cell stiffness; AFM can track these changes in real time. Furthermore, the technique is pivotal in understanding mechanopharmacology, where drugs are designed to target cellular mechanical properties or how mechanical changes influence drug uptake and sensitivity.
Advanced force spectroscopy modes transform the AFM from a surface imaging microscope into a quantitative nanomechanical probe. By providing precise measurements of unbinding forces, kinetic parameters, and viscoelastic properties, it adds a crucial functional layer to nanoscale structural research. As protocols become more standardized and throughput increases, its integration into correlative imaging-studies and its application in screening for drug discovery and diagnostics are poised to expand significantly, offering researchers a direct physical window into the mechanics of life at its most fundamental level.
PeakForce Tapping and Quantitative Nanomechanical Mapping (QNM) for Material Properties
Atomic Force Microscopy (AFM) has evolved from topographical imaging into a comprehensive platform for quantifying nanoscale material properties. Within the broader thesis of AFM for advanced surface characterization, PeakForce Tapping (PFT) and the Quantitative Nanomechanical Mapping (QNM) modality represent a paradigm shift. They enable the simultaneous, high-resolution, and quantitative mapping of mechanical properties—such as modulus, adhesion, deformation, and dissipation—alongside topography, with minimal sample damage. This is critical for researchers in advanced materials science, polymers, biological systems, and pharmaceutical development, where heterogeneous nanostructures dictate macroscopic function.
Technical Principles
PeakForce Tapping: Unlike traditional tapping-mode AFM, PFT operates at sub-nanometer amplitudes (≈100 pm) and low frequencies (≈0.25-2 kHz). The probe taps the surface at a frequency well below its resonance, allowing direct control of the maximum force (the "Peak Force") applied on each cycle. This precise force control minimizes lateral forces and sample deformation, enabling gentle imaging of soft samples.
Quantitative Nanomechanical Mapping (QNM): QNM is an operational mode built upon PFT. During each tap, the full force-distance curve is captured. This curve is then analyzed in real-time using a constitutive model (typically the Derjaguin–Muller–Toporov (DMT) or Oliver–Pharr model for elastic modulus) to extract quantitative mechanical properties at every pixel.
Key Experimental Protocols
Protocol 1: Standard QNM Imaging of a Polymer Blend
- Probe Selection: Use a silicon probe with a known spring constant (k, typically 0.4-200 N/m) and a sharp, well-defined tip radius (R). Pre-calibrated probes with reflective aluminum coating on the back are standard.
- Calibration:
- Spring Constant: Perform thermal tune calibration in air.
- Deflection Sensitivity: Obtain from a force curve on a rigid, non-deformable sample (e.g., clean silicon wafer).
- Tip Radius: Determine using a characterized reference sample (e.g., polystyrene with known modulus, or a tip characterizer with sharp spikes).
- Sample Preparation: Mount the polymer blend sample securely on a magnetic stainless steel disc. Ensure the surface is clean and free of loose debris. For soft polymers, mounting with a double-sided adhesive is sufficient.
- Instrument Setup: Engage in PeakForce Tapping mode. Set the
PeakForce Setpointto a low value (e.g., 50-500 pA, corresponding to nanoNewtons) to prevent sample damage. Adjust thePeakForce FrequencyandScan Ratefor optimal tracking (typically 0.5-1 Hz line rate). - QNM Parameter Selection: Select the DMT model for modulus calculation. Input the calibrated probe parameters (k, R). Set the Poisson's ratio (ν) for the sample (an estimated value, e.g., 0.5 for polymers).
- Imaging: Scan the area of interest. The system simultaneously generates Topography, DMT Modulus, Adhesion, Deformation, and Dissipation maps.
Protocol 2: QNM of Living Cells in Liquid
- Probe Selection: Use a silicon nitride probe with a low spring constant (k ≈ 0.06 N/m) and a colloidal tip or a very sharp tip for higher resolution.
- Calibration: Perform spring constant calibration in liquid using the thermal method. Deflection sensitivity is calibrated on a rigid part of the substrate (e.g., glass coverslip) in the same liquid medium.
- Sample Preparation: Culture cells on a glass-bottom Petri dish. Perform experiments in appropriate physiological buffer at 37°C using a temperature-controlled stage.
- Instrument Setup: Engage in fluid cell. Use a lower
PeakForce Setpoint(100-300 pA) and a reducedPeakForce Frequency(≈0.25 kHz). Utilize the "ScanAsyst" feature for automatic optimization of imaging parameters. - Imaging: Focus on a relatively flat region of the cell (e.g., lamellipodia or nucleus). Collect maps of modulus and adhesion to visualize cytoskeletal structures and membrane properties.
Data Presentation: Quantitative Property Ranges
Table 1: Typical QNM Property Ranges for Common Materials
| Material Class | Example | Approx. DMT Modulus (E) | Adhesion Force | Deformation | Key Application |
|---|---|---|---|---|---|
| Polymers | Polydimethylsiloxane (PDMS) | 1 - 5 MPa | 0.1 - 1 nN | 5 - 20 nm | Soft lithography, microfluidics |
| Polystyrene (PS) | 2 - 4 GPa | 1 - 5 nN | 0.5 - 2 nm | Polymer blends, reference sample | |
| Low-Density Polyethylene (LDPE) | 100 - 300 MPa | 2 - 10 nN | 2 - 10 nm | Film homogeneity studies | |
| Biological | Mammalian Cell (Cytoplasm) | 1 - 100 kPa | 50 - 500 pN | 10 - 200 nm | Cell mechanics, drug response |
| Collagen Fibril | 1 - 5 GPa | 0.5 - 2 nN | 0.5 - 3 nm | Tissue engineering | |
| Pharmaceutical | Amorphous API Particle | 1 - 10 GPa | 5 - 20 nN | 1 - 5 nm | Polymorph stability |
| Tablet Coating (Polymer) | 1 - 20 GPa | 1 - 10 nN | 0.1 - 2 nm | Coating uniformity & defects |
Table 2: Key Parameters for QNM Probe Calibration
| Parameter | Symbol | Typical Range/Value | Determination Method | Impact on Quantification |
|---|---|---|---|---|
| Cantilever Spring Constant | k | 0.06 - 200 N/m | Thermal Tune, Sader Method | Directly scales measured force. |
| Deflection Sensitivity | InvOLS | 10 - 100 nm/V | Force curve on rigid sample | Converts voltage to tip displacement. |
| Tip Radius | R | 2 - 70 nm | Image/Characterize reference sample | Critical for modulus (E ∝ 1/R¹/²). |
| Poisson's Ratio | ν | 0.3 - 0.5 (assumed) | Literature value for material | Minor influence on modulus calculation. |
Visualization: Experimental Workflow
Title: QNM Experimental Workflow from Setup to Results
The Scientist's Toolkit: Key Research Reagent Solutions
Table 3: Essential Materials for QNM Experiments
| Item | Function & Description | Key Considerations for Research |
|---|---|---|
| AFM System with PFT/QNM | Core instrument capable of PeakForce Tapping and real-time force curve analysis. | Must have a dedicated QNM license, low-noise electronics, and precise Z-control. |
| Calibrated AFM Probes (e.g., RTESPA, SNL, ScanAsyst-Fluid+) | Silicon or silicon nitride cantilevers with known spring constant and sharp tip. | Pre-calibrated "PFQNM" probes simplify workflow. Colloidal probes for single-point tests. |
| Reference Samples (e.g., PS/LDPE, Gratings) | Samples with known modulus or sharp features for tip characterization and validation. | Essential for verifying the quantitative accuracy of modulus maps and tip shape. |
| Rigid Substrate (Cleaned Silicon Wafer, Mica) | Provides an atomically flat, non-deformable surface for sensitivity calibration. | Critical first step in any QNM experiment to convert detector signal to deflection. |
| Sample Mounting Supplies (Double-Sided Tape, Magnetic Discs) | Securely affix the sample to the AFM stage without introducing vibration or drift. | Use minimal, thin tape to avoid compliance. For liquids, use glass-bottom dishes. |
| Advanced Analysis Software (e.g., NanoScope Analysis) | Software for processing raw QNM data, statistical analysis, and generating histograms. | Enables extraction of average properties from specific regions of interest (ROIs). |
Solving Common AFM Challenges: Artifacts, Tips, and Sample Preparation
Identifying and Minimizing Common Imaging Artifacts (Tip Convolution, Scanner Creep, Vibration)
Atomic Force Microscopy (AFM) is a cornerstone technique for nanoscale surface imaging in materials science and biological research, enabling three-dimensional topography with sub-nanometer resolution. Its efficacy in drug development, particularly for characterizing nanocarriers, biologics, and biomolecular interactions, hinges on data fidelity. This guide addresses three pervasive artifacts—tip convolution, scanner creep, and vibration—framed within the thesis that systematic artifact mitigation is prerequisite for deriving quantitatively reliable nanostructural data, thereby enabling robust structure-function correlations in research.
Tip Convolution Artifact
Technical Analysis
Tip convolution arises from the finite dimensions of the probe tip, causing the acquired image to represent a dilation of the true surface topography by the tip geometry. This effect distorts feature widths, steepens sidewalls, and obscures narrow crevices.
Table 1: Measured Impact of Tip Convolution on Feature Dimensions
| True Feature Size (nm) | Tip Radius (nm) | Apparent Width (nm) | Error (%) | Reference |
|---|---|---|---|---|
| 20 | 10 | 40 | 100 | [1] |
| 5 | 2 | 9 | 80 | [2] |
| 100 (pitch) | 20 | 120 | 20 | [3] |
| 10 (depth) | 8 | 5.2 | -48 | [4] |
Experimental Protocol for Characterization and Minimization
Protocol 1: Tip Characterization Using Reference Nanostructures
- Materials: TGT1 or TGZ1 calibration grating (NT-MDT) with known, sharp pyramidal pits or spikes.
- Imaging: Acquire a high-resolution image (512x512 pixels) of the grating in tapping mode.
- Analysis: Invert the image. The resulting profile of a sharp spike represents the tip's effective shape. Use dedicated deconvolution software (e.g., Gwyddion's "Tip Shape" module) to reconstruct the tip profile.
- Mitigation: Employ this profile for subsequent image deconvolution or select a new tip if the radius exceeds 1/5th of the smallest feature of interest.
Protocol 2: Operational Minimization Strategies
- Use high-aspect-ratio tips (e.g., carbon nanotube tips, Hi'Res-C probes) for high, narrow features.
- Operate in tapping mode to reduce lateral forces compared to contact mode.
- Apply image deconvolution algorithms post-acquisition, using the characterized tip shape as the kernel.
Scanner Creep Artifact
Technical Analysis
Creep is a time-dependent, non-linear motion of the piezoelectric scanner following a voltage change, causing image distortion in the slow-scan axis. It is caused by hysteresis and relaxation within the piezoelectric material, leading to stretched or compressed image regions.
Table 2: Scanner Creep Distortion Metrics Under Various Conditions
| Scan Size (µm) | Wait Time After Large Step | Creep-Induced Distortion (nm) | Duration (min) | Scanner Type |
|---|---|---|---|---|
| 10 | 0 s | 250 | 2 | Tube Scanner |
| 10 | 2 s | 80 | 1 | Tube Scanner |
| 50 | 0 s | 1200 | 5 | Flexure Scanner |
| 50 | 5 s | 150 | 2 | Flexure Scanner |
Experimental Protocol for Characterization and Minimization
Protocol 3: Creep Quantification via Step Response Test
- Setup: Engage the tip on a flat, stable surface (e.g., mica).
- Procedure: Command a large step displacement (e.g., 5 µm) in the Z or X/Y axis. Record the scanner position via the internal sensor (if available) or track the cantilever deflection (for Z) over 60 seconds.
- Analysis: Fit the logarithmic time-dependent motion: d(t) = d₀ + α log(1 + t/τ), where α is the creep amplitude.
- Mitigation:
- Implement a settling delay (2-5 seconds) after each large step or at the start of each scan line.
- Use closed-loop scanner systems with integrated position sensors for real-time correction.
- Apply feedforward creep compensation models in the scanner controller software, using parameters derived from the step test.
Scanner Creep Cause and Mitigation Pathway
Vibration Artifact
Technical Analysis
Environmental and instrumental vibrations cause periodic noise in images, manifesting as ripples or streaks perpendicular to the fast-scan direction. Low-frequency vibrations (<1 kHz) are most detrimental, often coupling directly into the AFM head.
Table 3: Vibration Amplitude and its Impact on Image Noise
| Vibration Source | Frequency Range | Typical Amplitude (nm) | Resultant Image Noise (nm RMS) | Mitigation Used |
|---|---|---|---|---|
| Building Floor | 5-30 Hz | 100-1000 | 5-50 | Passive Isolation Table |
| Acoustic Noise | 50-500 Hz | 10-100 | 1-10 | Acoustic Enclosure |
| Equipment (Pumps, HVAC) | 10-150 Hz | 50-500 | 3-30 | Active Vibration Cancellation |
| Internal Scanner Resonance | 1-50 kHz | 0.1-2 | 0.1-1 | Notch Filtering |
Experimental Protocol for Characterization and Minimization
Protocol 4: System Vibration Fingerprinting
- Setup: Retract the tip from the surface.
- Procedure: Record the Z-axis cantilever deflection signal (or the Z sensor signal) for 60 seconds at the highest practical sampling rate.
- Analysis: Perform a Fast Fourier Transform (FFT) on the time-domain data to generate a vibration power spectral density (PSD) plot. Identify peak frequencies corresponding to environmental and instrumental noise.
- Mitigation:
- For peaks < 100 Hz: Enhance passive isolation (e.g., air tables) or employ active cancellation systems.
- For scanner resonances: Apply notch filters in the controller software at the identified frequencies.
- Universal: Use a vibration-damping acoustic enclosure, relocate the AFM to a ground-floor basement lab, and decouple from building HVAC.
Vibration Artifact Generation and Detection Workflow
The Scientist's Toolkit: Research Reagent Solutions
Table 4: Essential Materials for AFM Artifact Mitigation Experiments
| Item | Function/Application | Example Product/Supplier |
|---|---|---|
| Calibration Gratings | Characterize tip shape and scanner calibration via known nanostructures. | TGZ, TGT series (NT-MDT) |
| High-Aspect-Ratio AFM Probes | Minimize tip convolution for imaging deep, narrow features. | Hi'Res-C, AR5-NCHR (Bruker) |
| Carbon Nanotube Tips | Ultimate sharpness and high aspect ratio for minimal convolution (specialized research). | SIS-CNT (NaugaNeedles) |
| Vibration Isolation Table | Passively damp low-frequency building vibrations. | TS-150 (Melles Griot / Newport) |
| Active Vibration Cancellation | Actively counteract residual vibrations in real-time. | MOD-1, MOD-2 (Herzan / Accurion) |
| Acoustic Enclosure | Attenuate airborne noise that couples into the AFM cantilever. | Custom or OEM (Bruker, Park) |
| Atomic Flat Substrate | Provide a reference surface for vibration and creep tests. | Freshly Cleaved Mica (Ted Pella) |
| Deconvolution Software | Algorithmically reduce tip convolution artifacts from acquired images. | Gwyddion, SPIP (Image Metrology) |
Integrated Workflow for Artifact Minimization
Integrated Pre-Imaging Protocol for Artifact Control
Within the thesis of employing AFM for quantitative nanoscale research, systematic identification and minimization of tip convolution, scanner creep, and vibration are not optional post-processing steps but fundamental components of experimental design. By implementing the characterization protocols and mitigation strategies outlined, researchers can significantly enhance the accuracy and reproducibility of nanostructural data. This rigor is paramount for advancing research in nanomaterial characterization and drug development, where nanometric details dictate functional outcomes.
Within the broader thesis on Atomic Force Microscopy (AFM) for nanoscale surface imaging research, the selection of an appropriate cantilever and probe is a critical determinant of experimental success, especially for biological samples. Bio-samples, ranging from live cells to immobilized proteins, present unique challenges: they are soft, often submerged in liquid, and susceptible to damage. This guide provides an in-depth technical framework for selecting cantilevers based on three interdependent parameters—stiffness, resonance frequency, and coating—to optimize imaging, force spectroscopy, and molecular interaction studies in biological AFM.
Core Principles and Parameter Interdependence
The mechanical properties of a cantilever define its interaction with a sample. For bio-applications, the key is to balance sensitivity with minimal invasive force.
- Stiffness (k): Dictates the force applied to the sample. A lower stiffness (0.01 - 1 N/m) provides higher force sensitivity for imaging soft samples without deformation. Higher stiffness (≥ 10 N/m) is used for indentation or scratching experiments.
- Resonance Frequency (f₀): Determines imaging speed and stability. A higher f₀ enables faster scanning and reduces sensitivity to environmental noise. In liquid, f₀ drops significantly (typically by 2-4x) due to added mass and damping.
- Coating: Defines the optical reflectivity (for laser detection) and chemical functionality of the probe tip. A reflective coating (e.g., gold, aluminum) is essential. Functional coatings (e.g., silicon nitride, diamond-like carbon) provide biocompatibility, chemical inertness, or specific chemical properties.
The optimal choice is a function of the operational mode (e.g., Contact Mode, Tapping Mode, Force Spectroscopy) and the specific sample properties.
Quantitative Parameter Selection Guide
Table 1: Cantilever Selection Matrix for Common Bio-Applications
| Application | Recommended Mode | Stiffness (k) Range | Resonance Freq. (f₀) in Air | Key Coating/Tip Material | Rationale |
|---|---|---|---|---|---|
| High-Res. Topography of Live Cells | Tapping Mode (in fluid) | 0.01 - 0.1 N/m | 10 - 70 kHz | Silicon Nitride (Si₃N₄) | Very low force prevents cell damage; Si₃N₄ is hydrophilic and biocompatible. |
| Protein Imaging & Single Molecules | Tapping Mode or PeakForce Tapping | 0.1 - 0.6 N/m | 20 - 90 kHz | Silicon, DLC-coated Silicon | Balanced stiffness for stability and gentle touch; sharp, robust tip for molecular resolution. |
| Force Spectroscopy (Adhesion, Elasticity) | Force-Volume or Single Curve | 0.01 - 0.06 N/m | 5 - 20 kHz | Silicon Nitride, Gold-coated | Ultra-low stiffness maximizes deflection sensitivity for pN force measurement. |
| Indentation Modulus Mapping | Force-Volume or PeakForce QNM | 0.1 - 1 N/m | 15 - 75 kHz | Silicon, Boron-doped Diamond | Stiffer lever for controlled indentation; diamond tips resist wear on stiff matrices. |
| Fast Scanning & Dynamic Processes | High-Speed Tapping Mode | 0.1 - 0.5 N/m | 70 - 350 kHz (in air) | Silicon, Aluminum coating | High f₀ enables high scan rates to capture biological dynamics. |
| Ligand-Receptor Binding Studies | Functionalized Tip Force Spectroscopy | 0.01 - 0.03 N/m | 5 - 15 kHz | Gold-coated with PEG linker | Low k for sensitivity; gold allows thiol-based chemistry for biomolecule tethering. |
Table 2: Impact of Liquid Immersion on Cantilever Dynamics
| Parameter | In Air | In Fluid (Typical Change) | Implication for Bio-Experiments |
|---|---|---|---|
| Resonance Frequency (f₀) | f₀_air | Decreases by 60-80% | Slower response; requires tuning of feedback gains. |
| Quality Factor (Q) | 100 - 500 | Drops to ~1-10 | Damping reduces oscillation sharpness, lowering thermal noise but requiring higher drive amplitudes. |
| Thermal Noise | Lower | Increases significantly (∝√(k_BT/Q)) | Limits force resolution in fluid; necessitates very soft levers for pN detection. |
Experimental Protocols
Protocol 1: Calibrating Cantilever Stiffness and Sensitivity for Bio-AFM
Objective: Accurately determine the inverse optical lever sensitivity (InvOLS in nm/V) and spring constant (k in N/m) of a soft cantilever in fluid. Materials: AFM with fluid cell, soft cantilever (k ~0.01-0.1 N/m), calibration sample (e.g., rigid glass or sapphire), analysis software.
- Mounting: Mount the cantilever and align the laser in air. Introduce fluid (buffer/PBS) to the cell.
- Thermal Tune: With the probe disengaged, acquire a thermal noise spectrum in fluid. Fit the peak to obtain the resonance frequency in fluid (f₀fluid) and quality factor (Qfluid).
- Sensitivity Measurement: Engage on a rigid, clean region of the calibration sample in fluid. Acquire a force-distance curve. On the repulsive (contact) slope, fit a linear region to obtain the deflection sensitivity (S in V/nm). InvOLS = 1/S.
- Spring Constant Calculation (Thermal Method): From the thermal spectrum, apply the equipartition theorem method or Sader method (adjusted for fluid density/viscosity) using the measured InvOLS, f₀fluid, and Qfluid to calculate k.
- Validation: Perform a simple indentation on a known PDMS sample to verify calculated k.
Protocol 2: Functionalizing Tips for Specific Binding Force Spectroscopy
Objective: Covalently attach biomolecules (e.g., ligands) to the AFM tip via a flexible PEG crosslinker. Materials: Gold-coated cantilevers, ethanol, 2 mM solution of thiol-PEG-NHS linker, 50-200 µg/mL protein/ligand solution in coupling buffer (e.g., PBS, pH 7.4), 1 M ethanolamine hydrochloride (pH 8.5).
- Cleaning: Plasma clean gold-coated tips for 2-5 minutes.
- Linker Attachment: Immediately immerse tips in the thiol-PEG-NHS solution for 1-2 hours. Thiol groups bind to gold, forming a self-assembled monolayer.
- Rinsing: Rinse thoroughly in ethanol and pure water to remove unbound linker.
- Ligand Coupling: Incubate tips in the ligand solution for 30-60 minutes. The NHS ester end of the PEG reacts with primary amines (e.g., lysine residues) on the ligand.
- Quenching: Transfer tips to ethanolamine solution for 10 minutes to deactivate and block any remaining NHS esters.
- Final Rinse & Storage: Rinse with coupling buffer and store in the same buffer at 4°C until use. Use within 24 hours for best results.
Visualization Diagrams
Diagram Title: Decision Workflow for Bio-AFM Cantilever Selection
Diagram Title: Interdependence of Key Cantilever Parameters
The Scientist's Toolkit: Research Reagent Solutions
Table 3: Essential Materials for Bio-AFM Cantilever Experiments
| Item | Function & Rationale | Example Product/Chemical |
|---|---|---|
| Soft Silicon Nitride Cantilevers | For imaging live cells & force spectroscopy. Biocompatible, hydrophilic, very low spring constants. | Bruker MLCT-Bio-DC (k=0.03 N/m) |
| Sharp Silicon Probes | For high-resolution topography of proteins & DNA. High resonance frequency, very sharp tips. | Olympus AC40TS (k=0.1 N/m, f₀~70 kHz) |
| Gold-Coated Cantilevers | For tip functionalization. Au surface enables thiol-based chemistry for attaching biomolecules. | Bruker SNL-Au (k=0.06 N/m) |
| Thiol-PEG-NHS Crosslinker | Flexible tether for ligand-receptor studies. Spacer separates tip and ligand, allowing natural binding. | "HS-(CH₂)₁₁-EG₆-NHS" (e.g., from Nanoscience) |
| Piranha Solution (Caution!) | For aggressive cleaning of silicon/silicon nitride tips. Removes organic contaminants. | 3:1 H₂SO₄ : H₂O₂ Handle with extreme care |
| Ethanolamine Hydrochloride | Quenching agent. Blocks unreacted NHS esters after ligand coupling to prevent non-specific binding. | 1 M Solution, pH 8.5 |
| Calibration Gratings | For verifying tip shape & scanner calibration. Essential for quantitative measurements. | TGXYZ Series (e.g., 10µm pitch, 180nm step) |
| Colloidal Probe Kits | For single-cell force spectroscopy. Attaches a microsphere to a tipless cantilever for defined contact. | 2-10 µm diameter silica or polystyrene beads |
Atomic Force Microscopy (AFM) is a cornerstone of nanoscale surface imaging, providing three-dimensional topographic data critical for research in material science, biology, and drug development. The overarching thesis of this work posits that the fidelity and quantitative accuracy of AFM data are not inherent to the instrument but are directly dictated by the precise optimization of dynamic scanning parameters. This guide details the systematic approach to tuning the setpoint, scan rate, and feedback controller gains to achieve stable, high-resolution imaging, which is fundamental to advancing nanoscale surface characterization in scientific and pharmaceutical research.
Fundamental Parameter Definitions and Interdependence
Setpoint: The target value for the feedback loop (e.g., cantilever deflection or amplitude in contact or tapping mode, respectively). It defines the tip-sample interaction force. A lower setpoint typically increases force, improving tracking but risking sample damage or instability.
Scan Rate: The speed at which the probe raster-scans the sample surface, inversely related to pixel dwell time. Excessive rates cause tip lag and artifacts; insufficient rates promote thermal drift and are time-inefficient.
Feedback Gains (Proportional, ( Kp ), and Integral, ( Ki )): Control parameters that determine how aggressively the system responds to error (difference between setpoint and measured signal). They are critical for system stability and image accuracy.
These parameters are intrinsically linked. The optimal scan rate is contingent upon a properly chosen setpoint and finely tuned gains. The following diagram illustrates their logical relationship and optimization workflow.
Diagram Title: AFM Parameter Optimization Logic Flow
Quantitative Guidelines and Experimental Protocols
Setpoint Selection Protocol
Objective: To find the maximum setpoint that maintains consistent tip-sample interaction without loss of contact or excessive force.
Methodology:
- Engage the probe in the desired mode (e.g., Tapping Mode).
- On a feature of interest, perform a force curve to determine the point of contact and the free-air amplitude.
- Begin imaging with a setpoint ratio (Setpoint Amplitude / Free Air Amplitude) of ~0.8.
- Decrement the setpoint ratio in steps of 0.05 while monitoring the trace-retrace error and phase image contrast.
- The optimal setpoint is the highest value (lowest force) before a significant increase in trace-retrace error or loss of feature contrast occurs.
Table 1: Typical Setpoint Ratios for Various Sample Types
| Sample Type | Recommended Setpoint Ratio (Tapping Mode) | Rationale |
|---|---|---|
| Hard, Inert Material (e.g., Mica, Silicon) | 0.6 - 0.7 | Allows lower force for minimal wear while maintaining stability. |
| Soft Polymer Film | 0.8 - 0.9 | Very low force required to prevent deformation. |
| Biological Sample (e.g., Membrane Protein) | 0.85 - 0.95 | Extremely low force is critical to preserve structure. |
| Conductive Sample (for EFM/KPFM) | 0.7 - 0.8 | Balances topography tracking with electrical signal needs. |
Feedback Gain Tuning Protocol
Objective: To achieve a critically damped system response that minimizes topographic error without introducing oscillation.
Methodology (Ziegler-Nichols inspired approach):
- Set scan rate very low (e.g., 0.5 Hz) and find a medium setpoint.
- Set Integral Gain ((K_i)) to zero.
- Increase Proportional Gain ((Kp)) from zero until the system begins to oscillate (observed as high-frequency noise in the error signal or topography). Note this value as (Ku).
- Set (Kp) to (0.5 \times Ku).
- Gradually increase (K_i) until any residual low-frequency error is corrected without creating slow oscillations.
- Fine-tune both gains while scanning a known sharp feature (e.g., a step edge) to eliminate overshoot or rounding.
Table 2: Effects of Improper Gain Settings
| Parameter | Too Low | Too High |
|---|---|---|
| Proportional Gain ((K_p)) | Slow response, tip loses contact on steep slopes, image appears "smeared". | High-frequency oscillation, "ringing" on edges, noisy image. |
| Integral Gain ((K_i)) | Persistent offset error, linescan shows sustained error after a step. | Low-frequency oscillation, "waviness" or "drift" across image. |
Scan Rate Optimization Protocol
Objective: To determine the maximum scan rate that does not introduce artifacts from the system's finite response time.
Methodology:
- With setpoint and gains optimized at a very slow rate (e.g., 0.2 Hz), image a sample with sharp, nanoscale features.
- Incrementally increase the scan rate (e.g., 0.5 Hz, 1.0 Hz, 2.0 Hz...).
- At each rate, capture trace and retrace images simultaneously.
- Calculate the root mean square (RMS) error between trace and retrace lines for each rate.
- Plot Scan Rate vs. RMS Error. The maximum usable rate is at the knee of the curve, before error increases sharply.
- Validate by checking for feature broadening or asymmetry in the fast-scan direction.
Table 3: Maximum Practical Scan Rates by Mode
| AFM Mode | Typical Max Rate (for 512px, 1µm scan) | Limiting Factor |
|---|---|---|
| Contact Mode | 5-10 Hz | Friction, shear forces, and lateral deflection. |
| Tapping Mode (Air) | 2-3 Hz | Cantilever mechanical response time (~Q-factor). |
| Tapping Mode (Liquid) | 0.5-1.5 Hz | Highly damped cantilever response and fluid dynamics. |
| High-Speed AFM | 10-50 Hz+ | Specialized cantilevers and electronics. |
The Scientist's Toolkit: Essential Research Reagents & Materials
Table 4: Key Research Reagent Solutions for AFM Sample Preparation
| Item | Function & Brief Explanation |
|---|---|
| Freshly Cleaved Mica (V1 Grade) | An atomically flat, negatively charged substrate for adsorbing proteins, nucleic acids, and lipids. Provides a clean baseline for height measurement. |
| APTES ((3-Aminopropyl)triethoxysilane) | A silane coupling agent used to functionalize silicon or glass substrates with amine groups for covalent attachment of biomolecules. |
| PBS (Phosphate Buffered Saline), 1x, pH 7.4 | A standard physiological buffer for maintaining biological samples (e.g., proteins, cells) in a hydrated, native state during imaging in liquid. |
| Glutaraldehyde (2.5% in buffer) | A crosslinking fixative used to stabilize soft biological structures (e.g., cytoskeletons) by creating covalent bonds, reducing deformation under the tip. |
| Polystyrene Beads (e.g., 100nm diameter) | Used as a calibration standard for verifying the scanner's lateral and vertical dimensional accuracy and for tip characterization. |
| Piranha Solution (H₂SO₄:H₂O₂ 3:1) | CAUTION: Highly corrosive. Used to rigorously clean silicon/silicon nitride probes and substrates, removing organic contaminants for consistent surface chemistry. |
| HLB 1.0 Gold Nanoparticles (e.g., 10nm) | Used for tip functionalization in chemical force microscopy or as precise height standards for soft samples. |
Integrated Workflow for Parameter Optimization
The following diagram encapsulates the sequential experimental workflow, integrating the protocols for setpoint, gains, and scan rate into a cohesive procedure.
Diagram Title: Integrated AFM Parameter Optimization Workflow
Stable, high-resolution AFM imaging is a deliberate achievement of parameter optimization, not a default instrument setting. By systematically selecting the setpoint to minimize force, tuning the feedback gains for a critically damped response, and determining the maximum stable scan rate, researchers can extract reliable, quantitative nanoscale data. This rigorous approach, framed within the broader thesis of AFM methodology development, is essential for advancing surface science, biophysics, and the characterization of next-generation therapeutic nanomaterials. The provided protocols, quantitative tables, and integrated workflow serve as a foundational guide for reproducible excellence in nanoscale imaging.
This technical guide details essential protocols for preparing soft biological samples for Atomic Force Microscopy (AFM) nanoscale imaging. Within the broader thesis on AFM for surface imaging research, consistent and artifact-free sample preparation is the critical first step, dictating the success of high-resolution topographical and mechanical property mapping. For researchers and drug development professionals, mastering these techniques for delicate samples like live cells, lipid bilayers, proteins, and nucleic acids is paramount to obtaining physiologically relevant data.
Adsorption Protocols
Adsorption relies on non-covalent interactions (electrostatic, hydrophobic, van der Waals) to immobilize samples onto a substrate.
Key Factors Influencing Adsorption
- Substrate Properties: Surface charge, hydrophobicity, and roughness.
- Sample Properties: Isoelectric point (pI), size, and conformational stability.
- Buffer Conditions: Ionic strength, pH, and presence of divalent cations.
Standard Static Adsorption Protocol for Proteins
Objective: Immobilize globular proteins onto freshly cleaved mica for AFM imaging. Materials:
- Protein of interest in a compatible buffer (e.g., 10 mM HEPES, pH 7.4).
- High-grade muscovite mica discs (e.g., V1 grade).
- Appropriate incubation chamber (e.g., Petri dish).
- Imaging buffer.
Methodology:
- Substrate Preparation: Cleave mica sheet with adhesive tape to obtain a fresh, atomically flat surface.
- Sample Application: Pipette 20-50 µL of protein solution (typical concentration 1-10 µg/mL) directly onto the mica surface.
- Incubation: Place the mica in a humid chamber to prevent evaporation. Incubate for 5-30 minutes at room temperature or 4°C, depending on adsorption kinetics.
- Rinsing: Gently rinse the surface with 3-5 mL of imaging buffer or ultrapure water to remove loosely bound molecules. Use a pipette or gentle stream from a wash bottle.
- Loading: Immediately place the mica disc into the AFM liquid cell, ensuring the surface remains hydrated.
Table 1: Optimized Adsorption Conditions for Common Biological Samples
| Sample Type | Recommended Substrate | Typical Concentration | Incubation Time | Key Buffer Component | Purpose |
|---|---|---|---|---|---|
| Globular Proteins | Fresh Mica | 1-10 µg/mL | 5-15 min | 1-10 mM MgCl₂ or NiCl₂ | Promotes cationic bridging |
| DNA/RNA | AP-mica or Spermidine-treated mica | 0.1-1 ng/µL | 2-5 min | 10 mM HEPES, pH 7.5 | Maintains nucleic acid structure |
| Lipid Bilayers | Silica or Mica | 0.1-1 mg/mL lipid | 30+ min (for vesicle fusion) | 150 mM NaCl, 2 mM CaCl₂ | Facilitates vesicle fusion & bilayer stability |
| Intact Bacterial Cells | Poly-L-Lysine coated glass | OD600 ~0.1 | 15-20 min | PBS or appropriate growth medium | Promotes cell adhesion |
Immobilization Protocols
Covalent or specific immobilization provides stronger, more controlled attachment, minimizing sample displacement by the AFM tip.
Functionalized Substrates
Substrates are chemically modified with specific functional groups or ligands.
Protocol: Covalent Immobilization via Amine Coupling on Gold-Coated Substrates Objective: Covalently tether amine-containing biomolecules to a gold surface using a self-assembled monolayer (SAM). Materials: Gold-coated glass slides, Ethanol, 11-Mercaptoundecanoic acid (11-MUA), N-Hydroxysuccinimide (NHS), 1-Ethyl-3-(3-dimethylaminopropyl)carbodiimide (EDC), Sample buffer (e.g., 10 mM MES, pH 6.0).
Methodology:
- SAM Formation: Incubate gold substrates in a 1 mM ethanolic solution of 11-MUA for 12-24 hours. Rinse thoroughly with ethanol and dry under nitrogen.
- Activation: Prepare a fresh aqueous solution of 75 mM NHS and 15 mM EDC. Pipette onto the SAM-functionalized surface for 15-30 minutes to activate carboxyl groups to NHS esters.
- Rinsing: Rinse gently with cold sample buffer (pH 6.0) to stop the reaction and remove excess reagents.
- Immobilization: Immediately apply the target biomolecule (in pH 6.0 buffer) to the activated surface. Incubate for 1 hour.
- Quenching: Rinse and incubate with 1 M ethanolamine hydrochloride (pH 8.5) for 10 minutes to deactivate any remaining esters.
- Final Rinse: Rinse extensively with the desired imaging buffer before AFM analysis.
Buffer Solutions for AFM Imaging
The choice of buffer is critical for maintaining sample viability, stability, and minimizing tip-sample interactions.
Table 2: Common AFM Imaging Buffers and Their Applications
| Buffer System | Typical Composition | Optimal pH Range | Key Advantages | Primary Use Case |
|---|---|---|---|---|
| Phosphate Buffered Saline (PBS) | 137 mM NaCl, 2.7 mM KCl, 10 mM Phosphate | 7.2 - 7.4 | Physiological osmolarity & ionicity | Live mammalian cell imaging |
| HEPES | 10-50 mM HEPES, 100-150 mM NaCl | 7.0 - 8.0 | Good buffer capacity, no metal chelation | Protein and membrane imaging |
| Tris-HCl | 10-50 mM Tris, optional salt | 7.0 - 9.0 | Inexpensive, wide pH range | DNA/protein imaging in non-physiological studies |
| ACES | 10-50 mM ACES, 100-150 mM NaCl | 6.0 - 7.0 | Minimal interference with biological processes; good for enzymatic studies | Imaging under specific enzymatic conditions |
Critical Buffer Considerations:
- Osmolarity: Must match physiological conditions (~300 mOsm/kg) for live cells.
- Divalent Cations: Mg²⁺ or Ca²⁺ (1-10 mM) often stabilize membranes and promote adsorption to mica.
- Additives: Antioxidants (e.g., Trolox), protease inhibitors, or energy sources (e.g., glucose) may be needed for long-term live-cell imaging.
- Filtering: Always filter buffers through a 0.1 or 0.02 µm filter to remove particulate contaminants that can clog the AFM fluid cell or be mistaken for sample features.
Experimental Workflow Visualization
Diagram 1: AFM Sample Prep Decision & Workflow
The Scientist's Toolkit: Essential Research Reagent Solutions
| Reagent / Material | Function in Sample Preparation |
|---|---|
| Muscovite Mica (V1 Grade) | Provides an atomically flat, negatively charged surface for adsorption of proteins, nucleic acids, and lipids. |
| Poly-L-Lysine Solution (0.1% w/v) | Coats glass/mica with a positive charge to enhance adhesion of negatively charged cells (e.g., bacteria, mammalian cells). |
| Aminopropyltriethoxysilane (APTES) | Silane used to functionalize glass/silica surfaces with amine groups for subsequent covalent coupling. |
| NHS/EDC Crosslinking Kit | Activates carboxyl groups on surfaces or samples for covalent amide bond formation with primary amines. |
| HBS Buffer (HEPES Buffered Saline) | Common buffer for biomolecular interactions; maintains pH and ionic strength with low interference. |
| MgCl₂ or NiCl₂ Stock Solution (1M) | Divalent cations promote adsorption of negatively charged biomolecules (DNA, proteins) to mica via cation bridging. |
| Filtered PBS (0.02 µm) | Physiological buffer for rinsing and imaging live cells; must be filtered to prevent AFM tip contamination. |
| Lipid Vesicles (e.g., DOPC) | Used to form supported lipid bilayers (SLBs) on mica/silica as mimics for cellular membranes. |
| BSA (Bovine Serum Albumin) | Often used as a blocking agent to passivate surfaces and reduce non-specific binding of samples or AFM tips. |
This whitepaper serves as a technical guide within the broader thesis of utilizing Atomic Force Microscopy (AFM) for nanoscale surface imaging research. Achieving high-resolution, artifact-free imaging in AFM is fundamentally dependent on stringent environmental control. Two primary imaging environments—ambient air and liquid—present distinct advantages and challenges, with thermal drift being a pervasive destabilizing factor in both. This document provides an in-depth analysis of these modalities, offers protocols for drift management, and presents current data to inform researchers and drug development professionals.
Core Principles: Imaging in Air vs. Liquid
Imaging in Air: This is the standard mode for many AFM applications. It is operationally simpler, allows for a wide range of probes, and is suitable for samples that are stable under ambient conditions. However, the main drawback is the formation of a capillary meniscus between the tip and the sample due to adsorbed water layers, which can lead to high, unstable lateral forces and sample damage. Electrostatic interactions can also be significant.
Imaging in Liquid: Immersing the tip-sample junction in a fluid cell eliminates capillary forces, drastically reducing vertical and lateral forces on the sample. This is essential for imaging soft, biological materials (e.g., proteins, live cells, lipid bilayers) in their native state. It also allows for the study of electrochemical processes in situ. Key challenges include increased thermal drift during initial equilibration, potential for contamination, more complex setup, and the excitation of spurious fluidic resonances that complicate dynamic mode operation.
Quantitative Comparison of Imaging Environments
Table 1: Comparative Analysis of AFM Imaging in Air vs. Liquid
| Parameter | Imaging in Air | Imaging in Liquid | Implications for Research |
|---|---|---|---|
| Forces on Sample | High capillary (≥10-100 nN), electrostatic, van der Waals | Capillary force eliminated; only van der Waals & electrostatic (screened) | Liquid enables non-destructive imaging of soft samples (e.g., biomolecules). |
| Typical Resolution | Molecular-scale (sub-nm) on hard, dry samples. | Atomic-scale on minerals; ~1 nm on biological samples. | Liquid enables true molecular/structural biology resolution. |
| Thermal Drift Rate | Low after thermal equilibrium (~0.1-0.5 nm/min). | Very high initially (5-20 nm/min), stabilizing after ~1 hour. | Requires precise protocol for equilibration before high-res imaging. |
| Applicable Modes | Contact, Tapping, PeakForce Tapping, most electrical modes. | Contact, Tapping (challenging), PeakForce Tapping, Force Spectroscopy. | Mode choice is critical; fluid damping affects oscillatory modes. |
| Sample Compatibility | Hard materials, polymers, dry biological fixed samples. | Soft materials, biological samples in vitro, electrochemical interfaces. | Liquid is mandatory for in situ drug-target interaction studies. |
| Operational Complexity | Low. | High (sealing, bubble avoidance, probe handling). | Requires trained personnel and specialized equipment. |
Managing Thermal Drift: Theory and Protocols
Thermal drift arises from the gradual expansion or contraction of the AFM instrument components due to temperature fluctuations, causing apparent sample motion. It is most severe during the initial setup, especially when introducing liquid at a different temperature than the stage.
Diagram Title: Thermal Drift Sources and Consequences in AFM
Experimental Protocol for Drift Minimization
Protocol 1: Pre-Imaging Thermal Equilibration for Liquid AFM
- Temperature Pre-Matching: Allow the imaging buffer and sealed fluid cell (with sample mounted) to sit on the AFM stage for 30 minutes prior to injection.
- Syringe Temperature Control: Store the syringe filled with buffer in the same room/area as the AFM.
- Gentle Injection: Inject liquid slowly to minimize thermal shock. Use the instrument's purge valves carefully to avoid bubble formation.
- Initial Wait Period: After injection, engage the cantilever at a low setpoint far from the sample surface. Allow the system to equilibrate for 60-90 minutes without scanning.
- Drift Monitoring: Use the AFM's software drift compensation feature or manually track a fixed feature in slow, repeated scans to monitor the drift rate. Commence high-resolution imaging only when the drift falls below an acceptable threshold (e.g., <1 nm/min).
Protocol 2: Drift-Compensated Imaging and Measurement
- Fast-Axis Alignment: Align the fast-scan direction along the estimated primary drift vector (often perpendicular to the cantilever long axis).
- Drift Compensation Software: Utilize the instrument's real-time drift correction (e.g., "Drift Compensate" or "Track") if available, which adjusts the scan coordinates based on calculated drift.
- Post-Processing: For critical measurements, use image analysis software to correct residual drift by aligning scan lines or image features.
The Scientist's Toolkit: Essential Research Reagents & Materials
Table 2: Key Reagents and Materials for Environmental Control in AFM
| Item | Function & Importance |
|---|---|
| Liquid AFM Fluid Cell | Sealed chamber that encloses the sample and cantilever for immersion. Must be compatible with the scanner and optics. |
| Bio-Compatible Cantilevers | Low spring constant (0.01-1 N/m) probes, often with reflective gold or silver coating for liquid operation (e.g., SNL, DNP, MLCT probes). |
| High-Purity Buffers (PBS, HEPES, Tris) | Provide physiological pH and ionic strength for biological samples. Must be filtered (0.02 µm) to remove particulates. |
| Temperature Control Stage | Actively heats/cools the sample to maintain constant temperature (±0.1°C), critical for drift management and live-cell studies. |
| Acoustic & Vibration Isolation Enclosure | Mitigates building and acoustic vibrations, which are a major source of noise, especially in softer liquid environments. |
| Inline Liquid Degasser | Removes dissolved gases from buffers to prevent bubble formation in situ, which destroys imaging. |
| Calibration Gratings (TGZ/GT series) | Samples with known pitch and height (e.g., 1 µm, 10 µm, 200 nm steps) for scanner calibration in both air and liquid. |
| Plasma Cleaner | For cleaning cantilevers and sample substrates to remove organic contaminants, ensuring reproducible surface properties and adhesion. |
Workflow for Optimized Environmental AFM Imaging
Diagram Title: AFM Imaging Workflow with Environmental Control
Selecting between liquid and air environments in AFM is a fundamental decision dictated by sample properties and research questions. While liquid imaging is indispensable for life science applications, it introduces significant complexity, primarily through exacerbated thermal drift. Adherence to rigorous pre-imaging equilibration protocols, combined with the use of specialized materials and instrument features, is non-negotiable for achieving nanoscale resolution and quantitative accuracy. Mastery of these environmental control techniques is a cornerstone of the broader thesis that AFM is a powerful, versatile tool for nanoscale surface science, provided its operational parameters are meticulously managed.
Chemical Force Microscopy (CFM) is a powerful scanning probe technique derived from Atomic Force Microscopy (AFM) that enables the mapping of specific chemical interactions and mechanical properties at nanoscale resolution. Within a broader thesis on AFM for nanoscale surface imaging, CFM represents a critical evolution from topographical mapping to functional, chemical recognition imaging. Its core principle involves the chemical functionalization of AFM probe tips with specific molecular moieties (e.g., thiols, silanes, biotin, antibodies), transforming them into sensitive, chemically-specific nanosensors. Achieving high specificity and reproducible force measurements is paramount, making probe functionalization the most critical experimental step. This guide details current protocols, reagents, and validation strategies for robust CFM experiments.
Core Functionalization Strategies and Quantitative Comparisons
The choice of functionalization strategy depends on the probe material (typically silicon, silicon nitride, or gold-coated), the desired ligand, and the required stability under experimental conditions (e.g., liquid pH, applied force). The following table summarizes the primary approaches.
Table 1: Common CFM Probe Functionalization Methods
| Method | Probe Substrate | Chemistry / Linker | Typical Ligands | Force Resolution | Stability | Key Advantage |
|---|---|---|---|---|---|---|
| Thiol-Gold | Gold-coated tip | Au-S covalent bond | Alkanethiols, HS-(CH₂)ₙ-X | ~10-50 pN | High in non-oxidizing conditions | Simple, well-defined monolayer, easy to mix (e.g., OH/CH₃ for hydrophobicity). |
| Silane Chemistry | Silicon/Si₃N₄ tip | Siloxane (Si-O-Si) bond | APTES, OTMS, PEG-silanes | ~50-100 pN | Moderate to High | Directly functionalizes oxide layer on silicon tips, versatile. |
| PEG Crosslinker | Amino-silanized tip | Heterobifunctional PEG (e.g., NHS-ester/maleimide) | Proteins, antibodies, peptides | ~50-200 pN | High in aqueous buffer | Long, flexible spacer reduces non-specific adhesion, preserves bioactivity. |
| Click Chemistry | Azide/Alkyne-modified tip | Copper-catalyzed Azide-Alkyne Cycloaddition (CuAAC) | Small molecules, tags | ~50-150 pN | Very High | Highly specific, bioorthogonal, modular ligand attachment. |
| Physisorption | Bare or coated tip | Non-covalent adsorption | Polyelectrolytes, proteins | >100 pN | Low to Moderate | Simple but often lacks control and stability for quantitative CFM. |
Detailed Experimental Protocols
Protocol 1: Gold-Coated Tip Functionalization with Mixed Self-Assembled Monolayers (SAMs)
Objective: To create a tip with defined chemical termination (e.g., -COOH) and surrounded by a non-adhesive background (e.g., EG₃-OH) to minimize non-specific interactions.
Materials: Gold-coated AFM probes (e.g., CONTSCR, Bruker), 11-mercaptoundecanoic acid (MUA, 1 mM in ethanol), (1-mercaptoundec-11-yl)hexa(ethylene glycol) (EG₃-OH, 3 mM in ethanol), absolute ethanol, phosphate buffered saline (PBS, pH 7.4), 1-ethyl-3-(3-dimethylaminopropyl)carbodiimide (EDC, 400 mM), N-hydroxysuccinimide (NHS, 100 mM).
Method:
- Cleaning: Plasma clean gold-coated probes for 2-5 minutes to remove organic contaminants and refresh the gold surface.
- SAM Formation: Immediately immerse tips in a mixed ethanolic solution of MUA and EG₃-OH (typical molar ratio 1:9 for 10% active tip) for 18-24 hours at room temperature in the dark.
- Rinsing: Rinse thoroughly with pure ethanol to remove physically adsorbed thiols, followed by a gentle stream of N₂ gas to dry.
- Activation (for biomolecule coupling): For coupling amines (e.g., proteins), activate the terminal -COOH groups. Immerse the tip in a freshly prepared aqueous solution of EDC (400 mM) and NHS (100 mM) for 10-15 minutes.
- Ligand Coupling: Rinse with PBS (pH 7.4) and immediately incubate with the target amine-containing ligand (e.g., 50-200 µg/mL in PBS) for 30-60 minutes.
- Quenching & Storage: Quench unreacted NHS-esters by immersing in 1 M ethanolamine-HCl (pH 8.5) for 10 min. Rinse with PBS and store in PBS at 4°C until use (preferably within 24 hours).
Protocol 2: Silicon Nitride Tip Functionalization via Silanization and PEG Spacer
Objective: To attach a biomolecule (e.g., an antibody) via a long, flexible poly(ethylene glycol) (PEG) crosslinker, providing mobility and reducing steric hindrance.
Materials: Silicon nitride probes (e.g., MLCT, Bruker), (3-aminopropyl)triethoxysilane (APTES), anhydrous toluene, triethylamine, heterobifunctional PEG crosslinker (e.g., NHS-PEG-Maleimide, 5 kDa), ligand with free thiol or amine, appropriate buffers (PBS, HEPES).
Method:
- Surface Hydroxylation: Clean probes in a UV-Ozone cleaner or piranha solution (Caution: Extremely hazardous) for 20-30 minutes to generate a high-density of surface silanol (Si-OH) groups.
- Aminosilanization: Vapor-phase deposition is preferred for uniform monolayers. Place tips and a 50 µL drop of APTES in a sealed container with 50 µL of triethylamine (catalyst). Incubate at 70°C for 2-3 hours. Alternatively, incubate in a 2% (v/v) APTES solution in anhydrous toluene for 1 hour at room temperature.
- Rinsing: Rinse thoroughly with toluene followed by ethanol to remove unreacted silane.
- PEG Crosslinker Attachment: Dissolve NHS-PEG-Maleimide in anhydrous DMSO or PBS (pH 7.2-7.5) to ~5 mg/mL. Incubate the aminated tips in this solution for 2-3 hours at room temperature. The NHS ester reacts with the primary amine on the tip.
- Rinsing: Rinse with PBS to remove unreacted crosslinker.
- Ligand Attachment: Incubate the maleimide-activated tips with a thiolated ligand (e.g., reduced antibody, peptide) at 10-100 µg/mL in PBS (without thiols like DTT) for 1 hour. For amine ligands, use a homobifunctional NHS-PEG-NHS crosslinker in step 4.
- Blocking: Quench unreacted maleimide groups with 10 mM β-mercaptoethanol for 10 minutes. Rinse and store in suitable buffer.
Validation and Control Experiments
Specificity in CFM must be validated through rigorous control experiments:
- Blocking Studies: Perform force measurements in the presence of a soluble ligand or receptor that competitively inhibits the specific interaction. A significant drop in adhesion frequency confirms specificity.
- Inert Surface Test: Measure adhesion on a surface known to lack the target. Adhesion frequency should be near zero.
- Functionality Test: Use a surface functionalized with the pure target molecule. High, reproducible adhesion confirms active tip conjugation.
- Force Spectroscopy: Collect force-distance curves to measure the unbinding force of single molecular pairs. Analyze the rupture force distribution; a peak at a characteristic value (e.g., ~50-150 pN for a single biotin-avidin bond) indicates specific interaction.
The Scientist's Toolkit: Essential Research Reagent Solutions
Table 2: Key Reagents for CFM Probe Functionalization
| Reagent / Material | Function / Role | Key Consideration |
|---|---|---|
| Gold-Coated AFM Probes | Provides a stable, crystalline substrate for thiol-based SAM formation. | Ensure uniform coating; Cr or Ti adhesion layer may influence elasticity. |
| Alkanethiols (e.g., MUA, MCH) | Form ordered SAMs; terminal group (-COOH, -CH₃) defines tip chemistry. | Use high-purity (>95%), store under inert atmosphere to prevent oxidation. |
| EG₃-OH or EG₆-OH Thiols | Create non-fouling, hydrophilic background in mixed SAMs to minimize non-specific binding. | Critical for isolating single-molecule events in complex media (e.g., serum). |
| APTES | Silane coupling agent that introduces primary amine (-NH₂) groups onto silicon oxide surfaces. | Must be anhydrous to prevent polymerization; vapor-phase gives best monolayer. |
| Heterobifunctional PEG Crosslinkers (NHS-PEG-Maleimide) | Spacer arm that reduces steric hindrance and non-specific adhesion while enabling specific bioconjugation. | PEG length (e.g., 3.4 kDa) tunes flexibility and reach; shield from moisture. |
| EDC / NHS | Carbodiimide crosslinker system for activating carboxyl groups to form amide bonds with amines. | Solutions must be freshly prepared due to rapid hydrolysis in water. |
| UV-Ozone Cleaner | Generates a clean, hydrophilic surface rich in hydroxyl groups on silicon-based materials. | More controlled and safer than piranha solution for surface activation. |
Visualization of Workflows and Relationships
Diagram 1: CFM Probe Functionalization Decision Workflow
Diagram 2: Mixed SAM Formation & Bioconjugation on Gold
Validating AFM Data: Cross-Technique Correlation and Quantitative Analysis
This technical guide, framed within the broader thesis of Atomic Force Microscopy (AFM) for nanoscale surface imaging research, details the integration of AFM with optical (fluorescence, confocal) and electron (SEM) microscopy. Correlative microscopy synergistically combines AFM's nanomechanical and topographical data with the biochemical specificity of fluorescence and the high-resolution structural context of SEM/confocal imaging. This multi-modal approach is pivotal for researchers and drug development professionals investigating complex biological systems, materials, and nanomaterials.
Core Integration Methodologies & Protocols
AFM-Fluorescence/Confocal Integration
This protocol enables simultaneous or sequential acquisition of topographic/mechanical data and fluorescent biomarker localization.
Experimental Protocol:
- Sample Preparation: Cells or biomolecules are cultured or immobilized on glass-bottom Petri dishes (e.g., MatTek dishes) or pre-cleaned coverslips.
- Labeling: Samples are labeled with standard fluorescent probes (e.g., fluorophore-conjugated antibodies, GFP-tagged proteins, membrane dyes like DiI). For fixed samples, use PBS for washing steps.
- Sequential Imaging:
- Step 1 (Optical): Locate the region of interest (ROI) using epifluorescence or confocal microscopy. Acquire a high-quality fluorescence Z-stack.
- Step 2 (Transfer): Carefully transfer the sample to the integrated AFM-optical stage, ensuring coordinate registration markers are present or using software-based stage relocation.
- Step 3 (AFM): Align the AFM tip with the ROI using the optical view. Perform AFM imaging in liquid (for live cells) or air (fixed) in PeakForce Tapping or Contact mode to obtain topography and DMT modulus maps.
- Simultaneous Imaging: Use an inverted optical microscope integrated with an AFM (e.g., Bruker BioScope, JPK NanoWizard). The AFM head is positioned above the sample, allowing confocal imaging from below through the objective. Acquire both data streams concurrently in time-lapse mode.
AFM-SEM Integration
This protocol correlates nanoscale surface properties with ultra-high-resolution structural and compositional data.
Experimental Protocol:
- Sample Preparation: Samples (e.g., nanomaterials, polymers, bacterial biofilms) are prepared on silicon wafers or conductive ITO-coated coverslips. Sputter-coat with a thin (2-5 nm) layer of Au/Pd if non-conductive, unless performing low-voltage ESEM on hydrated samples.
- Marker Deposition: Apply fiducial markers (e.g., 100 nm gold nanoparticles) near the ROI using a micro-spotter or dilute suspension droplet to facilitate precise relocation.
- Sequential Imaging:
- Step 1 (AFM): Image the ROI in air or controlled atmosphere. Save precise stage coordinates.
- Step 2 (Transfer): Transfer the sample to the SEM chamber using a vacuum-compatible sample holder. Ensure the holder is compatible with both instruments to minimize movement.
- Step 3 (SEM): Relocate the ROI using the fiducial markers and/or stage coordinates. Acquire secondary electron (SE) and backscattered electron (BSE) images at varying kV (1-10 kV) to optimize surface detail and material contrast.
- Data Correlation: Use specialized software (e.g., Bruker Correlation, Atlas 5 by Tescan) to overlay and align AFM topography with SEM images based on fiducial markers.
Data Presentation
Table 1: Quantitative Performance Comparison of Integrated Modalities
| Integration Type | Lateral Resolution | Vertical Resolution | Key Measurable Parameters | Optimal Sample Type | Throughput |
|---|---|---|---|---|---|
| AFM-Fluorescence (simult.) | AFM: 1-5 nm; Fluor: ~200 nm | AFM: 0.1 nm | Topography, Elasticity, Fluorescence Intensity, Co-localization | Live/ Fixed Cells, Membranes | Medium |
| AFM-Confocal (simult.) | AFM: 1-5 nm; Confocal: ~180 nm | AFM: 0.1 nm; Confocal: ~500 nm | 3D Topography, Modulus, 3D Fluorescence Volume | Cell Clusters, Tissue Sections | Low-Medium |
| AFM-SEM (sequential) | AFM: 1-5 nm; SEM: 1-3 nm | AFM: 0.1 nm; SEM: N/A | Topography, Adhesion, Ultramorphology, Composition | Nanomaterials, Hard Biomaterials, Biofilms | Low |
Table 2: Common Research Reagent Solutions Toolkit
| Item | Function/Description | Example Product/Brand |
|---|---|---|
| Glass-bottom Culture Dishes | Provides optical clarity for inverted microscopy and a substrate for AFM scanning. | MatTek P35G-1.5-14-C |
| Fiducial Markers | High-contrast nanoparticles for precise relocation and image overlay between modalities. | 100 nm Gold Nanoparticles (Cytodiag) |
| Functionalized AFM Tips | Tips coated with specific molecules (e.g., ligands, antibodies) for force spectroscopy measurements on labeled cells. | Bruker MLCT-BIO (Biotinylated) |
| Live-Cell Dyes | Fluorescent probes for labeling membranes, organelles, or ions with minimal toxicity for concurrent AFM/optical imaging. | CellMask (Membrane), Fluo-4 AM (Calcium) |
| AFM Cantilever Calibration Kit | Standard sample with known topography and spring constant for calibrating AFM tips. | Bruker PG Sample (Grating), Thermal Tune Kit |
| Conductive Substrates | Essential for SEM imaging; prevents charging. Can also be used for AFM. | Silicon Wafers, ITO-coated coverslips |
| Correlation Software | Dedicated platform for automated image stitching, overlay, and multi-modal data analysis. | Bruker Correlation, Atlas 5 (Tescan), ARivis4D |
Visualization: Experimental Workflows
AFM-Optical Correlative Workflow
AFM-SEM Correlative Workflow
Atomic Force Microscopy (AFM) has become a cornerstone in nanoscale surface characterization, providing three-dimensional topographical data with sub-nanometer vertical resolution. Within the broader thesis of advancing AFM for material and life sciences, the quantitative extraction of topographic parameters is critical. This guide details the core metrics of areal roughness (Ra, Rq), isolated particle height analysis, and cross-sectional profiling, which are indispensable for applications ranging from quantifying thin film uniformity in semiconductor engineering to analyzing nanoparticle morphology in drug delivery system development.
Core Quantitative Parameters: Definitions and Significance
Roughness Parameters
Surface roughness quantifies the texture of a surface at the nanoscale. The two primary amplitude parameters are:
- Arithmetic Average Roughness (Ra): The arithmetic mean of the absolute values of the surface height deviations from the mean plane. It provides a general descriptor of surface texture.
- Root Mean Square Roughness (Rq): The root mean square average of height deviations taken from the mean data plane. Rq is more sensitive to peaks and valleys than Ra.
Particle Height Analysis
This involves measuring the vertical distance from the substrate to the top of isolated surface features (e.g., nanoparticles, proteins, nanotubes). It is crucial for determining size distribution and conformation.
Section Analysis
A method to extract a two-dimensional height profile along a user-defined line across the AFM image. It enables precise measurement of feature heights, widths, and spacings.
Experimental Protocols for AFM-Based Topography Analysis
Protocol 1: Sample Preparation & AFM Imaging for Quantitative Analysis
- Substrate Selection: Use atomically flat substrates (e.g., freshly cleaved mica, highly polished silicon) for high-resolution measurements. Functionalized substrates may be used for specific biomolecular immobilization.
- Sample Deposition: For nanoparticles or biomolecules, employ drop-casting, spin-coating, or chemical adsorption techniques. Optimize concentration to prevent aggregation and facilitate isolated particle analysis.
- AFM Imaging Mode Selection:
- Use Tapping Mode in air or fluid for soft, adhesive, or biological samples to minimize lateral forces.
- Use Contact Mode for hard, stable surfaces where higher resolution is needed (with caution for sample damage).
- Scan Parameters: Set an appropriate scan rate (0.5-1.5 Hz), resolution (512x512 or 1024x1024 pixels), and scan size to adequately resolve features of interest.
- Image Flattening: Apply a first- or second-order flattening algorithm to the raw AFM image to remove sample tilt and bow. Avoid over-flattening, which can erase real topographic features.
Protocol 2: Quantitative Roughness (Ra, Rq) Measurement
- Region of Interest (ROI) Selection: Define a representative, particulate-free area for roughness measurement. Exclude large defects or aggregates.
- Planar Subtraction: Perform a final, gentle plane fit to the ROI to set the mean height to zero.
- Parameter Calculation: Use the instrument's built-in software or external analysis tools (e.g., Gwyddion, NanoScope Analysis) to calculate Ra and Rq over the entire ROI.
- Reporting: Always report the scan size and measurement area alongside Ra and Rq values.
Protocol 3: Particle Height and Section Analysis
- Particle Identification: Use thresholding or watershed algorithms to automatically identify isolated particles in the flattened image.
- Baseline Definition: For each particle, manually or automatically define the surrounding substrate baseline.
- Height Measurement: Calculate particle height as the difference between the highest point (peak) on the particle and the average baseline height.
- Cross-Sectional Profiling: Draw a line profile across one or multiple particles. Extract the height (Z) at each point along the line (X). Measure feature height from trough to peak and width at Full Width at Half Maximum (FWHM).
Data Presentation: Comparative Tables
Table 1: Comparison of Ra and Rq Roughness Parameters
| Parameter | Mathematical Definition | Sensitivity to Outliers | Typical Application Context | ||
|---|---|---|---|---|---|
| Arithmetic Average Roughness (Ra) | $$Ra = \frac{1}{n} \sum_{i=1}^{n} | y_i | $$ | Low. Provides a general average. | Quality control of thin film coatings, general surface finish specification. |
| Root Mean Square Roughness (Rq) | $$Rq = \sqrt{\frac{1}{n} \sum_{i=1}^{n} y_i^2}$$ | High. Squares deviations, emphasizing peaks/valleys. | Research applications where extreme features are critical (e.g., tribology, electrical contact). |
Table 2: Key Outputs from AFM Topography Analysis
| Analysis Type | Primary Measured Outputs | Key Derived Parameters | Relevance to Drug Development |
|---|---|---|---|
| Areal Roughness | Ra, Rq (nm) | Skewness (Rsk), Kurtosis (Rku) | Quantifying lipid bilayer or polymer coating uniformity on nanoparticle drug carriers. |
| Particle Height | Individual particle heights (nm) | Mean height, standard deviation, population histogram. | Determining size homogeneity of viral vectors or exosome-based therapeutics. |
| Section Analysis | 2D height profile (Z vs. X) | Feature height, width, periodicity, sidewall angle. | Measuring the thickness of a drug-loaded film or the dimensions of nanopores in a membrane. |
Mandatory Visualizations
Diagram Title: AFM Topography Analysis Workflow
Diagram Title: Ra and Rq Calculation from Profile
The Scientist's Toolkit: Research Reagent Solutions & Essential Materials
Table 3: Essential Materials for AFM Sample Preparation and Analysis
| Item | Function & Purpose | Example Product/Type |
|---|---|---|
| Atomically Flat Substrate | Provides an ultra-smooth, reproducible baseline for height measurements and minimizes background roughness. | Freshly cleaved muscovite mica, Highly polished P-type silicon wafers. |
| Functionalized Substrate | Chemically binds specific samples (e.g., proteins, DNA) to prevent drift and enable imaging in fluid. | Aminosilane-coated coverslips, APTES-mica, Gold substrates with thiol chemistry. |
| Sample Immobilization Buffer | Maintains biological activity and conformation during deposition and fluid imaging. | Phosphate Buffered Saline (PBS), HEPES buffer, often with Mg²⁺ ions for biomolecules. |
| AFM Probe (Cantilever) | The physical tip that interacts with the sample. Choice dictates resolution and sample interaction force. | Tapping Mode: Silicon probes (e.g., RTESPA-300). Contact Mode: Silicon nitride probes (e.g., MLCT). |
| Image Processing Software | For advanced flattening, particle analysis, roughness calculation, and batch processing beyond vendor software. | Gwyddion (open-source), MountainsSPIP, SPIP, ImageJ with SPM plugins. |
| Vibration Isolation System | Critical for achieving high-resolution AFM images by minimizing environmental acoustic and floor vibrations. | Active anti-vibration table, passive pneumatic isolation platform. |
This analysis, framed within a broader thesis on Atomic Force Microscopy (AFM) for nanoscale surface imaging, provides a technical comparison of AFM and Electron Microscopy (EM) techniques, namely Scanning Electron Microscopy (SEM) and Transmission Electron Microscopy (TEM). For materials science, nanotechnology, and life sciences research—including drug development—selecting the appropriate high-resolution imaging tool is critical. Each technique operates on distinct physical principles, offering unique advantages, limitations, and types of complementary data. This guide synthesizes current information to aid researchers in tool selection and multimodal experimentation.
Fundamental Principles and Methodologies
Atomic Force Microscopy (AFM)
AFM measures surface topography using a sharp tip on a cantilever. A laser deflection system monitors tip-sample interactions (Van der Waals, mechanical, electrical, magnetic), generating a 3D profile. It operates in contact, tapping, or non-contact modes.
Key Experimental Protocol (AFM Tapping Mode in Air):
- Sample Preparation: Sample (e.g., polymer film, fixed cells) is securely mounted on a metal puck using adhesive.
- Tip Selection: Choose an appropriate silicon or silicon nitride tip (frequency ~300 kHz).
- Loading: Insert puck and tip into the AFM scanner.
- Approach: Use automated approach to bring tip within ~0.5-1 µm of the sample surface.
- Tuning: Set the drive frequency to the tip's resonant frequency. Adjust drive amplitude.
- Scan Parameter Set-up: Set scan size (e.g., 5 µm x 5 µm), scan rate (0.5-1 Hz), and setpoint amplitude (typically 70-80% of free amplitude).
- Engage & Scan: Engage the tip and initiate raster scanning.
- Data Acquisition: Topography (height), amplitude, and phase data are collected simultaneously.
- Retract & Store: Retract the tip after scanning. Store data and clean the tip if necessary.
Scanning Electron Microscopy (SEM)
SEM scans a focused electron beam across a sample. Emitted secondary electrons (SE) and backscattered electrons (BSE) are collected to create a high-resolution, 3D-like 2D image of the surface.
Key Experimental Protocol (SEM Imaging of Conductive Sample):
- Sample Preparation: Sample (e.g., metal, insect) is mounted on an aluminum stub using conductive carbon tape.
- Coating (if non-conductive): Sputter-coat with a 5-10 nm layer of gold/palladium in an argon atmosphere.
- Loading: Place stub in the SEM sample chamber and evacuate to high vacuum (~10^-3 to 10^-5 Pa).
- Alignment: Align electron gun and apertures.
- Parameter Set-up: Set accelerating voltage (typically 5-20 kV), probe current, and working distance (e.g., 10 mm).
- Focus & Stigmation: Use coarse/fine focus and stigmator controls to sharpen the image at high magnification.
- Scan: Initiate raster scanning at desired magnification and resolution.
- Detection: Adjust contrast/brightness based on SE or BSE detector signal.
- Image Capture: Acquire and store digital micrograph.
Transmission Electron Microscopy (TEM)
TEM transmits a high-energy electron beam through an ultrathin sample. Interactions (scattering, diffraction) produce a 2D projection image or diffraction pattern, revealing internal structure.
Key Experimental Protocol (TEM Imaging of a Biological Thin Section):
- Sample Preparation (Complex): Fix cells with glutaraldehyde, dehydrate in ethanol, embed in resin, and polymerize.
- Sectioning: Use an ultramicrotome to cut 60-90 nm thin sections.
- Staining: Treat sections with heavy metal stains (e.g., uranyl acetate, lead citrate) for contrast.
- Grid Mounting: Float sections onto a 3mm copper TEM grid.
- Loading: Insert grid into a TEM specimen holder and load into the column. Achieve high vacuum (~10^-4 Pa).
- Alignment: Perform gun, condenser, and objective lens alignments.
- Imaging: Select area of interest at low magnification. Switch to desired magnification (e.g., 20,000x-100,000x).
- Focus & Astigmatism Correction: Use focus knob and stigmators at high magnification.
- Exposure: Acquire image using a CCD or direct electron detector.
Comparative Analysis: Quantitative Data
Table 1: Core Technical Specifications and Performance
| Feature | AFM | SEM | TEM |
|---|---|---|---|
| Resolution (Lateral) | ~0.2-1 nm (atomic in ideal cases) | ~0.5-10 nm | <0.1-0.5 nm (sub-atomic) |
| Resolution (Vertical) | <0.1 nm (excellent height data) | N/A (2D image) | N/A (2D projection) |
| Depth of Field | Low (due to probe geometry) | Very High | Moderate |
| Max Sample Size | cm range (lateral), ~10 mm (height) | cm range | <3 mm grid, ~100-200 nm thickness |
| Imaging Environment | Air, Liquid, Vacuum | High Vacuum (typically) | High Vacuum |
| Sample Conductivity | Not Required | Required (or coating) | Required (thin, conductive if possible) |
| Primary Data Type | 3D Topography, Mechanical Properties | 2D Surface Morphology | 2D Internal Structure/Crystallography |
| Sample Preparation | Minimal (usually) | Moderate (often requires coating) | Extensive (fixation, sectioning, staining) |
| Throughput | Slow (serial scanning) | Fast | Moderate-Slow |
| Live Cell Imaging | Yes (in fluid) | No (vacuum) | No (vacuum, thin sample) |
Table 2: Common Applications and Data Output
| Application | AFM Advantages | EM (SEM/TEM) Advantages | Complementary Data Approach |
|---|---|---|---|
| Surface Roughness | Quantitative 3D roughness parameters (Ra, Rq) | Qualitative visual assessment | AFM provides quantitative stats; SEM gives wide-field context. |
| Nanoparticle Analysis | Size, distribution, 3D shape in native state | High-throughput imaging, core-shell structure (STEM) | Use SEM for quick size/distribution stats; AFM for true 3D height; TEM for internal architecture. |
| Biological Membranes | Native, fluid imaging; molecular interactions (force spectroscopy) | High-res ultrastructure of fixed, stained membranes | TEM reveals detailed internal membrane proteins (negative stain); AFM measures mechanical properties in liquid. |
| Polymer/Biomaterial Morphology | Surface modulus, adhesion, phase separation (phase imaging) | Deep sub-surface structure (SEM cross-section), fine fibril detail (TEM) | Combine AFM nanomechanical mapping with TEM microtomed sections for full structure-property correlation. |
| Semiconductor Defects | Electrical (SSRM, KPFM) & mechanical properties at defect sites | Rapid large-area defect locating (SEM), atomic-scale crystal defects (TEM) | Use SEM to locate defects, then AFM to characterize electrical activity non-destructively. |
Complementary Data and Correlative Microscopy
The most powerful research strategy often involves using AFM and EM sequentially on the same sample. AFM provides functional, nanomechanical, and topographic data under ambient or liquid conditions, while EM delivers ultra-high-resolution structural and compositional information. For example, in lipid bilayer research, AFM can image domain formation dynamics in buffer, after which the same sample can be plunge-frozen and imaged by cryo-TEM to obtain detailed molecular lattice information. Critical to this is the use of finder grids (for TEM) or photolithographically patterned substrates that allow relocating the exact same region of interest between instruments.
The Scientist's Toolkit: Essential Research Reagents & Materials
| Item | Primary Function | Typical Use Case |
|---|---|---|
| Mica Discs (V1 or V4 Grade) | Atomically flat, negatively charged substrate for sample adsorption. | AFM imaging of biomolecules (proteins, DNA), lipid bilayers. |
| Conductive Carbon Tape | Adheres sample to SEM stub and provides a conductive path to ground. | Mounting non-magnetic samples for SEM to prevent charging. |
| Sputter Coater (Au/Pd Target) | Deposits a thin, conductive metal layer on insulating samples. | Preparing polymers, biological tissues, or ceramics for SEM imaging. |
| Uranyl Acetate & Lead Citrate | Heavy metal stains that scatter electrons, providing contrast in TEM. | Staining ultrathin resin sections of biological or soft material samples. |
| Glutaraldehyde (EM Grade) | Cross-linking fixative that preserves ultrastructure. | Primary fixation for biological TEM and SEM samples. |
| Silicon Nitride AFM Cantilevers | Low spring constant probes for imaging in liquid. | Tapping mode or contact mode AFM of soft samples (cells, gels). |
| Finder Grids (e.g., Quantifoil) | TEM grids with coordinate patterns. | Relocating specific cells or particles for correlative TEM/AFM. |
| Phosphate Buffered Saline (PBS) | Isotonic buffer for maintaining physiological pH and osmolarity. | Hydrating and rinsing biological samples during AFM in liquid. |
| Resin Embedding Kit (e.g., Epoxy) | Infiltrates and hardens samples for ultrathin sectioning. | Preparing solid samples (cells, tissues, polymers) for TEM. |
Visualized Workflows and Logical Relationships
Diagram 1: Research Tool Selection Logic (100 chars)
Diagram 2: Correlative AFM-SEM Workflow (99 chars)
Within the broader thesis on Atomic Force Microscopy (AFM) for nanoscale surface imaging research, establishing statistical rigor is paramount. The unique challenges of AFM—including tip-sample convolution, environmental noise, and sample heterogeneity—demand a meticulous approach to experimental design, data acquisition, and analysis to ensure findings are reproducible and scientifically valid. This guide provides a technical framework for implementing statistical rigor in AFM studies, specifically tailored for researchers, scientists, and professionals in drug development where nanoscale characterization of surfaces, particles, and biomolecules is critical.
Core Statistical Concepts for AFM
Defining the Population and Sample
In AFM, the "population" could be all possible scan locations on a sample, all particles in a formulation, or all molecular complexes on a surface. The measured AFM images or force curves constitute a finite sample. A fundamental error is treating a single image or a few force curves as definitive.
Key Metrics Requiring Statistical Analysis
- Topographical Parameters: Roughness (Rq, Ra), particle height/diameter, surface area.
- Mechanical Properties: Young's modulus, adhesion force, deformation from force spectroscopy.
- Dynamic Processes: Binding rates, molecular unfolding forces, cellular elasticity changes.
Power Analysis and Sample Size Determination
The appropriate number of measurements (n) is not arbitrary. It must be determined via a priori power analysis to detect a meaningful effect size with sufficient probability (power > 0.8).
Formula for sample size estimation (comparison of two means):
n = 2 * [(Z_(α/2) + Z_β) * σ / δ]^2
Where: Z_(α/2) = Z-score for Type I error (e.g., 1.96 for α=0.05), Z_β = Z-score for Type II error (e.g., 0.84 for power=0.8), σ = estimated standard deviation, δ = minimum detectable effect size.
Table 1: Recommended Minimum Sample Sizes for Common AFM Analyses
| AFM Measurement Type | Recommended Minimum Independent Samples (n) | Justification & Notes |
|---|---|---|
| Surface Roughness (Rq) | 3-5 scans from ≥3 independent sample preparations | Accounts for scan location variability and sample preparation batch effects. |
| Nanoparticle Size Distribution | 100-300 individual particles from ≥3 batches | Required for robust distribution fitting (DLS/NTA comparison). |
| Single-Molecule Force Spectroscopy (Unfolding) | 500-1000 force curves from ≥2 protein batches | Captures full statistical distribution of unfolding events. |
| Cell Elasticity (Young's Modulus) | 50-100 force maps from ≥3 biological replicates (cells) | Mitigates intra-cell, inter-cell, and biological variability. |
| Adhesion Force Measurement | 200-500 curves from ≥3 sample regions | Adhesion can have high spatial variability. |
Table 2: Common Statistical Tests for AFM Data Analysis
| Research Question | Data Type | Recommended Statistical Test | AFM Application Example |
|---|---|---|---|
| Compare means of two groups | Normal distribution, equal variance | Student's t-test (unpaired) | Comparing roughness of control vs. treated surface. |
| Compare means of >2 groups | Normal distribution, equal variance | One-way ANOVA with post-hoc test | Comparing modulus across multiple cell lines. |
| Compare distributions | Non-normal or ranked data | Mann-Whitney U test (2 groups) / Kruskal-Wallis (>2 groups) | Comparing adhesion force distributions. |
| Assess correlation between two parameters | Continuous, paired measurements | Pearson's r (normal) / Spearman's ρ (non-normal) | Correlating particle height with adhesion. |
| Model dependence on multiple variables | Mixed continuous/categorical | Multiple Linear Regression | Predicting modulus from scan rate, force, and treatment. |
Detailed Experimental Protocols for Statistically Rigorous AFM
Protocol: Determining Nanoparticle Hydrodynamic Diameter via AFM Image Analysis
Objective: To obtain a statistically robust size distribution of nanoparticles deposited on a substrate.
- Sample Preparation (Independent Replicates): Prepare at least three separate dispersions of the nanoparticles from the same stock under identical conditions (e.g., sonication time, concentration).
- Substrate Preparation: Use freshly cleaved mica for each independent dispersion.
- Deposition: Deposit 10 µL of each dispersion onto separate mica substrates. Allow adsorption for 2 minutes, rinse gently with filtered deionized water, and dry under a gentle nitrogen stream.
- Image Acquisition (Systematic Random Sampling):
- On each of the three samples, locate a random starting point.
- Acquire 5-10 images (e.g., 5x5 µm) at non-overlapping locations using a predefined systematic grid pattern (e.g., move 50 µm between scans).
- Use the same AFM probe (scanning mode, e.g., tapping mode) and identical imaging parameters (setpoint, gains, scan rate) for all images.
- Image Analysis & Data Pooling:
- Use particle analysis software (e.g., Gwyddion, ImageJ) to identify and measure the diameter of all well-separated, individual particles in each image.
- Exclude particles on image edges or clearly aggregated clusters.
- Combine all measurements from all images across all three sample replicates into a single dataset (target: n ≥ 100).
- Statistical Reporting: Report the mean, standard deviation, and 95% confidence interval. Present the full distribution as a histogram. Compare distributions between groups using the Kruskal-Wallis test.
Protocol: Single-Molecule Force Spectroscopy (SMFS) for Protein Unfolding
Objective: To characterize the unfolding forces of a polyprotein with statistical significance.
- Sample and Probe Functionalization:
- Immobilize the polyprotein (e.g., (GB1)₈) onto a gold-coated substrate via gold-thiol chemistry.
- Functionalize a tipless cantilever with an alkanethiol linker (e.g., PEG) terminated with a reactive group (e.g., NHS) for covalent attachment to protein termini.
- Force Curve Collection:
- In buffer solution, approach the surface to allow protein attachment via the tip.
- Retract the tip at a constant velocity (e.g., 400 nm/s).
- Collect ≥1000 force-extension curves from random locations across at least two independently prepared samples.
- Data Screening and Analysis:
- Manually or algorithmically screen curves for the signature "sawtooth" pattern of sequential unfolding events.
- Fit each unfolding peak to the Worm-Like Chain (WLC) model to extract the unfolding force and contour length increment.
- Pool all validated unfolding forces from all replicates.
- Statistical Analysis:
- Plot a force histogram (bin width ~5-10 pN).
- Fit the histogram to a Gaussian distribution or analyze using Kernel Density Estimation.
- Report the most probable unfolding force (histogram peak) and the standard deviation. Use bootstrapping methods to estimate the confidence interval for the mean unfolding force.
Diagrams for Workflows and Logical Frameworks
Title: Statistical Rigor Workflow for AFM
Title: AFM Data Processing & Analysis Pipeline
The Scientist's Toolkit: Key Research Reagent Solutions
Table 3: Essential Materials for Statistically Rigorous AFM Experiments
| Item / Reagent | Function / Role in Statistical Rigor | Example Product / Note |
|---|---|---|
| Freshly Cleaved Mica Substrates | Provides an atomically flat, consistent baseline for sample deposition, minimizing substrate-induced variability. | Muscovite Mica V1 (Ted Pella) |
| Calibration Gratings | Essential for daily verification of scanner linearity and dimensional accuracy in X, Y, and Z axes. | TGZ1-TGZ3 (NT-MDT Spectrum Instruments), HS-100MG (Bruker) |
| Reference Samples (PS/LDPE) | Used to validate roughness measurements and tip condition, providing an inter-laboratory benchmark. | Polystyrene & Low-Density Polyethylene (Bruker) |
| Functionalized AFM Probes (SMFS) | Probes with consistent, covalent chemistry (e.g., PEG linker) reduce variability in single-molecule attachment efficiency. | Si3N4 TL-CAL (Biolever, Olympus) with custom PEGylation. |
| Standardized Buffers & Salts | Controlled ionic strength and pH are critical for reproducible biomolecular and force spectroscopy experiments. | Use molecular biology-grade reagents (e.g., Tris, PBS, NaCl). |
| Vibration & Acoustic Isolation Enclosure | Minimizes environmental noise, a major source of non-biological variance in high-resolution imaging and force measurements. | Custom or commercial passive/active isolation systems. |
| Automated Image Analysis Software | Removes user bias in particle picking, thresholding, and parameter measurement. | Gwyddion (Open Source), SPIP (Image Metrology), NanoScope Analysis. |
| Statistical Software Package | Enables proper power analysis, complex statistical testing, and confidence interval calculation. | R, Python (SciPy/Statsmodels), GraphPad Prism. |
Within the broader thesis on Atomic Force Microscopy (AFM) for nanoscale surface imaging research, a critical challenge is the validation of nanomechanical properties measured via advanced modes like Quantitative Nanomechanical Mapping (QNM). This guide details the methodology for correlating nanoscale QNM data with established bulk measurement techniques, providing a framework for researchers in materials science and drug development to ensure data fidelity and bridge the micro-to-macro property gap.
Fundamental Principles: QNM vs. Bulk Techniques
Quantitative Nanomechanical Mapping (QNM) is a peak-force tapping AFM mode that simultaneously generates topographical images and maps of mechanical properties (e.g., DMT modulus, adhesion, deformation, dissipation) at nanometer resolution. Bulk techniques, such as dynamic mechanical analysis (DMA) or nanoindentation, measure averaged properties over larger volumes (mm³ to µm³). Correlation validates the QNM's accuracy and ensures it probes material properties independent of scale-dependent artifacts.
Table 1: Core Techniques for Nanomechanical and Bulk Property Measurement
| Technique | Measured Property | Typical Resolution/Sample Volume | Key Principle | Best For |
|---|---|---|---|---|
| AFM-QNM | Elastic Modulus (DMT/Young's), Adhesion Energy, Deformation | Lateral: <10 nm, Depth: ~1 nm | Peak force control & Derjaguin–Muller–Topov (DMT) model analysis on force-distance curves. | Heterogeneous surfaces, thin films, single cells, nanomaterials. |
| Nanoindentation | Reduced/Young's Modulus, Hardness | Depth: >50 nm, Lateral: µm-scale | Analysis of load-displacement curve (Oliver-Pharr method) during probe indentation. | Coatings, bulk polymers, bone tissue, micro-scale domains. |
| Dynamic Mechanical Analysis (DMA) | Storage/Loss Modulus (E', E''), Tan δ | Macroscopic sample (mm³) | Application of oscillatory stress/strain to measure viscoelastic response. | Bulk viscoelasticity, phase transitions, temperature sweeps. |
| Rheology | Shear Modulus (G', G''), Complex Viscosity | Macroscopic sample | Controlled shear stress/strain in rotational or oscillatory modes. | Soft materials, hydrogels, biopolymers, fluids. |
Experimental Protocols for Correlation
Protocol: Sample Preparation for Cross-Technique Validation
Objective: Ensure identical sample conditions for AFM-QNM and bulk testing.
- Material: Use a homogeneous, standardized polymer film (e.g., polydimethylsiloxane - PDMS of known stiffness, or polystyrene/polyethylene blend).
- Fabrication: Spin-coat or hot-press to create smooth, flat films (>1 µm thick) on rigid substrates (e.g., silicon wafer).
- Division: Precisely segment the sample into ≥3 identical coupons.
- Conditioning: Anneal to relieve internal stress, then equilibrate all coupons in a controlled environment (e.g., 23°C, 50% RH for 48 hours) to minimize environmental variance.
Protocol: Concurrent AFM-QNM and Nanoindentation Testing
Objective: Directly compare modulus values from nano- and micro-scale indentation.
- Instrument Calibration:
- AFM-QNM: Use a calibrated probe (e.g., Bruker RTESPA-300, k ~40 N/m) on a reference sample (e.g., polystyrene, E ≈ 2.5 GPa) to define the inverse optical lever sensitivity (InvOLS) and exact spring constant. Perform thermal tune for resonance frequency.
- Nanoindenter: Calibrate tip area function using fused silica. Set machine compliance.
- Spatial Registration: Deposit micro-indentation marks (using a low load) at the sample periphery. Perform QNM mapping over a large area (e.g., 50x50 µm) encompassing an unmarked region and locating the reference marks.
- Measurement Parameters:
- QNM: Set peak force frequency ≤1 kHz, peak force amplitude ≤100 pN to minimize plastic deformation. Acquire maps (e.g., 256x256 pixels) of DMT modulus.
- Nanoindentation: On a separate coupon, perform a grid (e.g., 5x5) of indents with a Berkovich tip. Use a strain rate-controlled loading profile. Hold at peak load (e.g., 500 µN) for 10s to account for creep. Use the Oliver-Pharr method for analysis.
- Data Analysis: Extract the average DMT modulus from the QNM map (excluding edge artifacts). Compare with the average reduced modulus from nanoindentation, applying contact mechanics model corrections (e.g., Sneddon for conical vs. spherical tip geometry differences).
Protocol: Correlating QNM with DMA for Viscoelastic Polymers
Objective: Relate nanoscale loss tangent (from AFM) to bulk tan δ (from DMA).
- Sample: Use a viscoelastic polymer with a known glass transition (Tg), e.g., polyurethane.
- Temperature-Controlled QNM: Use a heated/cooled AFM stage. At each temperature step (e.g., from -20°C to 80°C), allow thermal equilibration (30 min). Acquire QNM maps, recording both storage (E') and loss (E'') modulus via off-resonance force spectroscopy analysis. Calculate a local loss tangent (E''/E').
- DMA Measurement: Run a temperature sweep on a bulk sample coupon in tension or film tension mode at 1 Hz frequency and 0.1% strain.
- Correlation: Plot tan δ vs. Temperature from both techniques. The Tg and relative peak magnitudes should correlate, though absolute values may differ due to frequency and strain rate disparities (time-temperature superposition principles apply).
Data Presentation and Correlation Analysis
Table 2: Exemplar Correlation Data for PDMS Samples of Varying Cross-link Density
| Sample ID | Bulk DMA Storage Modulus E' at 1 Hz (MPa) | Nanoindentation Reduced Modulus Er (MPa) | AFM-QNM DMT Modulus (MPa) | QNM Adhesion Energy (aJ) |
|---|---|---|---|---|
| PDMS Low-Xlink | 0.52 ± 0.05 | 0.61 ± 0.12 | 0.58 ± 0.15 | 5.2 ± 1.1 |
| PDMS Med-Xlink | 1.98 ± 0.11 | 2.21 ± 0.23 | 2.05 ± 0.28 | 3.1 ± 0.8 |
| PDMS High-Xlink | 8.71 ± 0.34 | 9.05 ± 0.87 | 8.33 ± 0.91 | 1.5 ± 0.4 |
Note: Data is illustrative. Standard deviations represent spatial/material heterogeneity.
Workflow and Logical Diagrams
Diagram 1: Workflow for QNM-Bulk Property Correlation
Diagram 2: Diagnostic Pathway for Data Discrepancy Resolution
The Scientist's Toolkit: Key Research Reagent Solutions
Table 3: Essential Materials and Reagents for Validation Experiments
| Item Name | Function/Brief Explanation | Example Product/Catalog |
|---|---|---|
| Calibrated AFM Probes (QNM) | Cantilevers with known spring constant and sharp, defined tip geometry for quantitative force measurement. | Bruker RTESPA-300, ScanAsyst-Air, PFQNM-LC; BudgetSensors ContGB-G. |
| Modulus Reference Samples | Materials with certified, homogeneous elastic properties for AFM and nanoindenter calibration. | Bruker PFQNM-SMPK (Polystyrene, LDPE, PDMS, Acrylic); fused silica. |
| Standard Polymer Films | Homogeneous, smooth films of known bulk properties for cross-technique correlation studies. | Specialized PS/PEO blends, spin-coated PDMS (Sylgard 184), purchased PET films. |
| Viscous Reference Fluid | For calibrating AFM probe dynamic response and damping coefficients in liquid. | Poly(dimethylsiloxane) (PDMS) oil of known viscosity. |
| Sample Mounting Adhesive | To securely attach soft/flexible samples to substrate without affecting mechanical properties. | Double-sided carbon tape, quick-cure epoxy, cyanoacrylate (sparingly). |
| Environmental Control System | To maintain constant temperature/humidity during measurement, critical for polymers and biomaterials. | AFM environmental chamber, glove box, portable humidity controller. |
| Surface Cleaner/Plasma | To ensure sample surface is free of contaminants that affect adhesion and modulus measurements. | Oxygen plasma cleaner, UV/Ozone cleaner, HPLC-grade solvents. |
Within a broader thesis on Atomic Force Microscopy (AFM) for nanoscale surface imaging research, validating the morphology and structural integrity of soft nanoparticles like liposomes and Virus-Like Particles (VLPs) is a critical challenge. These nanostructures are central to modern drug delivery and vaccine platforms, where function is inextricably linked to form. AFM emerges as a premier, label-free technique providing three-dimensional topographical data under near-physiological conditions, offering distinct advantages over ensemble averaging techniques.
Core AFM Modalities for Nanoparticle Characterization
Different AFM modes provide complementary data for comprehensive particle validation.
Table 1: Key AFM Imaging Modes for Liposome/VLP Analysis
| Mode | Principle | Key Measurable Parameters | Optimal Use Case |
|---|---|---|---|
| Tapping/AC Mode | Intermittent tip-sample contact via oscillating cantilever. | Height, diameter, morphology, surface roughness. | Standard high-resolution imaging of adsorbed particles; preserves soft samples. |
| PeakForce Tapping | Measures force-separation curve at each pixel. | Young's modulus (nanomechanics), adhesion, deformation, topography. | Quantifying mechanical integrity and distinguishing intact from collapsed structures. |
| Force Spectroscopy | Records force vs. distance curve at a single point. | Elasticity/Young's modulus, breakthrough forces (for bilayer), adhesion forces. | Probing local mechanical properties and bilayer integrity of individual particles. |
Table 2: Quantitative AFM Morphological Data for Representative Formulations
| Particle Type | Mean Diameter (nm) by AFM | Mean Height (nm) by AFM | Apparent Young's Modulus (MPa) | Key Integrity Indicator |
|---|---|---|---|---|
| DOPC Liposome | 95 ± 12 | 15 ± 3 | 10 - 50 | Spherical cap shape; consistent bilayer height. |
| PEGylated Liposome | 110 ± 15 | 18 ± 4 | 8 - 40 | Uniform surface coating; reduced adhesion. |
| HIV-1 VLP | 125 ± 20 | 120 ± 18 | 100 - 300 | Intact spherical/core-shell structure. |
| HPV VLP | 55 ± 8 | 55 ± 8 | 200 - 500 | Monodisperse, icosahedral morphology. |
Detailed Experimental Protocols
Protocol 1: Sample Preparation for AFM Imaging of Liposomes/VLPs
Objective: To adsorb particles onto a substrate without deformation for reliable AFM analysis.
- Substrate Selection & Preparation: Use freshly cleaved mica (Grade V-1). For improved adsorption of lipid-based particles, treat mica with 10 µL of 1 mM NiCl₂ or MgCl₂ solution for 2 minutes, then rinse gently with ultrapure water and dry under nitrogen.
- Sample Deposition: Dilute the liposome/VLP stock solution in an appropriate buffer (e.g., HEPES, PBS) to a concentration of 0.01-0.1 mg/mL. Pipette 20-50 µL onto the pretreated mica surface.
- Incubation & Rinsing: Incubate for 5-15 minutes at room temperature. Gently rinse the surface with 2-3 mL of ultrapure water or imaging buffer to remove unbound particles and salt crystals. Carefully blot the edges with filter paper.
- Imaging Environment: For air imaging, dry the sample under a gentle stream of nitrogen. For liquid imaging, immediately mount the sample in the AFM liquid cell with the chosen buffer.
Protocol 2: AFM Imaging and Data Acquisition (PeakForce Tapping in Liquid)
Objective: To acquire high-resolution topography and quantitative nanomechanical maps.
- Cantilever Selection: Use sharp, silicon nitride cantilevers with a spring constant of ~0.1-0.7 N/m (e.g., Bruker SNL or ScanAsyst-Fluid+). Calibrate the spring constant via the thermal tune method.
- Engagement: Align the laser, engage in contact mode briefly, then switch to PeakForce Tapping mode.
- Parameter Optimization: Set a low scan rate (0.5-1.0 Hz). Adjust the PeakForce Setpoint to the minimum value sufficient for stable tracking (typically 50-500 pN). Set the PeakForce Frequency to 0.5-2 kHz.
- Data Collection: Scan areas of increasing magnification (e.g., from 10x10 µm to 500x500 nm). Collect both height and elastic modulus (DMT modulus) channels simultaneously.
Signaling Pathways and Workflow Visualization
AFM Workflow for Particle Integrity Assessment
Force Curve Analysis for Bilayer Integrity
The Scientist's Toolkit: Key Research Reagent Solutions
Table 3: Essential Materials for AFM-based Liposome/VLP Validation
| Item | Function/Description | Example Product/Chemical |
|---|---|---|
| Freshly Cleaved Mica | Atomically flat, negatively charged substrate for particle adsorption. | Muscovite Mica Discs, V-1 Grade. |
| Divalent Cation Solution | Improves adsorption of anionic lipids/particles to mica via charge bridging. | 1 mM NiCl₂ or MgCl₂ in ultrapure water. |
| AFM Cantilevers (Liquid) | Probes with low spring constant for gentle imaging of soft samples in fluid. | Bruker ScanAsyst-Fluid+, Olympus BL-AC40TS. |
| Calibration Standard | Verifies lateral and vertical scale accuracy of the AFM. | TGZ1/TGQ1 Grating, PS/LDPE Blend. |
| Ultrapure Water | For rinsing samples to prevent salt crystallization artifacts. | ≥18.2 MΩ·cm resistivity. |
| Imaging Buffer | Maintains particle native state during liquid-mode AFM. | 10 mM HEPES, 150 mM NaCl, pH 7.4. |
| Image Analysis Software | For particle counting, dimension, and roughness analysis. | Gwyddion, NanoScope Analysis, SPIP. |
Conclusion
Atomic Force Microscopy stands as an indispensable, versatile platform for nanoscale surface interrogation in biomedical research, uniquely capable of providing three-dimensional topography and quantitative nanomechanical data under physiological conditions. Mastering its foundational principles allows researchers to select appropriate methodologies, from high-resolution biomolecule imaging to single-cell force spectroscopy. Proactive troubleshooting and optimization are paramount for reliable data from delicate biological specimens. Crucially, validating AFM findings through correlative microscopy and robust statistical analysis ensures the translation of nanoscale observations into credible scientific insights. Future directions point toward increased automation, higher-speed imaging for dynamic processes, advanced multimodal integration, and the standardized application of AFM in quality control for nanomedicines and biomaterials, ultimately accelerating innovation in targeted drug delivery, regenerative medicine, and diagnostic technologies.