Atomic Force Microscopy in Protein Aggregation Studies: A Comprehensive Guide for Amyloid Fibril Research and Drug Discovery
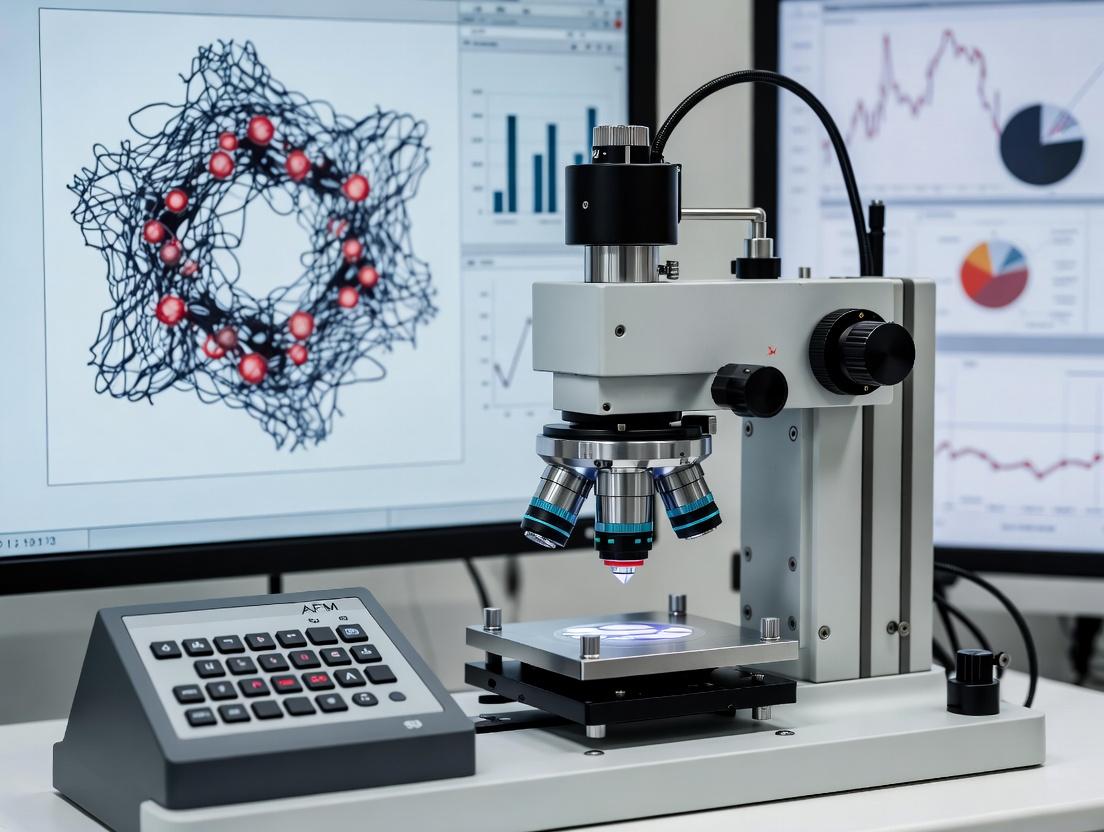
This article provides a detailed exploration of Atomic Force Microscopy (AFM) as an indispensable tool for studying protein aggregation and amyloid fibril formation.
Atomic Force Microscopy in Protein Aggregation Studies: A Comprehensive Guide for Amyloid Fibril Research and Drug Discovery
Abstract
This article provides a detailed exploration of Atomic Force Microscopy (AFM) as an indispensable tool for studying protein aggregation and amyloid fibril formation. Tailored for researchers, scientists, and drug development professionals, it covers foundational principles, advanced methodological applications for characterizing oligomers and mature fibrils, practical troubleshooting for sample preparation and imaging artifacts, and rigorous validation against complementary biophysical techniques. The guide synthesizes current best practices to enable high-resolution, quantitative analysis of aggregation kinetics, morphology, and mechanics, directly supporting therapeutic development for neurodegenerative diseases.
Understanding Protein Aggregation and Amyloid Fibrils: The Why and How of AFM Imaging
Protein misfolding diseases, or amyloidoses, are characterized by the aggregation of specific proteins into toxic soluble oligomers and insoluble amyloid fibrils. These diseases span localized neurodegenerative disorders to systemic conditions, sharing a common cross-β-sheet fibrillar structure. Atomic Force Microscopy (AFM) is pivotal for characterizing the morphological and nanomechanical properties of these aggregates at various stages of assembly.
Table 1: Key Protein Misfolding Diseases and Their Aggregating Proteins
| Disease Category | Disease Name | Aggregating Protein/Peptide | Primary Site of Pathology | Key Aggregate Morphology (via AFM) |
|---|---|---|---|---|
| Neurodegenerative | Alzheimer's Disease | Amyloid-β (Aβ), Tau | Brain, Neurons | Aβ: Protofibrils (2-5 nm height), Mature fibrils (6-10 nm height). Tau: Paired Helical Filaments. |
| Neurodegenerative | Parkinson's Disease | α-Synuclein | Brain, Lewy bodies | Pore-like oligomers, Mature fibrils (5-8 nm height). |
| Systemic | Systemic AL Amyloidosis | Immunoglobulin Light Chains | Kidney, Heart, Liver, Peripheral Nerves | Long, unbranched fibrils (7-12 nm height), varied lengths. |
| Systemic | ATTR Amyloidosis | Transthyretin (TTR) | Heart, Peripheral Nerves, GI Tract | Fragmented fibrils and bundles (8-14 nm height). |
| Localized | Type II Diabetes | Islet Amyloid Polypeptide (IAPP) | Pancreatic Islets | Short, curved fibrils (6-9 nm height). |
AFM Application Notes in Amyloid Research
Quantitative Morphological Analysis
AFM provides topographical imaging under near-physiological conditions, enabling real-time observation of aggregation kinetics.
Table 2: AFM-Derived Quantitative Parameters for Common Amyloidogenic Proteins
| Protein | Oligomer Height (nm) Mean ± SD | Mature Fibril Height (nm) Mean ± SD | Typical Fibril Persistence Length (nm) | Aggregation Lag Time (hr, in vitro) |
|---|---|---|---|---|
| Aβ42 | 1.5 - 4.0 | 6.0 - 10.0 | 100 - 1000 | 5 - 15 |
| α-Synuclein | 2.0 - 5.0 | 5.0 - 8.0 | 500 - 1500 | 20 - 50 |
| IAPP | 2.5 - 4.5 | 6.0 - 9.0 | 200 - 800 | 2 - 10 |
| TTR (mutant) | 3.0 - 6.0 | 8.0 - 14.0 | 1000 - 3000 | 50 - 100 |
Nanomechanical Property Mapping
PeakForce Quantitative Nanomechanical Mapping (PF-QNM) allows simultaneous mapping of modulus (stiffness), adhesion, and deformation.
Table 3: Nanomechanical Properties of Amyloid Structures (PF-QNM AFM)
| Aggregate State (Protein) | Reduced Young's Modulus (MPa) | Relative Adhesion Force | Deformation (nm) |
|---|---|---|---|
| Aβ42 Oligomers | 500 - 1500 | High | 0.5 - 2.0 |
| Aβ42 Mature Fibrils | 2000 - 4000 | Low | 0.2 - 1.0 |
| α-Synuclein Fibrils | 1500 - 3000 | Medium | 0.3 - 1.2 |
| Serum AL LC Fibrils | 1800 - 3500 | Low-Medium | 0.3 - 1.5 |
Detailed Experimental Protocols
Protocol 1: AFM Sample Preparation forIn VitroAggregates
Objective: To immobilize protein aggregates for AFM imaging in fluid. Materials: See "The Scientist's Toolkit" below. Procedure:
- Substrate Preparation: Cleave a 10mm x 10mm piece of fresh muscovite mica using adhesive tape. Immediately place it on a magnetic AFM disk.
- Surface Functionalization (Optional for enhanced immobilization): Pipette 50 µL of 0.01% poly-L-lysine (PLL) onto the mica. Incubate for 5 minutes. Rinse thoroughly with 2 mL of filtered, deionized water (dH₂O). Dry under a gentle stream of argon or nitrogen.
- Sample Adsorption: Dilute the aggregated protein sample in the relevant buffer (e.g., 20 mM HEPES, pH 7.4) to a concentration of 0.01 - 0.1 mg/mL. Pipette 30-50 µL onto the prepared mica surface.
- Incubation: Allow adsorption for 5-10 minutes at room temperature.
- Rinsing: Gently rinse the surface with 2 mL of the imaging buffer (identical to the sample buffer to prevent conformational changes) to remove loosely bound material.
- Imaging: Immediately place the disk in the AFM liquid cell. Add 100 µL of imaging buffer to prevent dehydration. Proceed with tapping mode or PeakForce Tapping in fluid.
Protocol 2:Ex VivoTissue Amyloid Extraction and AFM Imaging
Objective: To isolate and image amyloid fibrils from post-mortem tissue or clinical biopsies. Procedure:
- Homogenization: Weigh 50-100 mg of tissue. Homogenize in 1 mL of cold phosphate-buffered saline (PBS) containing protease inhibitors using a Dounce homogenizer (10-15 strokes).
- Low-Speed Centrifugation: Centrifuge at 5,000 x g for 10 minutes at 4°C to remove cellular debris. Transfer supernatant to a new tube.
- Fibril Enrichment: Centrifuge the supernatant at 100,000 x g for 1 hour at 4°C. The pellet contains enriched amyloid fibrils and other insoluble material.
- Washing: Resuspend the pellet in 1 mL of cold PBS and repeat the ultracentrifugation step.
- Resuspension: Gently resuspend the final pellet in 50-100 µL of PBS or ammonium bicarbonate buffer (pH 8.0). Mild sonication in a water bath for 30 seconds can disperse aggregates.
- Sample Preparation for AFM: Follow steps 1-6 of Protocol 1, using the resuspended fibril solution.
Protocol 3: Real-Time AFM Kinetics of Fibril Growth
Objective: To monitor the elongation of single amyloid fibrils over time. Procedure:
- Seed Preparation: Generate short fibril "seeds" by sonicating pre-formed mature fibrils (from Protocol 1) in a bath sonicator for 1 hour with 1-second on/off pulses.
- Surface Immobilization: Immobilize seeds on PLL-functionalized mica as in Protocol 1, Step 3, using the seed solution.
- Initiate Growth: In the AFM liquid cell, after initial imaging of seeds, carefully inject a solution of monomeric protein (at a concentration below the critical concentration for de novo nucleation, e.g., 2-5 µM for Aβ42) in imaging buffer.
- Time-Lapse Imaging: Set the AFM to repeatedly scan the same area (e.g., 2 µm x 2 µm) over 1-4 hours using a high-speed imaging mode. Maintain temperature control at 37°C if required.
- Analysis: Use particle analysis software to measure fibril length from time-series images to calculate growth rates.
Diagrams
Title: Amyloid Aggregation Pathway and AFM Analysis Points
Title: AFM Workflow for Amyloid Characterization
The Scientist's Toolkit: Research Reagent Solutions
Table 4: Essential Materials for AFM-Based Amyloid Research
| Item | Function/Description | Example Vendor/Product |
|---|---|---|
| Recombinant Amyloidogenic Proteins (Aβ42, α-Syn, IAPP) | High-purity, lyophilized monomer for controlled in vitro aggregation studies. | rPeptide (Aβ42-1), Abcam (recombinant α-Synuclein). |
| Muscovite Mica Discs (V1 Grade) | Atomically flat, negatively charged substrate for sample adsorption. | Ted Pella, Inc. (Product #50). |
| Poly-L-Lysine (PLL) Solution (0.01% w/v) | Cationic polymer for coating mica to enhance electrostatic immobilization of aggregates. | Sigma-Aldrich (P8920). |
| AFM Probes for Fluid Imaging | Silicon nitride cantilevers with sharp tips for tapping mode in liquid. | Bruker (SNL-10, k~0.06-0.35 N/m). |
| AFM Probes for PF-QNM | Cantilevers with well-defined spring constant and sharp tips for nanomechanical mapping. | Bruker (ScanAsyst-Fluid+, k~0.7 N/m). |
| Amyloid Dye (Thioflavin T) | Fluorescent dye for validating amyloid formation via fluorescence assays. | Sigma-Aldrich (T3516). |
| Size-Exclusion Chromatography (SEC) Columns | For isolating monomeric protein from pre-formed oligomers and aggregates prior to kinetics studies. | Cytiva (Superdex 75 Increase 10/300 GL). |
| Protease Inhibitor Cocktail (Tablets) | Essential for ex vivo tissue work to prevent fibril degradation during extraction. | Roche (cOmplete, EDTA-free). |
| Ultrafiltration Devices (e.g., 10 kDa cutoff) | For buffer exchange and protein concentration. | Amicon Ultra centrifugal filters (Merck). |
| Certified AFM Calibration Grating | For precise calibration of the AFM scanner in X, Y, and Z dimensions. | Bruker (TGXYZ01) or NT-MDT (TGQ1). |
Within the context of atomic force microscopy (AFM) research for protein aggregation, understanding the amyloid aggregation pathway is fundamental. This pathway describes the conformational transition of soluble, native proteins or peptides into highly ordered, insoluble cross-β-sheet-rich fibrils. The process is not linear but involves a complex free energy landscape with multiple intermediate states, each with distinct structural and cytotoxic properties. AFM is uniquely positioned to characterize the morphology, dimensions, and mechanical properties of each species along this pathway in near-native conditions, providing critical insights for neurodegenerative disease research and therapeutic development.
The Aggregation Pathway: Species Characterization
The progression from monomer to mature fibril involves distinct quaternary structures, each identifiable by AFM and other biophysical techniques.
Table 1: Key Species in the Amyloid Aggregation Pathway
| Species | Typical Size (Height/Diameter) | Key Structural Features | Pathological Significance | Primary AFM Characterization Mode |
|---|---|---|---|---|
| Native Monomer | 1-3 nm | Soluble, disordered or globular. | Non-toxic, functional state. | Imaging in liquid; force spectroscopy for stability. |
| Soluble Oligomers | 2-6 nm height, < 100 nm length | Spherical, annular, or chain-like; limited β-sheet. | Considered most cytotoxic; membrane disruption. | Tapping mode in liquid; morphology distribution analysis. |
| Protofibrils | 3-5 nm height, 50-200 nm length | Linear, flexible, beaded chains; intermediate β-sheet. | Transient, potentially toxic intermediates. | Time-lapse imaging to track growth; contour length analysis. |
| Mature Fibrils | 5-12 nm height, μm scale length | Rigid, unbranched, twisted or straight; extensive cross-β core. | Disease hallmarks; may be protective by sequestering oligomers. | High-resolution imaging; transverse/vertical stiffness measurement. |
| Fibril Networks | > 1 μm, variable | Entangled mesh of mature fibrils. | Contributes to plaque formation and tissue rigidity. | Large-area scans; network porosity analysis. |
Key Protocols for AFM-Based Analysis
The following protocols are central to investigating the amyloid aggregation pathway using AFM.
Protocol 3.1: Sample Preparation for Time-Course AFM Imaging
Objective: To immobilize aggregating protein species at various time points for AFM topographic analysis. Materials: Freshly prepared protein/peptide (e.g., Aβ42, α-synuclein) in aggregation buffer (e.g., PBS, 20 mM HEPES), freshly cleaved mica (Muscovite, V1 grade), AFM liquid cell. Procedure:
- Substrate Functionalization: Prepare 0.1% (w/v) poly-L-lysine (PLL) solution. Apply 20 µL to a freshly cleaved mica disk for 5 minutes. Rinse gently with ultrapure water (3x) and dry under a gentle nitrogen stream.
- Sample Adsorption: At defined time points (t=0, 2h, 8h, 24h, 48h) during the aggregation reaction, withdraw a 10-20 µL aliquot. Dilute if necessary to minimize overcrowding (final concentration ~0.1-1 µM). Apply to the PLL-coated mica for 2 minutes.
- Washing: Gently rinse with 1 mL of the corresponding buffer (without protein) to remove loosely bound material.
- Imaging: Immediately mount the substrate in the AFM liquid cell filled with buffer. Perform imaging in tapping (AC) mode using ultra-sharp silicon nitride probes (nominal spring constant ~0.1 N/m, resonant frequency ~10 kHz in liquid).
Protocol 3.2: In-Situ AFM Monitoring of Fibril Elongation
Objective: To visualize the real-time growth kinetics of individual protofibrils/fibrils. Materials: Pre-formed, sonicated fibril seeds, monomeric protein solution, temperature-controlled AFM stage, soft cantilevers (k ~0.03 N/m). Procedure:
- Seed Immobilization: Adsorb sonicated fibril fragments (0.5-2 µM) onto mica as in Protocol 3.1, Step 2.
- In-Situ Reaction Setup: After washing, fill the liquid cell with degassed aggregation buffer. Engage the AFM tip and locate a suitable field with isolated seeds.
- Initiate Elongation: Using a micro-syringe pump connected to the liquid cell inlet, slowly exchange the buffer with a solution containing monomeric protein (e.g., 5-10 µM). Ensure minimal fluid disturbance.
- Time-Lapse Imaging: Acquire sequential images (e.g., 500 nm x 500 nm) of the same area every 2-5 minutes for 1-2 hours. Maintain constant temperature.
- Data Analysis: Use image analysis software to track the length increase of individual fibril ends over time to calculate elongation rates.
Protocol 3.3: Nanomechanical Mapping of Aggregation Intermediates
Objective: To measure the relative stiffness (Young's modulus) of different species along the pathway. Materials: Samples prepared per Protocol 3.1, AFM probes for force spectroscopy (silicon, nominal k ~0.5 N/m, tip radius < 10 nm). Procedure:
- Force Volume/PeakForce QNM Setup: Configure the AFM to acquire force-distance curves on a defined grid (e.g., 128x128 points over a 1 µm area).
- Calibration: Precisely calibrate the cantilever sensitivity and spring constant using the thermal tune method. Determine the tip radius using a characterized sample (e.g., gratings).
- Measurement: On the sample grid, acquire force curves at a controlled loading rate (e.g., 0.5-1 kHz). Apply an appropriate mechanical model (e.g., Hertz/Sneddon model for elastic deformation) to fit the retraction curve.
- Segmentation & Analysis: Correlate topographic height images with stiffness maps. Manually segment regions corresponding to oligomers, protofibrils, and mature fibrils based on morphology. Compare the derived Young's modulus distributions for each species.
Visualizing the Pathway and Workflow
Diagram 1: Amyloid Aggregation Pathway Dynamics
Diagram 2: AFM Workflow for Aggregation Time-Course
The Scientist's Toolkit: Research Reagent Solutions
Table 2: Essential Materials for AFM Amyloid Aggregation Studies
| Item | Function & Rationale | Example Product/Specification |
|---|---|---|
| Ultra-Pure Recombinant Protein | Ensures aggregation studies start from defined, monomeric states without pre-formed seeds. | Lyophilized Aβ42, α-synuclein (rPeptide, Hello Bio). Store at -80°C. |
| Hexafluoroisopropanol (HFIP) | Pre-treatment solvent to disrupt pre-existing aggregates and obtain pure monomer starting solutions. | Sigma-Aldrich, ≥99.5% purity. Use in fume hood. |
| Freshly Cleaved Mica | Atomically flat, negatively charged substrate for sample adsorption. Essential for high-resolution imaging. | Muscovite Mica V1, 15mm discs (Ted Pella, Inc.). |
| Poly-L-Lysine (PLL) | Cationic polymer for coating mica to enhance electrostatic adsorption of protein species. | 0.1% w/v aqueous solution, MW 70-150 kDa (Sigma-Aldrich). |
| AFM Probes for Liquid Imaging | Sharp, soft cantilevers minimize sample disturbance and provide high resolution. | Bruker ScanAsyst-Fluid+ or Olympus BL-AC40TS. |
| Temperature-Controlled Stage | Maintains physiological or defined temperature during in-situ experiments, critical for kinetic studies. | Bruker BioHeater, JPK NanoWizard BioAFM stage. |
| Force Calibration Sample | Reference sample for accurate tip radius and cantilever spring constant calibration. | Bruker PFQNM-LC-Cal, or TGQZ1 grid (NT-MDT). |
| Aggregation Buffer Salts | Provides physiologically relevant ionic strength and pH. Must be filtered (0.02 µm) to remove particulates. | PBS, HEPES, NaCl, filtered through Anotop 10 syringe filters. |
Why Atomic Force Microscopy? Unique Advantages for Nanoscale Biophysics.
Application Notes
Atomic Force Microscopy (AFM) is a cornerstone technique for the study of protein aggregation and amyloid fibril formation, offering capabilities unmatched by bulk or ensemble-averaging methods. Within the context of amyloid research, AFM provides direct, label-free, and quantitative insights into the nanoscale structural and mechanical properties of aggregation intermediates and mature fibrils under physiologically relevant conditions.
Key Advantages for Amyloid Biophysics:
- Native-State Imaging: AFM operates in liquid, allowing real-time observation of aggregation kinetics—from oligomer formation to protofibril elongation and mature fibril assembly—without the need for staining, freezing, or vacuum.
- Single-Molecule Resolution: It provides topographical images with sub-nanometer vertical resolution, enabling the measurement of fibril heights, periodicities (e.g., the classic ~10 nm twist for Aβ42 fibrils), and oligomer diameters.
- Quantitative Nanomechanics: Force spectroscopy modes (e.g., Force Volume, PeakForce QI) map local mechanical properties such as Young's modulus, adhesion, and deformation. This is critical for correlating structural states with putative toxicity, as small, rigid oligomers are often implicated in membrane disruption.
- Dynamic Functional Analysis: AFM can be combined with fluidic systems to monitor the real-time impact of changes in pH, ionic strength, or the introduction of potential therapeutic inhibitors on aggregation pathways.
Recent Data Highlights: Recent studies leveraging high-speed AFM and advanced force spectroscopy have quantitatively delineated the mechanical stability and assembly dynamics of amyloid species. The following table summarizes key quantitative findings relevant to drug discovery efforts.
Table 1: Quantitative AFM Characterization of Amyloid-β (Aβ) Aggregates
| Aggregate Species | Mean Height (nm) | Mean Length (nm) | Young's Modulus (MPa) | Key Observation |
|---|---|---|---|---|
| Aβ42 Oligomers | 2.1 ± 0.5 | 10-30 | 1200 ± 300 | Spherical/globular structures; high rigidity correlates with membrane poration potential. |
| Aβ42 Protofibrils | 3.5 ± 0.7 | 50-200 | 500 ± 150 | Flexible, curvilinear intermediates; growth kinetics modulated by inhibitors. |
| Mature Aβ42 Fibrils | 8.5 ± 1.2 | >1000 | 2000 ± 500 | Characteristic twisted morphology with ~22 nm periodicity; high mechanical stability. |
| Aβ40 Fibrils | 6.8 ± 0.9 | >1000 | 1800 ± 400 | Often display distinct morphology and lower twist periodicity (~25 nm) vs. Aβ42. |
Experimental Protocols
Protocol 1: In-Situ AFM Imaging of Amyloid Fibril Formation Kinetics
Objective: To visualize the real-time assembly of amyloidogenic peptides (e.g., Aβ40, α-synuclein) into fibrils under physiological buffer conditions.
Materials: See "The Scientist's Toolkit" below. Method:
- Substrate Preparation: Cleave a fresh sheet of Muscovite mica (Ø 10 mm) using adhesive tape. Immediately mount it on the AFM specimen disc using a double-sided adhesive.
- Peptide Solution Preparation: Monomeric peptide is prepared via size-exclusion chromatography or HPLC. Lyophilized peptide is dissolved in a strong denaturant (e.g., hexafluoroisopropanol), aliquoted, dried, and then stored at -80°C. For experiment, an aliquot is dissolved in cold DMSO to 1 mM, then diluted into pre-chilled, filtered (0.02 µm) imaging buffer (e.g., 20 mM HEPES, 150 mM NaCl, pH 7.4) to a final concentration of 10-50 µM. Vortex gently for 5-10 seconds.
- Sample Deposition & Incubation: Pipette 40-60 µL of the peptide solution onto the freshly cleaved mica. Allow to incubate in a humid chamber at the desired temperature (e.g., 37°C) for a defined nucleation period (e.g., 0-2 hours).
- AFM Liquid Cell Assembly: Carefully place the sample onto the AFM scanner. Install the liquid cell and O-ring. Gently fill the cell with ~200 µL of the same imaging buffer, ensuring no air bubbles are trapped.
- Imaging Parameters: Engage a sharp, nitride lever cantilever (k ~ 0.1 N/m, f₀ ~ 7 kHz in fluid). Use AC mode (or PeakForce Tapping in fluid). Set a low scanning force (<100 pN). Scan size: 2-5 µm initially to locate structures, then zoom to 1x1 µm or 500x500 nm areas. Resolution: 512x512 pixels. Scan rate: 1-2 Hz.
- Kinetic Time-Series: Program the AFM software to return to the same XY coordinates repeatedly. Acquire an image every 10-15 minutes over 4-24 hours. Maintain temperature control.
- Data Analysis: Use AFM software to perform plane fitting and flattening. Measure fibril heights (from cross-sectional profiles), lengths, and densities over time to derive growth rates and nucleation events.
Workflow Diagram:
Title: Workflow for In-Situ AFM Imaging of Amyloid Kinetics
Protocol 2: PeakForce QI Nanomechanical Mapping of Oligomers and Fibrils
Objective: To quantitatively map the elastic modulus and adhesion of individual amyloid aggregates at high spatial resolution.
Materials: See "The Scientist's Toolkit" below. Method:
- Sample Preparation: Prepare amyloid samples as in Protocol 1, step 2, but deposit a lower concentration (1-5 µM) and incubate for a shorter time (30-60 min) to achieve a sparse distribution of aggregates for single-particle analysis. Rinse gently with imaging buffer to remove loosely adsorbed material.
- Cantilever Selection & Calibration: Use a sharp, silicon tip on a nitride lever with a known spring constant (k ~ 0.2-0.4 N/m). Perform thermal tune calibration in fluid to determine the exact spring constant and the optical lever sensitivity.
- Parameter Optimization: Set the PeakForce frequency to 1-2 kHz. Adjust the PeakForce amplitude (50-150 nm) to achieve a maximum applied force (setpoint) of 200-500 pN. This ensures sufficient signal-to-noise while minimizing sample deformation.
- Scan Acquisition: Engage the tip in PeakForce QI mode. Select a scan area (500x500 nm to 2x2 µm) containing structures of interest. Set resolution to 128x128 or 256x256 pixels per scan. Enable simultaneous capture of height, Young's modulus (Derjaguin–Muller–Toporov (DMT) model), adhesion, and deformation channels.
- Reference Measurement: Perform an identical mapping on a clean, bare mica area in buffer to define the baseline mechanical properties of the substrate.
- Data Processing: Use the AFM analysis software. Apply a plane fit to height data. For modulus maps, use the DMT model fitting, inputting the tip radius (from SEM or calibration grating) and Poisson's ratio assumption for the sample (typically 0.3-0.5). Segment individual aggregates using the height channel and extract average modulus and adhesion values.
- Statistical Analysis: Plot frequency distributions of modulus for different structural classes (oligomers vs. fibrils). Perform t-tests or ANOVA to establish significance.
Pathway to Data Interpretation:
Title: Nanomechanical Data Analysis Pathway
The Scientist's Toolkit: Essential Research Reagents & Materials
Table 2: Key Reagents and Materials for AFM-based Amyloid Research
| Item | Function & Rationale |
|---|---|
| Ultrapure, HPLC-grade Peptides (Aβ, α-synuclein, etc.) | Ensures defined initial monomeric state, critical for reproducible aggregation kinetics. |
| Muscovite Mica Discs (V1 Grade, 10-15mm) | Provides an atomically flat, negatively charged, clean surface for adsorbing protein aggregates. |
| HEPES or Phosphate Buffered Saline (PBS) | Maintains physiological pH and ionic strength during in-situ imaging and aggregation. |
| Ultrafiltration Units (10 kDa MWCO) | For buffer exchange and removal of pre-existing aggregates from monomer stocks. |
| Sharp Nitride Lever AFM Probes (e.g., SNL, ScanAsyst-Fluid+) | Tips with consistent geometry and coating for high-resolution imaging and reliable nanomechanics in fluid. |
| Temperature-Controlled AFM Stage | Enables studies of temperature-dependent aggregation, mimicking physiological or pathological conditions. |
| Fluidic Cell with Bubble-Trap | Allows for buffer exchange during imaging, facilitating inhibitor addition studies. |
| AFM Calibration Gratings (e.g., TGZ1, PSP) | For verifying the scanner's XYZ calibration and tip morphology characterization. |
Within the broader thesis investigating protein aggregation and amyloid fibril formation, Atomic Force Microscopy (AFM) serves as a pivotal tool for nanoscale structural and mechanical characterization. Selecting the appropriate imaging mode is critical to obtain high-fidelity data without altering or damaging these delicate, often heterogeneous, biological structures. This document details the core AFM modes—Contact, Tapping, and PeakForce Tapping—providing application notes and protocols optimized for studying soft biological samples like proteins, aggregates, and fibrils.
Core AFM Modes: Principles and Comparative Analysis
Each mode employs distinct tip-sample interaction mechanics, leading to differing resolutions, force application, and suitability for soft samples.
Table 1: Comparative Analysis of Core AFM Imaging Modes for Biological Samples
| Feature | Contact Mode | Tapping Mode | PeakForce Tapping Mode |
|---|---|---|---|
| Tip-Sample Interaction | Continuous physical contact. | Intermittent contact; tip oscillates at resonance. | Ultra-fast, periodic tapping (<1kHz) with precise force control. |
| Lateral Forces | High, due to dragging. | Negligible, vertical oscillation minimizes shear. | Negligible, similar to Tapping. |
| Applied Force Control | Difficult; constant deflection or force. | Controlled via amplitude setpoint. | Direct, quantitative control of peak force (pN to nN). |
| Imaging Resolution | High on flat, hard samples. | High on rough, soft samples. | Highest on soft, adhesive samples. |
| Sample Damage Risk | Very High for soft, loosely adhered samples. | Moderate to Low. | Very Low; forces minimized and controlled. |
| Simultaneous Data Channels | Topography mainly. | Topography, Phase (material contrast). | Topography, DMT Modulus, Adhesion, Deformation, Dissipation. |
| Optimal for Protein/Fibril Studies | Not recommended for isolated, soft fibrils. | Good for adsorbed fibril networks on mica. | Excellent for high-resolution, multi-parameter mapping of fragile aggregates. |
Detailed Experimental Protocols
Protocol 3.1: Substrate Preparation (Mica) for Protein/Fibril Immobilization
Objective: Create a clean, flat, negatively charged surface for adsorbing protein samples. Materials: Freshly cleaved muscovite mica discs (10-15mm diameter), Scotch tape, UV/Ozone cleaner or plasma cleaner. Procedure:
- Cleaving: Using Scotch tape, firmly adhere to both sides of a mica sheet. Pull tape apart to cleave layers, exposing a fresh, atomically flat surface.
- Cleaning: Immediately place cleaved mica disc in a UV/Ozone cleaner for 20 minutes or a plasma cleaner (air plasma, low power) for 1-2 minutes to remove organic contaminants and enhance hydrophilicity.
- Storage: Use immediately for sample deposition. Do not touch the surface.
Protocol 3.2: Sample Deposition of Amyloid Fibrils
Objective: Adsorb fibrils onto mica at an appropriate density for AFM imaging. Materials: Purified amyloid fibril suspension (e.g., Aβ42, α-synuclein, insulin), prepared mica, 10-100 µL pipette, buffer solution (e.g., PBS or Tris-HCl, pH 7.4), nitrogen or argon gas. Procedure:
- Deposition: Pipette 10-40 µL of fibril suspension (typical concentration 0.01-0.1 mg/mL) onto the center of the prepared mica surface.
- Incubation: Allow the sample to adsorb for 5-15 minutes at room temperature in a humid chamber to prevent drying.
- Rinsing: Gently rinse the surface with 3-5 mL of filtered (0.02 µm) Milli-Q water or imaging buffer to remove unbound protein and salts. Note: For contact mode in liquid, use imaging buffer instead of water.
- Drying: Gently dry the sample under a weak stream of inert gas (N₂ or Ar). Allow to air-dry for 5 minutes before loading into AFM.
Protocol 3.3: Imaging in PeakForce Tapping Mode (Optimal for Fibrils)
Objective: Acquire high-resolution topography and nanomechanical maps of amyloid fibrils. Materials: AFM with PeakForce Tapping capability (e.g., Bruker BioScope Resolve), SNL or SCANASYST-FLUID+ probes (triangular cantilever, nominal k=0.7 N/m, tip radius 2 nm), prepared sample. Procedure:
- Probe Calibration: Perform thermal tune method in air/liquid to determine the exact spring constant (k) and deflection sensitivity.
- Mounting: Mount the probe and load the dried sample onto the magnetic stage. For liquid imaging, engage in a droplet of appropriate buffer first.
- Engagement Parameters: Set initial Scan Size to 0, PeakForce Frequency to 1-2 kHz, and PeakForce Setpoint to a high value (e.g., 10 nM).
- Engage: Initiate engagement. Once engaged, reduce the PeakForce Setpoint to the minimum possible value while maintaining stable imaging (typically 50-200 pN for fibrils).
- Imaging Optimization: For a 5x5 µm scan area, set Scan Rate to 0.5-1.0 Hz. Adjust gains for stable feedback. Enable simultaneous capture of PeakForce Error, DMT Modulus, and Adhesion channels.
- Data Acquisition: Collect images at 512x512 or 1024x1024 resolution. Capture multiple fibrils and aggregates to ensure statistical relevance for thesis analysis.
The Scientist's Toolkit: Essential Research Reagents & Materials
Table 2: Key Research Reagent Solutions for AFM of Protein Aggregates
| Item | Function & Relevance |
|---|---|
| Freshly Cleaved Muscovite Mica | Provides an atomically flat, negatively charged substrate for uniform protein adsorption essential for high-resolution imaging. |
| UV/Ozone Cleaner | Removes organic contaminants from substrates and AFM probes, critical for reproducible sample adhesion and minimizing background noise. |
| SNL or SCANASYST-FLUID+ Probes (Bruker) | Sharp, silicon nitride probes with low spring constants designed specifically for high-resolution, low-force imaging of biological samples in air and fluid. |
| Filtered Buffer (PBS, Tris, etc., 0.02 µm filtered) | Provides a physiological environment for liquid imaging, prevents salt crystallization upon drying, and removes particulates that can contaminate the tip. |
| Nitrogen Gas (High Purity, Dry) | Used for gentle, spot-free drying of samples prepared for air imaging, preventing aggregation artifacts from buffer salts. |
| PeakForce Tapping Calibration Kit | Contains standardized polystyrene samples for verifying probe geometry and force calibration, ensuring quantitative nanomechanical data. |
Visualization of AFM Mode Selection Logic
Diagram Title: Decision Logic for Selecting AFM Imaging Mode on Soft Samples
Visualization of Integrated AFM Workflow for Amyloid Fibril Analysis
Diagram Title: Integrated AFM Workflow for Amyloid Fibril Characterization
Within the study of protein aggregation and amyloid fibril formation, Atomic Force Microscopy (AFM) is an indispensable tool for nanostructural and nanomechanical characterization. This application note details the critical parameters—height, morphology, surface roughness, and mechanical properties—that AFM quantifies, providing direct insights into aggregation kinetics, fibril polymorphism, and the effects of potential therapeutic inhibitors.
Key Parameters & Quantitative Insights
The following table summarizes the core AFM-measured parameters and their significance in amyloid research.
Table 1: Key AFM Parameters for Protein Aggregation Studies
| Parameter | Typical Measurement Mode | Significance in Amyloid Research | Example Quantitative Range for Amyloid-β (1-42) Fibrils |
|---|---|---|---|
| Height | Tapping/Contact Mode | Measures fibril diameter; indicates protofilament number and packing. | 2-10 nm (single fibrils); 4-12 nm (mature fibrils) |
| Morphology | Tapping Mode (Phase Imaging) | Reveals fibril length, twist periodicity, heterogeneity, and oligomer presence. | Length: 0.1 - >10 μm; Periodicity: 20-100 nm |
| Roughness (Rq/Ra) | Tapping/Contact Mode | Quantifies surface topology of aggregates or films; indicator of aggregation state uniformity. | Ra: 0.2-0.5 nm (monomeric film); 1.5-4.0 nm (fibrillar network) |
| Elastic Modulus | Force Spectroscopy/PeakForce QNM | Measures mechanical stiffness; relates to fibril stability and cross-β sheet density. | 1-5 GPa (dry); 0.1-2 GPa (in fluid) |
| Adhesion Force | Force Spectroscopy/PeakForce QNM | Probes surface chemistry & hydrophobicity; changes with aggregate surface exposure. | 0.1-2 nN (varies with tip chemistry and hydration) |
Detailed Experimental Protocols
Protocol 1: Sample Preparation for Amyloid Fibril Imaging
Objective: To immobilize protein aggregates reliably onto a substrate for high-resolution AFM. Materials: See "The Scientist's Toolkit" below. Procedure:
- Substrate Cleansing: Sonicate freshly cleaved mica discs in acetone for 5 minutes, followed by UV/Ozone treatment for 20 minutes.
- Sample Adsorption: Pipette 20-40 µL of diluted amyloid fibril suspension (0.01-0.1 mg/mL in desired buffer, e.g., PBS or ammonium bicarbonate) onto the mica surface.
- Incubation: Allow adsorption for 2-10 minutes (time optimization required for different proteins).
- Rinsing & Drying: Gently rinse the surface with 2 mL of ultrapure water (or filtered buffer for liquid imaging) to remove loosely bound species. Carefully dry under a gentle stream of nitrogen or argon.
- Storage: Use immediately or store in a desiccator for short-term (<24h) storage before imaging.
Protocol 2: Multi-Parameter AFM Imaging & Analysis
Objective: To simultaneously acquire height, morphology, and nanomechanical data. Procedure:
- Microscope Setup: Mount prepared sample. For ambient imaging, use a silicon cantilever (k ~ 20-80 N/m, f0 ~ 300 kHz). For liquid, use a softer cantilever (k ~ 0.1-1 N/m).
- Tapping Mode Imaging: Engage and optimize drive frequency and amplitude setpoint. Scan areas from 10x10 µm down to 500x500 nm at a resolution of 512x512 pixels.
- Roughness Analysis: On a flattened height image, select a representative region (excluding large aggregates for substrate roughness). Use the instrument software to calculate the Root Mean Square (Rq) and Average (Ra) roughness.
- Force Spectroscopy Mapping: Switch to PeakForce QNM or analogous mode. Calibrate the deflection sensitivity and spring constant. Set a peak force amplitude of 10-50 pN to minimize sample disturbance. Acquire a map (e.g., 128x128 points over a 1x1 µm area).
- Data Processing: Use the analysis software to generate modulus (DMT or Sneddon model) and adhesion maps. Correlate these maps with the simultaneously acquired height topography.
Workflow Diagram
Title: AFM Workflow for Amyloid Fibril Characterization
The Scientist's Toolkit
Table 2: Essential Research Reagent Solutions for AFM-based Amyloid Studies
| Item | Function & Relevance |
|---|---|
| Freshly Cleaved Mica Discs | Atomically flat, negatively charged substrate for uniform adsorption of protein aggregates. |
| Silicon Cantilevers (Tapping Mode) | High-frequency probes for high-resolution topography and phase imaging in air. |
| Silicon Nitride Cantilevers (Liquid/FSC) | Softer probes with low spring constants for force spectroscopy and imaging in fluid. |
| PBS or Tris Buffer (Ultrafiltered) | Provides physiological or controlled chemical environment for in-situ liquid imaging. |
| Ammonium Bicarbonate Solution (10-50 mM) | Common volatile buffer for sample prep, easily removed by drying without salt crystals. |
| Nitrocellulose or APTES | Surface functionalizers to enhance adsorption of specific aggregate species. |
| Calibration Gratings (TGZ & HS Series) | Essential for verifying scanner accuracy in X, Y, and Z dimensions. |
| Nanomechanical Standard (PDMS) | A reference sample with known modulus for validating quantitative force spectroscopy data. |
The systematic application of these protocols, focusing on the key parameters of height, morphology, roughness, and mechanical properties, enables researchers to build a comprehensive nanostructural and nanomechanical profile of protein aggregates. This data is critical for elucidating aggregation mechanisms, characterizing fibril polymorphs, and quantitatively assessing the efficacy of drug candidates in destabilizing pathogenic amyloid structures.
Step-by-Step AFM Protocols: From Sample Preparation to Quantitative Fibril Analysis
Application Notes
Within Atomic Force Microscopy (AFM) studies of protein aggregation and amyloid fibril formation, substrate choice and modification are critical experimental variables. They dictate protein adsorption, distribution, and structural integrity, directly influencing data reliability and biological relevance. This guide details the properties and functionalization strategies for three pivotal substrates.
1. Muscovite Mica: A potassium aluminosilicate mineral cleaved to produce atomically flat, negatively charged surfaces ideal for high-resolution imaging. Its charge promotes electrostatic adsorption of positively charged proteins or fibrils but can be non-specific. It is the substrate of choice for many globular proteins and fibrils under physiological buffer conditions. Functionalization is often required to control orientation or mimic biological interfaces.
2. Highly Ordered Pyrolytic Graphite (HOPG): Provides large, inert, hydrophobic, and atomically flat terraces. It strongly adsorbs hydrophobic protein domains and is excellent for studying denatured proteins, early oligomers, or peptides with hydrophobic cores (e.g., Aβ, α-synuclein). Its non-polar surface can sometimes induce non-physiological aggregation. Functionalization is challenging due to chemical inertness but can be achieved via electrochemical oxidation or non-covalent physisorption of surfactants.
3. Silane Chemistry on Oxidized Surfaces (Silicon/SiO₂, Glass, Mica): Provides a versatile platform for covalent, stable functionalization. Silane coupling agents with terminal functional groups (e.g., amine, aldehyde, epoxy) enable the immobilization of proteins via specific linkages, reducing surface diffusion and enabling controlled orientation. This is essential for single-molecule force spectroscopy (SMFS) or studies requiring a biological mimic (e.g., a supported lipid bilayer).
Comparative Substrate Properties:
| Property | Freshly Cleaved Mica | HOPG | Silanized SiO₂ (e.g., APTES) |
|---|---|---|---|
| Surface Charge | Negative | Neutral/Hydrophobic | Tunable (e.g., positive for APTES) |
| Hydrophobicity | Hydrophilic | Highly Hydrophobic | Tunable |
| Roughness (RMS) | < 0.1 nm | < 0.1 nm | ~0.2 - 0.5 nm (depends on layer) |
| Key Advantage | Atomically flat, easy cleavage | Large flat terraces, hydrophobic | Covalent, stable functionalization |
| Primary Limitation | Non-specific electrostatic adsorption | Can induce denaturation | Increased roughness, multi-step prep |
| Typical Immobilization | Physisorption (electrostatic) | Physisorption (hydrophobic) | Covalent linkage or specific binding |
| Best For | High-res imaging of fibrils, soluble proteins | Hydrophobic peptides/oligomers, kinetics | SMFS, oriented immobilization, mimics |
Protein Adsorption Metrics:
| Protein/Substrate System | Approx. Coverage (particles/μm²) | Typical Buffer Conditions | Key Functionalization |
|---|---|---|---|
| β‑Lactoglobulin Fibrils on Mica | 10-30 fibrils (length variable) | 10 mM HEPES, pH 7.2 | None, or 1 mM Mg²⁺ added |
| Aβ42 Oligomers on HOPG | 200-500 | 10 mM PBS, pH 7.4 | None |
| Lysozyme on APTES-SiO₂ | 50-100 (covalent) | 50 mM phosphate, pH 7.0 | Glutaraldehyde crosslinker |
| Tau Protein on Mica | 15-40 | 10 mM Tris, 50 mM NaCl, pH 7.4 | 0.1% w/v APS (aminopropyl silatrane) |
Experimental Protocols
Protocol 1: Substrate Preparation and Basic Functionalization
A. Mica Cleavage and Poly‑L‑Lysine (PLL) Functionalization Objective: Produce a positively charged surface for enhanced adsorption of negatively charged proteins.
- Using adhesive tape, cleave the top layers of a muscovite mica disk (Ø 10-15 mm) to expose a fresh, clean surface.
- Immediately place the disk in a petri dish.
- Apply 30-50 μL of a 0.01% (w/v) aqueous solution of poly‑L‑lysine (PLL, MW 70,000-150,000) onto the center of the mica.
- Incubate for 5 minutes at room temperature.
- Rinse thoroughly with 2 mL of ultrapure water (3x) to remove unbound PLL.
- Gently dry under a stream of filtered nitrogen or argon gas.
- Use immediately for sample deposition.
B. HOPG Cleavage Objective: Obtain a clean, atomically flat hydrophobic surface.
- Using the "Scotch tape" method, press adhesive tape onto the HOPG surface (Grade ZYA or SPI-1).
- Peel the tape away, removing the top graphite layers.
- Critical: Inspect the surface. It should be shiny and mirror-like. Repeat cleavage if any streaks or defects are visible.
- Use immediately (within 15 minutes) for sample deposition to minimize hydrocarbon contamination.
C. APTES Silanization of Silicon Wafers for Amine Functionalization Objective: Create a stable, positively charged amine-terminated surface on an oxide substrate.
- Cleaning: Sonicate a silicon wafer (with 300 nm thermal oxide) in acetone for 10 min, followed by ethanol for 10 min. Rinse with copious amounts of ultrapure water.
- Activation: Treat the wafer with oxygen plasma (e.g., 100 W, 2 minutes) or immerse in a fresh Piranha solution (Caution: Extremely hazardous) for 30 minutes. Rinse extensively with ultrapure water and dry under N₂.
- Silanization: In a fume hood, immerse the activated wafer in a freshly prepared 2% (v/v) solution of (3‑Aminopropyl)triethoxysilane (APTES) in anhydrous toluene for 1 hour at room temperature.
- Rinsing: Rinse sequentially with toluene, ethanol, and ultrapure water to remove physisorbed silane.
- Curing: Bake the wafer at 110°C for 10-15 minutes to complete the condensation reaction.
- Storage: Store under vacuum or desiccated N₂ atmosphere for up to one week.
Protocol 2: Covalent Immobilization of Proteins via Glutaraldehyde Crosslinking on APTES
Objective: Covalently tether proteins via primary amines to the surface for SMFS or stable imaging in liquid.
- Prepare an APTES-functionalized silicon wafer as in Protocol 1C.
- Prepare a 2.5% (v/v) solution of glutaraldehyde in phosphate-buffered saline (PBS, 0.1 M, pH 7.4).
- Incubate the APTES wafer with the glutaraldehyde solution for 30 minutes at room temperature in a humid chamber.
- Rinse thoroughly with PBS (3x, 2 mL each) to remove any unreacted glutaraldehyde.
- Immediately deposit the protein sample solution (in a compatible, amine-free buffer such as PBS or HEPES) onto the activated surface.
- Incubate for 15-30 minutes.
- Rinse gently but thoroughly with imaging buffer (3x) to remove physisorbed protein before AFM analysis.
Visualizations
Title: Substrate Selection Decision Tree for AFM Protein Studies
Title: Silanization and Protein Immobilization Workflow
The Scientist's Toolkit: Research Reagent Solutions
| Item | Function in Protocol | Key Consideration |
|---|---|---|
| Muscovite Mica Discs (V1 Grade) | Provides atomically flat, negatively charged substrate. | Ensure fresh cleavage immediately before use. |
| HOPG Sheets (SPI-1 or ZYA Grade) | Provides large, inert, hydrophobic terraces. | Quality of cleavage is critical; avoid reusing tape. |
| (3-Aminopropyl)triethoxysilane (APTES) | Silane coupling agent for introducing amine groups on oxides. | Must be anhydrous; use fresh, dry toluene as solvent. |
| Poly‑L‑Lysine (PLL) Hydrobromide | Creates a uniform positive charge layer on mica for enhanced protein adhesion. | Use low concentration (0.01%) to avoid multilayer formation. |
| Glutaraldehyde (25% Solution) | Homobifunctional crosslinker for covalently linking amine groups on surface to proteins. | Always use fresh, high-purity grade; aliquots avoid freeze-thaw. |
| Anhydrous Toluene | Solvent for silane deposition; prevents APTES hydrolysis before surface reaction. | Use sealed, oxygen-free bottles; store over molecular sieves. |
| Aminopropyl Silatrane (APS) | Hydrolysis-resistant silanization agent for mica functionalization. | More stable than APTES on mica; works in aqueous solution. |
| Piranha Solution (7:3 H₂SO₄:H₂O₂) | Extreme Hazard. Cleans and hydroxylates oxide surfaces for silanization. | Use with extreme caution; never store in closed containers. |
Sample Deposition and Incubation Protocols for Time-Course Aggregation Studies
Within the broader thesis on utilizing Atomic Force Microscopy (AFM) for studying protein aggregation and amyloid fibril formation, standardized sample preparation is paramount. This document provides detailed deposition and incubation protocols for time-course aggregation studies, enabling consistent sample generation for high-resolution AFM imaging and analysis. These protocols are designed to control nucleation and growth phases, allowing researchers to capture distinct morphological intermediates.
Key Research Reagent Solutions
| Reagent/Material | Function in Protocol |
|---|---|
| Recombinant Protein (e.g., Aβ42, α-synuclein) | The protein of interest, purified and lyophilized. Starting material for aggregation. |
| Hexafluoro-2-propanol (HFIP) | Pre-treatment solvent to dissolve aggregates and monomerize the protein stock. |
| Dimethyl Sulfoxide (DMSO) | Solvent for preparing a stable, monomeric protein stock solution from HFIP-treated film. |
| Aggregation Buffer (e.g., PBS, Tris-HCl) | Provides physiological-like pH and ionic strength to promote aggregation. May contain specific ions (e.g., NaCl). |
| Thioflavin T (ThT) | Fluorescent dye that binds to β-sheet-rich aggregates. Used for parallel kinetic monitoring. |
| Freshly Cleaved Mica Substrates | Atomically flat, negatively charged substrate for AFM sample deposition. Ideal for adsorbing proteins. |
| Atomic Force Microscope (with Tapping Mode) | Core instrument for high-resolution topographic imaging of aggregates at different time points. |
Detailed Experimental Protocols
Protocol A: Monomer Preparation and Seeding
Objective: Generate a homogeneous, aggregation-competent monomeric protein solution.
- Dissolve lyophilized protein in 100% HFIP to 1 mg/mL.
- Aliquot into microcentrifuge tubes and evaporate HFIP under a gentle stream of inert gas (e.g., N₂) to form a clear protein film.
- Dry films further in a vacuum desiccator for 1 hour.
- Resuspend protein film in anhydrous DMSO to a concentration of 5 mM (e.g., ~22 mg/mL for Aβ42).
- Sonicate the DMSO solution in a bath sonicator for 10 minutes.
- Centrifuge at 16,000 × g for 10 minutes at 4°C. Transfer supernatant to a new tube. This is the monomeric stock.
- For seeded reactions, pre-formed fibrils (sonicated briefly) can be added at a defined percentage (e.g., 1-5% w/w) to the monomer solution.
Protocol B: Time-Course Aggregation Incubation
Objective: Initiate and maintain aggregation under quiescent conditions, sampling at defined intervals.
- Dilute the monomeric stock into pre-chilled aggregation buffer (e.g., PBS, pH 7.4) to the final working concentration (e.g., 10-50 µM). Keep on ice.
- Add ThT dye to a final concentration of 20 µM if fluorescence monitoring is desired.
- Vortex the solution gently for 5-10 seconds to ensure mixing.
- Aliquot the aggregation reaction into multiple, identical low-protein-binding microcentrifuge tubes (e.g., 50 µL per tube).
- Immediately place all tubes in a thermostatted incubator or plate shaker without agitation for quiescent conditions. Typical temperature is 37°C.
- Time-Course Sampling: At each predetermined time point (e.g., 0, 2, 8, 24, 48, 96 hours), remove one aliquot tube from the incubator and place it immediately on ice to halt aggregation.
Protocol C: AFM Sample Deposition
Objective: Deposit aggregates from a sampled time point onto mica for AFM imaging.
- Dilute the iced aggregation aliquot 10-50 fold into the same ice-cold aggregation buffer to minimize further aggregation during deposition. Critical: Dilution factor must be consistent for all time points.
- Piper 20-40 µL of the diluted sample onto a freshly cleaved mica disk (V-1 grade).
- Allow adsorption for 5-10 minutes at room temperature.
- Rinse the mica surface gently but thoroughly with 2-3 washes of ultrapure water (200 µL each) to remove salts and unbound protein.
- Gently dry the sample under a stream of filtered, dry nitrogen or argon gas.
- Store the deposited sample in a desiccator until AFM imaging. Note: For some samples, immediate imaging is preferable.
Table 1: Representative Time-Course Aggregation Parameters for Aβ42 (50 µM, PBS, 37°C, Quiescent)
| Time Point (Hours) | Mean Aggregate Height (nm) ± SD (AFM) | Relative ThT Fluorescence (a.u.) | Predominant Morphology (AFM) |
|---|---|---|---|
| 0 | 1.2 ± 0.3 | 1.0 | Monomeric/Dispersed |
| 4 | 3.5 ± 1.2 | 1.5 | Oligomers, small protofibrils |
| 12 | 8.7 ± 2.8 | 15.8 | Protofibrils, short fibrils |
| 24 | 12.1 ± 3.5 | 85.4 | Mature fibrils (1-5 µm length) |
| 72 | 12.5 ± 3.1 | 98.7 | Dense fibril networks |
Table 2: Impact of Seeding on Lag Time (Representative Data)
| Condition (Aβ42, 25 µM) | Average Lag Time (Hours)* | Fibril Appearance (AFM) by 24h |
|---|---|---|
| Unseeded | 12.5 ± 2.1 | Sparse fibrils |
| Seeded (1% sonicated fibrils) | < 1 | Dense, mature fibril mat |
*Lag time determined from ThT kinetics as time to reach 50% of maximum fluorescence.
Visualized Workflows and Relationships
Title: Protein Aggregation Time-Course Workflow for AFM
Title: Aggregation Pathways with Secondary Nucleation
Atomic Force Microscopy (AFM) is a cornerstone technique for studying protein aggregation and amyloid fibril formation, processes central to neurodegenerative diseases like Alzheimer's and Parkinson's. High-resolution imaging is paramount for elucidating fibril polymorphism, protofilament substructure, and early oligomer species. However, these biological nanostructures are exceptionally soft and prone to deformation or displacement under excessive mechanical load. Minimizing tip-sample interaction forces is therefore not merely an optimization step but a fundamental requirement for obtaining physiologically relevant structural data. This document provides detailed application notes and protocols for achieving true high-resolution imaging in amyloid research by rigorously controlling imaging forces.
Core Strategies & Quantitative Comparison
The following table summarizes the primary strategies for minimizing tip-sample forces, their mechanism, typical force ranges, and suitability for amyloid fibril imaging.
Table 1: Comparative Analysis of Low-Force AFM Imaging Modes
| Strategy / Mode | Operational Principle | Typical Force Range | Key Advantages for Amyloid Studies | Key Limitations |
|---|---|---|---|---|
| Tapping Mode (AC) | Cantilever oscillates at resonance; amplitude reduction from intermittent contact is used for feedback. | 50-200 pN | Good balance between resolution and sample protection. Effective for mapping fibril networks on substrates. | Lateral shear forces can persist. Can induce fibril vibration. |
| PeakForce Tapping | Oscillates at sub-resonance (~1-2 kHz); force-distance curve captured on each tap; feedback on peak force. | 10-100 pN | Direct, real-time control and quantification of peak force. Superior for imaging fragile oligomers and single fibrils. | Requires specialized Bruker hardware/software. |
| Non-Contact Mode (FM/AM) | Cantilever oscillates just above the surface with no contact; detects frequency or amplitude shift from van der Waals forces. | < 50 pN | Lowest possible vertical force. Ideal for immobilized, non-adherent structures. | Extremely challenging in liquid. Susceptible to jump-to-contact. |
| Magnetic AC (MAC) Mode | Cantilever is driven magnetically; offers stable oscillation in liquid. | 50-150 pN | Excellent stability in fluid, crucial for in situ aggregation studies. Clean drive, no spurious excitations. | Requires magnetically coated levers and a magnetic drive coil. |
| Force Mapping (QITM) | Acquires an array of force curves; topography is reconstructed from the point of zero force or constant force. | 5-50 pN (set point) | Provides simultaneous nanomechanical property maps (e.g., adhesion, deformation) with topography. | Very slow imaging speed. Data complexity. |
| Small-Amplitude Tapping | Reduces free amplitude (< 5 nm) in tapping or PeakForce Tapping to confine energy. | Can reach < 20 pN (PFT) | Dramatically reduces energy transfer to soft samples. Minimizes fibril sweeping. | Increased noise sensitivity; requires ultra-stable environment. |
Detailed Experimental Protocols
Protocol 3.1: Sample Preparation for Low-Force Imaging of Amyloid Fibrils
Objective: To immobilize amyloid fibrils firmly to a substrate to prevent displacement by scanning tip. Materials: Freshly cleaved mica (P1 grade), (3-Aminopropyl)triethoxysilane (APTES), glutaraldehyde (0.5-2% solution), amyloid fibril solution (e.g., Aβ42, α-synuclein), ultrapure water, phosphate buffer saline (PBS, pH 7.4). Procedure:
- Surface Functionalization (APTES-Glutaraldehyde):
- Place freshly cleaved mica in a dessicator with 10 µL APTES in a separate container. Evacuate for 5 minutes, then seal and incubate for 1 hour.
- Bake mica at 70°C for 15 minutes.
- Rinse thoroughly with ethanol and water, then dry under argon.
- Apply 50 µL of 0.5% glutaraldehyde in PBS onto the APTES-mica for 30 minutes.
- Rinse extensively with ultrapure water and blow dry.
- Fibril Immobilization:
- Dilute fibril sample in appropriate buffer (e.g., 10 mM HEPES, pH 7.4) to ~0.1-1 µg/mL.
- Pipette 20-40 µL onto the functionalized mica surface.
- Incubate for 10-20 minutes.
- Rinse gently but thoroughly with 2-3 mL of imaging buffer (e.g., 10 mM HEPES) to remove unbound protein.
- Lightly blot edges and proceed to AFM fluid cell assembly. Do not let the surface dry.
Protocol 3.2: High-Resolution Imaging in Liquid Using PeakForce Tapping
Objective: To image amyloid fibrils with sub-nanometer vertical resolution while maintaining peak forces < 100 pN. Materials: AFM with PeakForce Tapping capability (e.g., Bruker MultiMode or BioScope Resolve), SNL or MSNL cantilevers (Bruker, nominal k = 0.06-0.7 N/m), fluid cell, imaging buffer. Procedure:
- Cantilever Calibration:
- Install cantilever in fluid cell. Engage in contact mode on a clean, rigid area to measure the optical lever sensitivity (InvOLS).
- Thermal tune in fluid to determine the spring constant (k).
- Parameter Optimization:
- Set PeakForce Setpoint to 50-100 pN as a starting point.
- Adjust PeakForce Amplitude (typically 5-15 nm) to ensure consistent, gentle tapping.
- Set PeakForce Frequency to 0.5-2 kHz.
- Optimize Feedback Gains (Proportional/Integral) to maintain setpoint without oscillations.
- Use Scan Rate of 0.5-1.5 Hz for a 1 µm scan.
- Enable ScanAsyst or automatic optimization if available.
- Imaging:
- Engage using standard procedure.
- Continuously monitor the PeakForce Error channel—it should be nearly flat, indicating constant, low force.
- Adjust the setpoint downward in 10 pN increments until minimal force is applied without losing tracking. The goal is a setpoint just above the point of loss of contact.
Protocol 3.3: Non-Contact Mode Imaging in Air of Dried Fibrils
Objective: To achieve ultra-high resolution of fibril periodicity and substructure with negligible force. Materials: AFM with true non-contact mode capability (e.g., Park NX series, Keysight 5500/7500), ultra-sharp, high-frequency cantilevers (e.g., PPP-NCHR, nominal f₀ ~330 kHz, k ~42 N/m), sample prepared via Protocol 3.1 and gently air-dried. Procedure:
- Cantilever Tuning:
- Tune the cantilever to find its fundamental resonance frequency in air.
- Set the drive amplitude to achieve an oscillation amplitude of 5-15 nm (free amplitude, A₀).
- Parameter Setup:
- Set the Setpoint to a value very close to A₀ (e.g., 95-99% of A₀). This ensures operation in the attractive regime without contact.
- Use a low Scan Rate (0.3-0.6 Hz).
- Set Feedback Gains to be moderately aggressive to track the steep attractive force gradient.
- Engagement and Imaging:
- Engage with extreme caution, using automatic engage routines if available.
- Immediately after engage, fine-tune the setpoint to maximize detail while avoiding any "bi-stable" jumping or contact.
- The Phase or Frequency Shift channel often provides enhanced contrast on fibril substructure.
Visualization of Workflows and Relationships
Title: Decision Workflow for Low-Force AFM Imaging of Amyloids
Title: Impact of Imaging Force on Amyloid Fibril Data Fidelity
The Scientist's Toolkit: Key Reagent & Material Solutions
Table 2: Essential Research Reagents & Materials for Low-Force AFM Protein Studies
| Item | Function & Rationale | Example Product/Catalog |
|---|---|---|
| Ultra-Sharp, Low-Force Cantilevers | Minimize contact area and pressure. Low spring constant reduces vertical force. Essential for high resolution. | Bruker ScanAsyst-Fluid+ (k~0.7 N/m); Olympus BL-AC40TS (k~0.1 N/m); BudgetSensors ContAl-G (k~0.2 N/m) |
| Functionalized Substrates | Provide covalent or high-affinity immobilization of fibrils to prevent scanning-induced movement. | APTES-Glutaraldehyde coated mica; Ni-NTA functionalized surfaces for His-tagged proteins; PEI (polyethylenimine) coated mica. |
| High-Purity Mica | An atomically flat, negatively charged surface ideal for adsorption and imaging. Can be easily functionalized. | Ted Pella, Grade V1 Muscovite Mica Discs (P1). |
| Biocompatible Imaging Buffers | Maintain protein structure and hydration without causing tip or sample contamination. Low salt reduces meniscus forces. | 10-20 mM HEPES, pH 7.4; 10 mM ammonium acetate; Tris buffers without amine-reactive groups. |
| Calibration Gratings | Verify lateral (XY) and vertical (Z) scanner calibration and tip sharpness prior to imaging fragile samples. | Bruker TGXYZ1 (10 µm pitch) or TGQ1 (quantitative); NT-MDT TGZ1 (blazed grating). |
| Vibration Isolation System | Critical for stable operation at low forces and small amplitudes. Reduces acoustic and floor noise. | Active isolation platforms (e.g., Herzan TS-150); passive air tables. |
| Acoustic Enclosure | Minimizes air currents and ambient noise that destabilize cantilever oscillation, especially in non-contact mode. | Custom or commercial AFM acoustic hoods. |
| Non-Adhesive, Sharp Tips for NC | Tips with high aspect ratio and high resonant frequency for stable non-contact imaging in air. | NanoWorld ARROW-NCR (f₀~285 kHz) or PPP-NCHR (f₀~330 kHz). |
This Application Note provides detailed protocols for the quantitative nanoscale analysis of amyloid fibril morphology using Atomic Force Microscopy (AFM). Framed within a broader thesis on AFM for protein aggregation research, these methods are critical for researchers characterizing fibril structure, stability, and the impact of potential therapeutic modifiers. Precise measurement of height, length, periodicity, and twist is essential for linking structural polymorphs to disease pathology and drug mechanism of action.
The table below summarizes the typical dimensional ranges for amyloid fibrils derived from common model proteins, as reported in recent literature (2023-2024). Data was gathered from live searches of current peer-reviewed publications and pre-prints.
Table 1: Representative Quantitative Dimensions of Common Amyloid Fibrils
| Protein / Peptide System | Average Height (nm) | Typical Length Range (μm) | Periodicity (Helical Half-Pitch, nm) | Apparent Twist (Degrees) | Key Conditions (pH, Buffer) |
|---|---|---|---|---|---|
| Aβ(1-42) (mature fibril) | 6.5 - 9.0 | 0.2 - 5.0 | 22 - 27 (≈47-55 nm full pitch) | 0.8 - 1.2 | 20 mM Hepes, pH 7.4, 37°C |
| α-Synuclein (Type 2A) | 7.0 - 10.0 | 0.5 - 10.0 | 70 - 100 | 1.0 - 1.5 | PBS, pH 7.4, 37°C, agitation |
| Tau (K18 ΔK280, paired helical filament-like) | 8.0 - 12.0 | 0.1 - 2.0 | 65 - 80 | ≈1.0 | 10 mM Hepes, 100 mM NaCl, pH 7.4 |
| Insulin (fibrils) | 4.0 - 7.0 | 0.5 - 20.0 | 25 - 35 | 1.5 - 2.5 | 25 mM HCl, pH 1.6, 65°C |
| β2-Microglobulin | 5.0 - 8.0 | 0.3 - 8.0 | 28 - 33 | ≈2.0 | 50 mM Sodium Phosphate, 100 mM NaCl, pH 2.5 |
| Lysozyme (hen egg-white) | 4.5 - 7.5 | 0.5 - 15.0 | 23 - 30 | 1.0 - 2.0 | 20 mM Gly-HCl, pH 2.0, 57°C |
Experimental Protocols
Protocol 1: Sample Preparation for AFM Imaging of Amyloid Fibrils
Objective: To adsorb fibrils onto a substrate with appropriate density and minimal aggregation for high-resolution imaging. Materials: See "The Scientist's Toolkit" below. Procedure:
- Dilution: Dilute the fibril sample (typically from a 5-50 μM monomer-equivalent stock) 10-100 fold into the imaging buffer (e.g., 20 mM HEPES, pH 7.4, or the aggregation buffer filtered through a 0.02 μm filter). This reduces salt concentration and particle density.
- Substrate Priming: Cleave a fresh mica disk (∼1 cm diameter). Apply 10-20 μL of a 0.1% (w/v) poly-L-lysine (PLL) solution for 30 seconds for cationic functionalization, OR use AP-mica (see Toolkit). Rinse thoroughly with >1 mL ultrapure water (18.2 MΩ·cm) and dry under a gentle stream of nitrogen or argon.
- Adsorption: Apply 30-50 μL of the diluted fibril solution onto the prepared mica surface. Incubate for 5-15 minutes at room temperature.
- Rinsing: Gently rinse the surface with 2-3 mL of filtered imaging buffer or ultrapure water to remove loosely bound proteins and salts. Do not let the surface dry if imaging in liquid.
- Drying (for Tapping Mode in Air): Dry the sample under a gentle stream of inert gas (N₂ or Ar).
- Mounting: Mount the mica disk onto a metal specimen disk using a double-sided adhesive.
Protocol 2: AFM Imaging for Dimensional Analysis
Objective: To acquire high-resolution, quantitative height images of fibrils. Procedure:
- Microscope Setup: Mount the prepared sample. For imaging in air, use silicon probes with a resonant frequency of ~300 kHz (e.g., RTESPA-300). For imaging in liquid, use sharp silicon nitride or silicon probes (e.g., SNL, ScanAsyst-Fluid+).
- Engagement & Tuning: Engage the probe in a clean area of the sample. Tune the cantilever to find its resonant frequency and set the amplitude setpoint (typically 0.8-0.9 times the free amplitude).
- Scan Parameters: Set the scan size to 2-10 μm to capture multiple fibrils. Use a resolution of 512 x 512 or 1024 x 1024 pixels. Set a slow scan rate (0.5-1.0 Hz) to minimize tracking errors.
- Image Flattening: After acquisition, apply a 1st or 2nd order flattening algorithm to the raw image to correct for sample tilt and scanner bow. No further filtering should be applied before cross-section analysis.
Protocol 3: Quantitative Analysis of Fibril Dimensions
Objective: To extract height, length, periodicity, and twist from AFM topography images. Software: Use instrument vendor software (e.g., NanoScope Analysis, Gwyddion, SPIP, MountainsSPIP). Procedure: A. Height Measurement:
- Draw a perpendicular line profile across an isolated fibril.
- Measure the full height from the substrate baseline to the top of the fibril. Repeat across at least 10 different points on at least 10 different fibrils.
- Calculate mean and standard deviation.
B. Length Measurement:
- Use the "Fibril Analysis" or "Particle Analysis" module. Manually trace the fibril's contour from end to end, or use automated skeletonization algorithms for straight fibrils.
- Record the contour length. Analyze >50 fibrils per condition.
C. Periodicity (Half-Pitch) Measurement:
- Draw a line profile along the longitudinal axis of a fibril over a distance covering several periodic repeats.
- Perform a 1D Fast Fourier Transform (FFT) on the height data from this line profile.
- The dominant peak in the power spectrum corresponds to the repeat frequency. The periodicity (half-pitch) is calculated as (1 / peak frequency).
- Validate by measuring the peak-to-peak distance between adjacent repeating units (e.g., crossover points) in the original height profile.
D. Twist Angle Calculation:
- From high-resolution images, identify fibrils lying flat on the substrate.
- Measure the width (FWHM) of the fibril from multiple perpendicular line profiles along its length.
- The apparent width varies sinusoidally due to the helical twist. The peak-to-peak distance in this width variation corresponds to the half-pitch (P).
- The fibril's true diameter (D) is approximated by its minimum measured width.
- The twist angle (θ) per protofilament can be estimated using the formula: θ = arctan(π * D / P). More complex models using 3D reconstructions from multiple AFM images provide more accurate values.
Mandatory Visualizations
Title: AFM Analysis within Amyloid Formation Pathway
Title: Experimental Workflow for AFM Fibril Dimensional Analysis
The Scientist's Toolkit: Research Reagent Solutions
Table 2: Essential Materials for AFM-based Fibril Dimensional Analysis
| Item | Function & Specification | Example Product/Catalog |
|---|---|---|
| Freshly Cleaved Mica | Atomically flat, negatively charged substrate for sample adsorption. | Muscovite Mica V1, SPI Supplies |
| Poly-L-Lysine (PLL) | Cationic polymer for mica functionalization; promotes electrostatic adhesion of fibrils. | 0.1% (w/v) PLL solution, Sigma P4707 |
| (3-Aminopropyl)triethoxysilane (APTES) | For creating amino-silanized (AP-) mica, offering stronger covalent binding. | Sigma 440140 |
| Ultrapure Water | For rinsing substrates and preparing buffers; prevents contamination. | 18.2 MΩ·cm, filtered (0.2 μm) |
| Filtered Imaging Buffer | Low-salt buffer compatible with AFM liquid cell; minimizes tip-sample interactions. | 20 mM HEPES, pH 7.4, 0.2 μm filtered |
| AFM Probes (Tapping Mode) | High-resolution tips for imaging in air or liquid. | Bruker RTESPA-300 (air), ScanAsyst-Fluid+ (liquid) |
| Image Analysis Software | For processing raw AFM data and performing quantitative measurements. | Gwyddion (Open Source), Bruker NanoScope Analysis |
| Fibrillation Buffer Kits | Pre-formulated, consistent buffers for reproducible amyloid formation. | Abcam Amyloid Fibril Formation Buffer Kit (ab269539) |
Within the broader thesis on Atomic Force Microscopy (AFM) for studying protein aggregation and amyloid fibrils, force spectroscopy (FS) emerges as an indispensable technique. It moves beyond topographical imaging to quantify the fundamental nanomechanical properties that govern fibril stability, maturation, and pathological interactions. These mechanical parameters—including Young’s modulus, adhesion forces, and rupture strengths—correlate with fibril polymorphism, toxicity, and resistance to degradation. For researchers and drug development professionals, quantifying these properties provides critical insights for understanding disease mechanisms and for screening compounds designed to destabilize pathological aggregates or reinforce functional amyloid structures.
This document provides current protocols and resources for applying FS to amyloid fibril mechanics, framed within a robust experimental workflow.
Core Experimental Protocols
Protocol 2.1: Sample Preparation for Fibril Mechanics
Objective: To immobilize amyloid fibrils on a substrate suitable for AFM-FS measurements.
- Substrate Treatment: Use freshly cleaved muscovite mica or ultra-flat gold substrates. For mica, treat with 10-100 µL of 0.1% (w/v) poly-L-lysine (PLL) for 15 minutes, then rinse gently with ultrapure water (Milli-Q) and dry under a gentle nitrogen stream.
- Fibril Immobilization: Dilute the pre-formed fibril sample (e.g., Aβ42, α-synuclein, lysozyme) in the appropriate buffer (e.g., 20 mM HEPES, pH 7.4) to a final concentration of 0.1-1 µM. Deposit 20-50 µL onto the treated substrate.
- Incubation: Incubate for 10-30 minutes in a humid chamber to prevent evaporation.
- Washing: Gently rinse the substrate with 2 mL of measurement buffer (typically the same as the incubation buffer) to remove loosely bound fibrils and monomers.
- Immediate Use: Keep the sample hydrated and proceed to AFM measurement. Do not allow it to dry.
Protocol 2.2: AFM Force Spectroscopy on Single Fibrils
Objective: To acquire force-distance (F-D) curves on individual fibrils to extract mechanical properties.
- Cantilever Selection: Use sharp, non-functionalized silicon nitride (Si₃N₄) cantilevers (e.g., Bruker OMCL-RC800PB) with a nominal spring constant (k) of 0.01-0.1 N/m for minimal sample indentation.
- Spring Constant Calibration: Calibrate the cantilever’s exact spring constant in buffer using the thermal noise method.
- Approach & Engagement: Engage onto the sample in contact mode with a very low setpoint (< 1 nN) to locate individual fibrils.
- Force Curve Acquisition:
- Position the tip directly above a single fibril, avoiding junctions or clusters.
- Set trigger threshold to 0.5-2 nN.
- Set approach/retract velocity to 0.5-1 µm/s to minimize viscous drag effects.
- Acquire a grid of 32x32 or 64x64 force curves over a selected fibril segment (e.g., 200 nm x 200 nm area).
- Perform measurements in a minimum of three different locations per fibril and on ≥10 fibrils per sample.
- Data Collection: Save all raw F-D curves for offline analysis.
Protocol 2.3: Data Analysis for Elasticity Measurement
Objective: To determine the Young's modulus (E) of fibrils from the approach segment of F-D curves.
- Conversion: Convert raw deflection vs. position data to force vs. indentation (δ) curves.
- Model Fitting: Fit the initial slope of the indentation curve (typically up to 1-2 nm indentation) with the Hertzian contact model for a pyramidal tip:
F = (E * tan(θ) * δ²) / (2 * (1 - ν²))where F is force, θ is the half-opening angle of the tip (∼17.5°), and ν is the Poisson's ratio of the fibril (assumed to be 0.3-0.5). - Extraction: Extract the apparent Young's modulus (E) from the fit. Perform statistical analysis on hundreds of curves to report mean ± standard deviation.
Table 1: Representative Nanomechanical Properties of Amyloid Fibrils
| Protein / Peptide (Source) | Reported Young's Modulus (GPa) | Adhesion Force (pN) | Probing Method (Tip) | Key Reference (Year) |
|---|---|---|---|---|
| Aβ42 (full-length) | 2.1 ± 0.5 | 50 - 150 | AFM-FS (sharp Si₃N₄) | Adamcik et al., Nat. Nanotechnol. (2021) |
| α-Synuclein fibrils | 1.8 ± 0.6 | 30 - 100 | AFM-FS (sharp Si₃N₄) | Ruggeri et al., Nat. Commun. (2020) |
| Lysozyme fibrils (pH 2) | 3.5 ± 0.9 | 80 - 200 | AFM-FS (sharp Si₃N₄) | Sweers et al., Nanoscale (2019) |
| Insulin fibrils | 2.9 ± 1.1 | 60 - 180 | PeakForce QNM | Smith et al., Biophys. J. (2021) |
| Tau K18 fibrils | 1.2 ± 0.4 | 20 - 80 | AFM-FS (sharp Si₃N₄) | Ait-Bouziad et al., Sci. Adv. (2020) |
| HET-s prion (fungal) | 4.2 ± 1.3 | 100 - 250 | AFM-FS (sharp Si₃N₄) | Guzman et al., PNAS (2022) |
Table 2: Key Parameters for Force Spectroscopy Protocols
| Parameter | Recommended Value/Range | Purpose / Rationale |
|---|---|---|
| Cantilever k | 0.01 - 0.1 N/m | High sensitivity for low forces, minimizes sample damage. |
| Trigger Threshold | 0.5 - 2 nN | Ensures contact with fibril without excessive compression. |
| Approach Velocity | 0.5 - 1 µm/s | Balances data acquisition speed with hydrodynamic forces. |
| Indentation Limit | 1 - 2 nm | Stays within linear elastic regime, avoids substrate effect. |
| Fitting Model | Hertz (pyramidal) | Standard model for elastic contact with a stiff sample. |
| Poisson's Ratio (ν) | 0.3 - 0.5 (assumed) | Material property; 0.3-0.5 is typical for proteinaceous materials. |
Visualized Workflows and Pathways
Title: AFM Force Spectroscopy Workflow for Fibril Mechanics
Title: Drug Effect on Fibril Mechanical Stability Pathway
The Scientist's Toolkit: Research Reagent Solutions
Table 3: Essential Materials for AFM-FS on Amyloid Fibrils
| Item / Reagent | Specific Example / Specification | Function in Experiment |
|---|---|---|
| AFM & Cantilevers | Bruker MultiMode or Cypher, BioScope Resolve; Olympus OMCL-RC800PB cantilevers (k~0.05 N/m). | Core instrument for applying force and measuring nanoscale deflection. Cantilever choice dictates force sensitivity. |
| Substrate | V1 Grade Muscovite Mica disks (e.g., 15mm diameter); template-stripped gold. | Provides an atomically flat, clean surface for fibril immobilization and imaging. |
| Immobilization Agent | Poly-L-Lysine hydrobromide (PLL), 0.1% (w/v) in water, sterile filtered. | Coats the negatively charged mica surface to provide positive charges for electrostatic fibril adhesion. |
| Buffer System | HEPES (20 mM, pH 7.4) or PBS (10 mM, pH 7.4), filtered (0.02 µm). | Maintains fibril integrity and provides a consistent liquid environment for measurement. |
| Protein/Peptide | Recombinant human Aβ42, α-synuclein, lysozyme (>95% purity by HPLC). | The amyloidogenic protein of interest. Purity is critical for reproducible fibril formation. |
| Fibrillization Buffer | Specific to protein (e.g., for Aβ42: 10 mM HCl, 150 mM NaCl). | Defines conditions (pH, ionic strength) that promote controlled, reproducible fibril growth. |
| Analysis Software | Gwyddion, NanoScope Analysis, JPK Data Processing, custom Matlab/Python scripts. | For processing force-volume data, fitting models, and statistical analysis of mechanical parameters. |
Within the broader thesis on Atomic Force Microscopy (AFM) for protein aggregation and amyloid fibril research, real-time kinetic studies are paramount. Understanding the temporal progression from soluble monomers to neurotoxic oligomers and, finally, to mature fibrils is critical for elucidating disease mechanisms in Alzheimer's, Parkinson's, and other amyloidoses. This application note details protocols and methodologies for tracking these dynamics in real-time, integrating AFM with complementary spectroscopic techniques.
Key Quantitative Data from Recent Kinetic Studies
Table 1: Kinetic Parameters for Amyloid-β (Aβ42) Aggregation
| Parameter | Value (Mean ± SD) | Measurement Technique | Experimental Conditions (pH, T, [Protein]) |
|---|---|---|---|
| Lag Time (τ) | 2.5 ± 0.3 hours | ThT Fluorescence | pH 7.4, 37°C, 25 µM |
| Elongation Rate Constant (k⁺) | 2.1 x 10³ ± 150 M⁻¹s⁻¹ | AFM Time-series | pH 7.4, 37°C, 10 µM |
| Secondary Nucleation Rate | 1.8 x 10⁻³ ± 0.2 s⁻¹ | Seeded ThT Assay | pH 7.4, 37°C, 5 µM seed |
| Critical Oligomer Concentration | 85 ± 15 nM | AFM & MALS | pH 7.4, 25°C |
| Average Fibril Growth Velocity | 85 ± 12 nm/min | High-Speed AFM | pH 7.4, 37°C, 10 µM |
Table 2: Comparison of Real-Time Monitoring Techniques
| Technique | Temporal Resolution | Spatial Resolution | Key Measurable Parameter | Suitability for Oligomers |
|---|---|---|---|---|
| High-Speed AFM | 100-500 ms/frame | ~1 nm | Fibril length, growth velocity, oligomer dynamics | Excellent |
| ThT Fluorescence | 30-60 seconds | N/A | Bulk fibril formation (lag, growth, plateau) | Poor |
| SPR (Surface Plasmon Resonance) | 1-10 seconds | N/A | Adsorption/elongation rates on biosensor chips | Good |
| QCM-D (Quartz Crystal Microbalance) | ~1 second | N/A | Mass & viscoelasticity of adsorbed layer | Good |
| smFRET (Single Molecule) | 1-10 ms | Molecular scale | Conformational changes within oligomers | Excellent |
Detailed Experimental Protocols
Protocol 1: Real-Time Kinetic Tracking via In-Situ AFM
Objective: To visualize and quantify fibril elongation and oligomer deposition in real-time. Materials: See "The Scientist's Toolkit" below. Method:
- Sample Preparation: Prepare 10 µM monomeric protein solution in desired buffer (e.g., 20 mM phosphate, 150 mM NaCl, pH 7.4). Pre-clear aggregates via ultracentrifugation (100,000 g, 1 hour, 4°C).
- Substrate Functionalization: Inject 200 µL of 0.01% poly-L-lysine into AFM fluid cell with freshly cleaved mica. Incubate 5 minutes. Rinse with 2 mL of imaging buffer.
- Seeding (Optional): For seeded growth, inject pre-formed, sonicated fibril seeds (0.5-5% molar ratio) and allow to adsorb for 2 minutes.
- Initiation of Aggregation: Dilute the prepared monomer solution to final concentration in imaging buffer. Rapidly inject into the fluid cell.
- Data Acquisition: Engage AFM in tapping mode in fluid. Set a scan size (e.g., 2 x 2 µm) over a feature of interest (seed or nascent fibril). Use high-speed capabilities if available. Capture images sequentially with minimal delay.
- Analysis: Use image analysis software (e.g., Gwyddion, SPIP) to track fibril tip positions frame-by-frame. Plot length vs. time to calculate growth velocity.
Protocol 2: Integrated AFM-ThT Fluorescence Assay
Objective: To correlate bulk fluorescent signals with nanoscale morphological events. Method:
- Setup: Utilize an AFM integrated with a top-down optical port or a coupled epifluorescence microscope.
- Simultaneous Measurement: Load sample as in Protocol 1. Add 20 µM ThT to the protein solution.
- Acquisition: Continuously excite ThT at 440 nm and collect emission at 480-500 nm every 60 seconds. In parallel, acquire intermittent AFM scans (e.g., every 10-15 minutes) of predefined locations.
- Correlation: Overlay the ThT kinetic curve (Lag, Growth, Plateau) with the AFM-derived timeline of oligomer appearance, protofibril formation, and fibril maturation.
The Scientist's Toolkit: Essential Research Reagents & Materials
Table 3: Key Research Reagent Solutions
| Item | Function & Explanation |
|---|---|
| Ultra-Pure, Monomeric Protein | Starting material. Requires rigorous purification (HPLC, FPLC) and validation (SDS-PAGE, MS) to ensure aggregation studies begin from defined state. |
| Thioflavin T (ThT) Stock (1 mM) | Fluorescent dye that exhibits enhanced emission upon binding to cross-β-sheet structure of amyloid fibrils; used for bulk kinetic tracking. |
| Poly-L-Lysine or APTES-coated Mica | Positively charged substrate for electrostatic adsorption of protein aggregates, facilitating stable AFM imaging in liquid. |
| Seeded Fibril Fragments | Short, sonicated fibrils used to study elongation phase in isolation, bypassing primary nucleation. |
| Amyloid-Specific Antibodies (e.g., A11, OC) | Used in immuno-AFM to identify and characterize specific oligomeric or fibrillar species on the surface. |
| Quartz Crystal Microbalance (QCM) Sensor Chips (Gold-coated) | For mass-sensitive detection of early adsorption and aggregation events in parallel with AFM studies. |
Visualizations
Title: Amyloid Aggregation Pathways Kinetic Map
Title: Real-Time AFM Kinetic Experiment Workflow
Solving Common AFM Challenges: Artifacts, Contamination, and Data Interpretation Pitfalls
1. Introduction Atomic Force Microscopy (AFM) is indispensable for the nanoscale structural analysis of protein aggregates and amyloid fibrils, offering insights into aggregation mechanisms and potential therapeutic interventions. However, image fidelity is compromised by artifacts, principally tip convolution, instrument drift, and tip-sample adhesion. This application note details protocols for identifying, quantifying, and minimizing these artifacts within the context of amyloid fibril research.
2. Artifact Identification, Quantification, and Mitigation Protocols
Table 1: Summary of Common AFM Artifacts in Amyloid Fibril Imaging
| Artifact | Primary Cause | Key Identifier in Amyloid Imaging | Quantitative Measure | Impact on Fibril Data |
|---|---|---|---|---|
| Tip Convolution | Tip radius (R) comparable to feature size. | Fibrils appear wider than true width; "duplication" of features. | Apparent Fibril Width = True Width + 2R. Overestimation can be 100-200%. | Inaccurate fibril diameter & morphology; false lateral aggregation state. |
| Drift | Thermal instability & scanner creep. | Fibrils appear stretched, compressed, or skewed over time-series. | Drift Rate (nm/min): ∆position/∆time. Can exceed 5 nm/min initially. | Misrepresentation of fibril length & alignment; flawed kinetics from time-lapse. |
| Adhesion | High capillary or electrostatic forces. | Fibrils displaced or "swept" by tip; unstable imaging; high phase contrast. | Adhesion Force (nN): From force-distance curves. Often >10 nN in air. | Sample deformation/destruction; false height measurements; induced aggregation. |
2.1 Protocol: Characterizing and Correcting for Tip Convolution Objective: Determine true fibril dimensions by deconvolving tip geometry. Materials: Tip characterization grating (e.g., TGZ1 or TGZ3, NT-MDT), sharp AFM probes (k ~ 0.1-0.4 N/m, f0 ~ 10-30 kHz, Rnom < 10 nm), amyloid fibril sample deposited on mica. Procedure:
- Tip Characterization Imaging:
- Image a sharp, high-aspect-ratio tip characterization grating (e.g., sharp silicon spikes) in tapping mode.
- Acquire a 1×1 µm scan. The image is a representation of the tip shape (tip imaging).
- Fibril Sample Imaging:
- Using the same tip, image your amyloid fibril sample under identical imaging conditions (setpoint, scan rate).
- Blind Tip Reconstruction & Deconvolution:
- Use AFM software (e.g., Gwyddion, NanoScope Analysis) to perform blind tip estimation from the tip characterizer scan.
- Apply the calculated tip shape to deconvolve the fibril image. This subtracts the tip geometry from the image data.
- Validation:
- Measure fibril heights (unaffected by lateral convolution) and post-deconvolution widths. True fibril widths should converge to expected values (e.g., 5-15 nm for single protofilaments).
2.2 Protocol: Measuring and Compensating for Instrumental Drift Objective: Quantify drift to enable accurate dimensional and kinetic measurements. Materials: Sample with stable fiducial markers (e.g., gold nanoparticles on mica mixed with fibril solution), AFM with closed-loop scanner (recommended). Procedure:
- Drift Measurement:
- Co-deposit fiducial markers (e.g., 10 nm colloidal gold) with your amyloid fibril sample on mica.
- Engage on a scan area containing a clear marker and a fibril.
- Perform a time-series: capture a 500×500 nm image every 2 minutes for 20 minutes without changing scan parameters.
- Drift Calculation:
- Track the X,Y position of the fiducial marker in each sequential image.
- Calculate the drift rate: Drift (nm/min) = [√((Xt - X0)² + (Yt - Y0)²)] / t.
- Drift Compensation:
- For post-processing: Subtract the drift vector from all frames in a time-lapse series to realign features.
- During imaging: Allow the scanner to thermally equilibrate for 60+ minutes. Use closed-loop scanning if available. For kinetic studies, use the "Scan-as-you-Go" method, where imaging is paused after each frame and the feature of interest is manually re-centered before the next scan.
2.3 Protocol: Minimizing Tip-Sample Adhesion in Liquid Objective: Achieve non-destructive, stable imaging of delicate fibrils by minimizing adhesive forces. Materials: Liquid cell, sharp silicon nitride probes (k ~ 0.06-0.1 N/m, f0 ~ 8-12 kHz), appropriate buffer (e.g., PBS or Tris-HCl). Procedure:
- Probe and Environment Selection:
- Use ultrasharp, low-spring-constant probes for liquid tapping mode.
- Ensure complete immersion of the tip and sample to eliminate capillary forces.
- Optimize Imaging Parameters:
- Engage at a low setpoint (~0.7-0.8 V of the free amplitude). Gradually decrease the setpoint until stable tracking is achieved with minimal sample disturbance.
- Use a drive frequency slightly below the resonant peak in liquid for better stability.
- Increase the scan rate to reduce lateral force application, but balance with image quality (typically 1-2 Hz).
- Surface Passivation (Critical for Amyloids):
- Incubate the mica substrate with 10-50 µg/mL poly-L-lysine (PLL) or bovine serum albumin (BSA) for 5 minutes before fibril deposition. This creates a homogeneous, adhesive surface that prevents non-specific tip-fibril adhesion while immobilizing fibrils.
- Rinse gently with imaging buffer before depositing the fibril sample.
3. The Scientist's Toolkit: Essential Research Reagent Solutions
Table 2: Key Materials for Artifact-Free AFM of Amyloid Fibrils
| Item | Function & Rationale |
|---|---|
| Muscovite Mica (V1 Grade) | Atomically flat, negatively charged substrate for fibril immobilization via electrostatic interaction. |
| Poly-L-Lysine (PLL), 0.1% w/v) | Cationic polymer for mica passivation. Creates a uniform surface charge to reduce tip adhesion and control fibril density. |
| Colloidal Gold Nanoparticles (10-20 nm) | Inert fiducial markers for precise quantification of lateral instrumental drift during time-lapse imaging. |
| Sharp Silicon Probes (R < 10 nm) | High-resolution probes (e.g., ATEC-NC, Olympus BL-AC40TS) to minimize tip convolution for accurate fibril width measurement. |
| Soft SiN Probes for Liquid (k ~ 0.06 N/m) | Low spring-constant probes (e.g., SNL, Bruker) to minimize contact force and prevent fibril deformation in fluid. |
| TGZ Series Tip Characterizer | Calibration grating with sharp spikes for empirical determination of the tip's effective shape for deconvolution. |
4. Visualizing the Workflow for Artifact Management
AFM Artifact Diagnosis and Correction Workflow
Multi-Pronged Strategy to Minimize AFM Adhesion
Within a broader thesis on Atomic Force Microscopy (AFM) for the study of protein aggregation and amyloid fibril formation, contamination control is not merely a preliminary step but the foundational determinant of data validity. AFM’s exquisite sensitivity at the nanoscale makes it uniquely vulnerable to artifacts introduced by contaminants on substrates or within protein samples. Such artifacts can be mistakenly interpreted as oligomers, protofibrils, or mature fibrils, leading to erroneous mechanistic conclusions and flawed drug efficacy assessments in development pipelines. These Application Notes provide detailed protocols and current best practices to ensure the integrity of AFM-based biophysical research.
2.1 Common Contaminants
- Particulate Matter: Dust, lint, and silica particles.
- Organic Residues: Surfactants, oils from skin or equipment, polymer leachates, and residual cleaning solvents.
- Biological Contaminants: Airborne microbes, nucleases, proteases, and endotoxins.
- Inorganic Films: Salt crystals from buffers, oxide layers on substrates.
2.2 Quantitative Impact on AFM Measurements Contaminants directly interfere with critical AFM measurements for aggregation studies:
| Contaminant Type | AFM Artifact Manifestation | Mimicked Aggregation Species | Typical Size Range (nm) |
|---|---|---|---|
| Particulate Dust | Irregular, non-proteinaceous peaks. | Large oligomers/aggregates. | 50 - 500 (height) |
| Oil/Surfactant Residues | Amorphous films or micellar structures. | Amorphous aggregates, prefibrillar assemblies. | 1-5 (film thickness) |
| Salt Crystals | Sharp, geometric crystalline structures. | β-sheet-rich fibril fragments. | 20 - 200 |
| Polymer Debris | Fibrous or globular structures. | Mature fibrils or globular proteins. | 5-100 (diameter) |
Protocols for Substrate Preparation
3.1 Ultraclean Mica Substrate Preparation (Muscovite Mica)
- Principle: Freshly cleaved mica provides an atomically flat, negatively charged surface ideal for adsorbing biomolecules.
- Materials: Grade V1 or V2 Muscovite Mica sheets, sharp scalpel, clean tweezers, laminar flow hood.
- Protocol:
- Perform all steps in a laminar flow hood or clean bench.
- Place a mica sheet on a clean, lint-free wipe. Using a clean scalpel, score the mica sheet into ~1x1 cm squares.
- Using clean tweezers, apply the sticky side of transparent tape firmly to the top surface of a scored square.
- In a single, smooth motion, peel the tape back, cleaving the top layers of mica and exposing a fresh, atomically flat surface.
- Immediately use for sample deposition or store in a sealed, dust-free container for <1 hour before use.
3.2 Piranha Solution Cleaning of Silicon Wafers (CAUTION: Extremely Hazardous)
- Principle: A mixture of concentrated sulfuric acid and hydrogen peroxide removes nearly all organic residues through oxidation and hydrolysis.
- Materials: Silicon wafers (test grade), PFA wafer carriers, concentrated H₂SO₄ (96-98%), 30% H₂O₂, ultra-pure water (UPW, 18.2 MΩ·cm), fume hood, acid-resistant PPE.
- Protocol:
- CAUTION: This procedure must be performed in a fume hood with appropriate PPE (face shield, acid-resistant apron, gloves).
- Place silicon wafers in a clean PFA carrier.
- Prepare Piranha solution by slowly adding 3 parts concentrated H₂SO₄ to 1 part 30% H₂O₂ in a clean glass beaker. NEVER add H₂O₂ to acid. The solution will heat violently.
- Allow the solution to cool to ~80°C. Submerge the wafer carrier in the solution for 10-15 minutes.
- Rinse the wafers extensively with copious amounts of UPW (≥5 rinse cycles).
- Dry wafers under a stream of filtered nitrogen or argon gas.
- Use immediately or store in a vacuum desiccator.
3.3 UV-Ozone Treatment Protocol
- Principle: Low-pressure mercury lamps generate 254 nm (germicidal) and 185 nm (ozone-producing) UV light. The combination directly photolyzes organic contaminants and generates reactive atomic oxygen for oxidation.
- Materials: UV-Ozone cleaner (e.g., Jelight or Novascan type), cleaned substrates.
- Protocol:
- Place freshly cleaned or cleaved substrates in the UV-Ozone chamber.
- Close the chamber and run the cleaner for a minimum of 15-20 minutes.
- Remove substrates and use for sample deposition within 10 minutes to minimize re-contamination from ambient air.
Protocols for Protein Sample Cleanliness
4.1 Buffer Preparation and Filtration
- Principle: Remove particulates and microbial contaminants from all solutions.
- Protocol:
- Prepare buffers using the highest purity chemicals and Ultra-Pure Water (UPW, 18.2 MΩ·cm, <5 ppb TOC).
- Filter the buffer through a 0.02 µm inorganic membrane syringe filter (e.g., Anotop) into a sterile, chemically compatible container.
- Store buffers for no more than 1 week at 4°C.
4.2 Protein Purification and Aggregate Removal
- Principle: Remove pre-existing aggregates from monomeric protein stocks.
- Materials: Size-exclusion chromatography (SEC) system, Ultracentrifuge, 100 kDa molecular weight cut-off (MWCO) filters.
- Protocol – Ultracentrifugation (Standard):
- Prepare protein solution in filtered aggregation buffer at desired concentration.
- Transfer to appropriate ultracentrifuge tubes (e.g., polypropylene).
- Centrifuge at >100,000 x g for 1 hour at 4°C (or temperature relevant to study).
- Carefully pipette the top 80-90% of the supernatant into a clean tube, avoiding the pellet.
- Determine protein concentration via UV absorbance (using extinction coefficient).
- Protocol – Size-Exclusion Chromatography (Gold Standard):
- Equilibrate an SEC column (e.g., Superdex 75/200) with filtered, degassed buffer.
- Load centrifuged sample and elute at low flow rate (e.g., 0.5 mL/min).
- Collect the monomer peak eluent in low-protein-binding tubes.
- Concentrate if necessary using a centrifugal filter with appropriate MWCO.
4.3 Sample Deposition for AFM
- Principle: Deposit protein onto substrate without introducing contaminants or inducing non-specific aggregation.
- Protocol (Static Adsorption):
- Place 20-50 µL of cleaned protein sample onto the center of a freshly prepared substrate.
- Incubate in a humidified chamber (e.g., Petri dish with wet kimwipe) for 5-15 minutes to prevent evaporation artifacts.
- Rinse gently with 3-5 drops of filtered UPW or buffer to remove unbound protein and salts.
- Blot the edge of the substrate with a clean lint-free wipe.
- Dry gently under a stream of filtered, dry nitrogen or argon gas (0.02 µm filter on gas line).
The Scientist's Toolkit: Research Reagent Solutions
| Item | Function/Principle | Critical Specification |
|---|---|---|
| Grade V1 Muscovite Mica | Provides an atomically flat, inert, and easily renewable surface for biomolecule adsorption. | Highest optical quality, low defect density. |
| Ultra-Pure Water (UPW) System | Produces water free of ions, organics, and particles that interfere with protein behavior and AFM imaging. | 18.2 MΩ·cm resistivity, <5 ppb Total Organic Carbon (TOC). |
| 0.02 µm Anodisc/Alumina Syringe Filter | Removes sub-micron particulates and microbes from buffers and protein solutions without protein adsorption. | Inorganic membrane, low protein binding. |
| Ultracentrifuge & Polyallomer Tubes | Pelletates large protein aggregates and particulate contaminants from protein solutions via high g-force. | Max RCF >100,000 x g, chemically inert tubes. |
| Size-Exclusion Chromatography (SEC) System | Separates monomeric protein from oligomers and aggregates based on hydrodynamic radius. | High-resolution media (e.g., Superdex), biocompatible FPLC system. |
| UV-Ozone Cleaner | Removes trace organic contaminants from substrate surfaces via photo-oxidation. | Produces both 185 nm & 254 nm wavelength UV. |
| Filtered Nitrogen Gun | Provides a particle-free, dry gas stream for drying substrates post-rinse without contamination. | In-line 0.02 µm particulate filter. |
| Low-Protein-Binding Microtubes | Stores protein samples minimizing loss to tube walls and preventing leaching of polymers. | Made from polypropylene or similar, non-treated. |
| Piranha Solution (H₂SO₄:H₂O₂) | CAUTION: Extremely powerful oxidizer for removing organic residues from silicon/glass. | 3:1 ratio (v/v), prepared fresh. |
| Laminar Flow Hood/Clean Bench | Provides a particle-controlled workspace for substrate cleavage and sample deposition. | ISO Class 5 (Class 100) or better. |
Validation of Cleanliness: Control Experiments
6.1 Negative Imaging Controls
- Protocol: Deposit filtered buffer only (no protein) onto a freshly prepared substrate. Process identically to protein samples (rinse, dry). Image multiple areas via AFM.
- Expected Result: Featureless background with root-mean-square (RMS) roughness <0.2 nm for mica, <0.3 nm for silicon. Any discrete features indicate substrate or buffer contamination.
6.2 Quantitative Contamination Assessment Perform AFM scans on control substrates and analyze:
| Control Type | AFM Analysis Metric | Acceptance Criterion |
|---|---|---|
| Buffer-Only Control | Density of particulate features (>1 nm height) | < 0.1 features per µm² |
| Substrate Roughness | RMS Roughness (Rq) over 5x5 µm scan | Mica: Rq < 0.2 nm; Si: Rq < 0.3 nm |
| Protein Monomer Control | Height distribution of adsorbed species | Primary peak within 10% of expected monomer diameter. |
Optimizing Scan Parameters for Delicate Oligomers and Heterogeneous Aggregates
Application Notes and Protocols
Thesis Context: This document provides critical methodological support for a doctoral thesis investigating protein aggregation mechanisms and amyloid fibril formation using Atomic Force Microscopy (AFM). The reliable imaging of transient oligomeric species and heterogeneous aggregates is paramount for elucidating early-stage aggregation pathways, a core objective of the thesis.
Imaging protein oligomers and early aggregates with Atomic Force Microscopy presents unique challenges. These species are often low in height (1-5 nm), mechanically delicate, and adsorbed to substrates with weak adhesion. Standard imaging parameters can induce deformation, displacement, or complete removal of the structures of interest. This protocol details the optimization of scan parameters to preserve sample integrity while maximizing resolution for accurate morphological analysis, directly contributing to the thesis's aim of characterizing pre-fibrillar aggregates.
Key Parameter Optimization and Quantitative Data
Optimal parameters are a balance between resolution and force minimization. The following table summarizes target values for imaging delicate protein samples in air or liquid.
Table 1: Optimized AFM Scan Parameters for Delicate Protein Aggregates
| Parameter | Target Value (Air) | Target Value (Liquid) | Rationale |
|---|---|---|---|
| Scanning Mode | Intermittent Contact (AC) | Tapping Mode (AC) or PeakForce Tapping | Minimizes lateral shear forces. PeakForce Tapping provides precise force control. |
| Setpoint Ratio (A/A₀) | 0.85 - 0.95 | 0.90 - 0.98 | High setpoint minimizes tip-sample interaction force. |
| Drive Amplitude | 0.3 - 0.6 V | 50 - 150 mV | Lower amplitude reduces energy imparted to the sample. |
| Scan Rate | 0.5 - 1.0 Hz | 0.8 - 1.5 Hz | Slower scanning reduces disturbance and improves signal-to-noise on soft features. |
| Integral Gain | 0.2 - 0.4 | 0.3 - 0.5 | Sufficient for stability but avoids high-force feedback oscillations. |
| Proportional Gain | 0.4 - 0.6 | 0.5 - 0.7 | Fine-tunes response to topography changes. |
| Tip Geometry | Super-sharp silicon tip (tip radius < 10 nm) | Silicon Nitride tip (sharp, low spring constant) | Sharp tips improve resolution; lower spring constant (0.1-0.4 N/m in liquid) reduces indentation. |
| PeakForce Setpoint | N/A | 50 - 200 pN | Directly controls the maximum applied force; essential for soft samples. |
Experimental Protocol for Imaging Oligomeric Species
Title: Protocol for AFM Sample Preparation and Imaging of Protein Oligomers.
Materials:
- Purified protein of interest (e.g., Aβ42, α-synuclein, insulin).
- Appropriate buffer (e.g., PBS, Tris-HCl, ammonium bicarbonate).
- Freshly cleaved muscovite mica (V1 grade).
- AFM suitable for tapping mode in liquid (e.g., Bruker Dimension FastScan, Cypher ES).
- Sharp AFM probes (e.g., Bruker ScanAsyst-Fluid+, Olympus Biolever Mini).
Procedure:
A. Sample Preparation (In a humidity chamber to prevent evaporation):
- Prepare a 1-10 µM protein solution in desired buffer and incubate to form oligomers (time and conditions are protein-specific).
- Cleave mica disk with adhesive tape to obtain a fresh, atomically flat surface.
- Deposit 20-30 µL of the protein solution onto the mica surface.
- Incubate for 5-10 minutes to allow adsorption.
- Gently rinse the surface with 5 x 1 mL aliquots of ultrapure water (for air imaging) or filtered imaging buffer (for liquid imaging) to remove unbound protein and salts. Blot edge with clean filter paper; do not let surface dry if proceeding to liquid imaging.
- For air imaging: Dry the sample under a gentle stream of argon or nitrogen.
B. AFM Imaging Setup and Optimization:
- Mount the sample on the AFM stage. For liquid imaging, engage the fluid cell carefully to avoid bubbles.
- Mount a sharp, clean tip appropriate for the medium.
- Engage the tip far from the deposited sample area.
- Initial Parameter Setting: Use values from Table 1 as starting points.
- Fine-Tuning:
- For Tapping Mode: Engage with a high setpoint ratio (0.98). After engagement, slowly lower the setpoint until a stable trace-retrace loop is observed with minimal phase contrast shift. If the tip loses track, increase the setpoint.
- For PeakForce Tapping: Start with a low PeakForce Setpoint (50 pN). Gradually increase until topography features are clear but no deformation is observed in successive scans.
- Adjust gains to ensure the error signal is minimal without oscillating.
- Reduce scan rate until lines are not distorted.
- Scan multiple areas (minimum 5) at different locations to assess sample heterogeneity and rule out imaging artifacts.
Visualization of Workflow and Parameter Logic
Title: AFM Parameter Optimization Workflow for Delicate Samples
The Scientist's Toolkit: Research Reagent Solutions
Table 2: Essential Materials for AFM-Based Oligomer Imaging Studies
| Item | Function & Rationale |
|---|---|
| Muscovite Mica (V1 Grade) | Provides an atomically flat, negatively charged surface for homogeneous protein adsorption. Easily cleavable for a clean substrate. |
| Ultra-Sharp Silicon AFM Tips (e.g., RTESPA-150) | Tips with a nominal radius < 10 nm provide high spatial resolution necessary to resolve small oligomeric structures (2-5 nm). |
| Silicon Nitride Fluid Tips (e.g., SNL, ScanAsyst-Fluid+) | Low spring constant (0.1-0.7 N/m) minimizes indentation force on soft samples in liquid. Integrated cantilevers simplify alignment. |
| PeakForce Tapping Capable AFM | Enables direct, quantitative control of the maximum force applied per tap (pN level), crucial for imaging without deformation. |
| Vibration Isolation Enclosure | Essential for achieving high-resolution imaging by isolating the AFM from environmental acoustic and floor vibrations. |
| Pre-Filtered Buffers (0.02 µm filtered) | Removes particulate contaminants that can be mistaken for aggregates or damage the AFM tip during scanning. |
| Humidity Control Chamber | Critical for preparing air-imaged samples under controlled humidity to prevent salt crystallization and control drying artifacts. |
Handling Challenges with Sticky Samples and Non-Specific Adsorption
Within the broader thesis on Atomic Force Microscopy (AFM) for the study of protein aggregation and amyloid fibril formation, a paramount methodological challenge is the reliable and artifact-free immobilization of samples onto substrates. Sticky samples (e.g., pre-fibrillar aggregates, hydrophobic peptides) and pervasive non-specific adsorption (NSA) of non-target biomolecules can severely compromise data integrity, leading to false positives in aggregation kinetics, erroneous height measurements, and obscured fibril morphology. This document outlines application notes and detailed protocols to mitigate these issues, ensuring high-fidelity AFM imaging for quantitative biophysical research and drug discovery screening.
Core Challenges & Quantitative Impact
The following table summarizes common artifacts introduced by sticky samples and NSA, alongside their quantitative impact on AFM data, as established in recent literature.
Table 1: Quantitative Impact of Immobilization Artifacts on AFM Protein Aggregation Studies
| Artifact Type | Primary Cause | Effect on AFM Data | Typical Measurable Error | Consequence for Study |
|---|---|---|---|---|
| Sample Over-Aggregation on Surface | High surface hydrophobicity/charge of substrate or sample. | Clustering during adsorption; overestimation of aggregate size/frequency. | Aggregate height inflated by 20-50%; particle count skewed by >100%. | Misinterpretation of early oligomer formation; false drug efficacy. |
| Non-Specific Protein Background | Adsorption of serum proteins or non-target monomers from impure solutions. | High, noisy baseline; obscured fine fibril structures. | RMS roughness increase from <0.2 nm to >1 nm on mica. | Inability to resolve single fibrils or short protofibrils. |
| Inconsistent Adhesion / Sample Loss | Inadequate surface functionalization or inappropriate buffer conditions. | Patchy coverage; fibrils detached during scanning. | >70% sample loss in liquid vs. air imaging. | Non-representative statistics; failed time-course experiments. |
| Tip Contamination & Sample Pick-up | Adhesive interactions between tip and sample. | Streaking, double imaging, degraded resolution. | Tip radius increase from 10 nm to >50 nm mid-scan. | Unusable images; expensive tip replacement. |
Optimized Experimental Protocols
Protocol 1: Functionalization of Mica with APTES for Controlled Hydrophilicity
Objective: Create a reproducible, moderately hydrophilic surface using (3-Aminopropyl)triethoxysilane (APTES) to immobilize sticky amyloidogenic peptides without over-aggregation.
- Materials: Freshly cleaved muscovite mica discs, 2% APTES in anhydrous toluene, anhydrous toluene, absolute ethanol, nitrogen stream.
- Procedure: a. In a nitrogen-purged glovebox, place freshly cleaved mica in a glass dish. b. Incubate in 2% APTES solution for 20 minutes. c. Rinse thoroughly with anhydrous toluene (3 x 2 min), then absolute ethanol (2 x 2 min). d. Dry under a gentle stream of nitrogen. e. Cure the functionalized surface at 110°C for 10 minutes. f. Use immediately or store in a vacuum desiccator for up to 1 week.
- Key Note: This method generates a stable amine-terminated surface with a controlled contact angle (~40-50°), reducing the driving force for hydrophobic collapse of sticky aggregates compared to bare mica.
Protocol 2: Passivation with Blocking Agents to Minimize NSA
Objective: Passivate the substrate and AFM tip to prevent adsorption of non-target proteins, crucial for studies in complex fluids (e.g., cerebrospinal fluid, cell lysates).
- Materials: Functionalized substrate (from Protocol 1 or plain mica), passivation agent (e.g., 1% Bovine Serum Albumin (BSA), 0.1 mg/ml Pluronic F-127, or 1% casein), imaging buffer (e.g., PBS or Tris-HCl).
- Procedure: a. After sample adsorption (typically 5-10 min), gently rinse the substrate with 200 µL of imaging buffer to remove loosely bound material. b. Immediately incubate with 100 µL of chosen passivation solution for 15 minutes at room temperature. c. Rinse gently but thoroughly with 3 x 200 µL of imaging buffer before placing in AFM fluid cell. d. For tip passivation, immerse the cantilever in the passivation solution for 10 min, then rinse in buffer.
- Selection Guide: Use BSA for general purposes; Pluronic F-127 for highly hydrophobic surfaces/aggregates; casein for phosphorylated systems.
Protocol 3: In-Situ Chemical Force Microscopy (CFM) for Adhesion Quantification
Objective: Directly measure the adhesion force between a functionalized AFM tip and the sample to diagnostically assess "stickiness" and optimize immobilization chemistry.
- Materials: AFM with fluid cell, cantilevers (spring constant ~0.1 N/m), functionalization chemistry (e.g., COOH- or CH3-terminated thiols for gold-coated tips).
- Procedure: a. Functionalize AFM tip with a model chemical group (e.g., methyl to mimic hydrophobic interactions). b. In relevant buffer, acquire force-distance curves (≥256 per point) on the substrate and on adsorbed aggregates. c. Analyze the retraction curve to quantify the maximum adhesion force (F_adh) and work of adhesion. d. Compare F_adh for different surface treatments (e.g., bare mica vs. APTES-mica vs. passivated APTES-mica).
- Data Use: A successful immobilization protocol will show strong, discrete adhesion on target aggregates but very low, uniform adhesion on the surrounding substrate.
Research Reagent Solutions Toolkit
Table 2: Essential Materials for Managing Sticky Samples and NSA
| Reagent / Material | Function & Mechanism | Application Context |
|---|---|---|
| Freshly Cleaved Muscovite Mica | Atomically flat, negatively charged substrate. | Baseline substrate for most protein studies; requires modification for sticky samples. |
| (3-Aminopropyl)triethoxysilane (APTES) | Forms amine-rich monolayer; tunes surface energy & charge. | Creates a consistently moderately hydrophilic surface to control adsorption kinetics. |
| Pluronic F-127 (Triblock Copolymer) | Adsorbs via hydrophobic blocks, exposing hydrophilic PEO chains to solution. | Excellent passivation against NSA; particularly effective for hydrophobic aggregates (e.g., Aβ42). |
| Poly-L-Lysine (PLL) | Provides a dense, positive charge for electrostatic immobilization. | For samples that are negatively charged or where strong anchoring is needed (can increase NSA). |
| BSA (Fraction V) | Inert protein that adsorbs to vacant sites, blocking further NSA. | Universal, cost-effective blocker for substrates and fluid cells in routine experiments. |
| Piranha Solution (H2SO4:H2O2) | Powerful oxidizer that removes organic contaminants. | CAUTION: For deep cleaning of silicon substrates and tips. Not for mica. |
| Ni-NTA Functionalized Substrates | Provides specific, His-tag mediated immobilization. | For recombinant His-tagged proteins; dramatically reduces NSA by targeting. |
| Chemical Force Microscopy (CFM) Kits | Tips functionalized with specific chemical groups (COOH, CH3, OH). | Diagnose interaction forces to rationally design surface chemistry. |
Workflow and Pathway Diagrams
Title: Decision Workflow for Optimizing Sample Immobilization
Title: Strategy Map for Tackling Sticky Samples and NSA
This application note addresses the critical need for statistical rigor in Atomic Force Microscopy (AFM) studies of protein aggregation and amyloid fibril formation. The inherently heterogeneous nature of these biological samples, combined with the high-resolution, small-area imaging typical of AFM, poses significant risks of sampling bias and underpowered analyses. Within the broader thesis on leveraging AFM for mechanistic and therapeutic discovery in protein misfolding diseases, this document provides a practical framework for designing robust experiments, calculating adequate sample sizes, and implementing protocols for representative imaging. These principles are essential for generating reliable, reproducible data suitable for publication and informing drug development pipelines.
Core Principles & Quantitative Benchmarks
Determining Sufficient Sample Size (n)
The required number of independent biological replicates (e.g., separate protein preparation and aggregation experiments) and technical replicates (e.g., multiple AFM scans from one sample) depends on the expected effect size and data variability. Use a priori power analysis.
Table 1: Guidelines for Sample Size Based on Common AFM Metrics
| AFM Measurement | Typical Coefficient of Variation (CV) | Recommended Minimum Independent Replicates (n) | Key Statistical Test |
|---|---|---|---|
| Fibril Height (Diameter) | 10-15% | 6-8 | Unpaired t-test / ANOVA |
| Fibril Length Distribution | 25-40% | 10-12 | Kolmogorov-Smirnov / Mann-Whitney U |
| Surface Roughness (Rq) | 15-30% | 8-10 | Unpaired t-test |
| Particle (Oligomer) Count | 35-50% | 12-15 | Chi-square / Poisson regression |
| Modulus (Nanomechanics) | 20-35% | 9-12 | Unpaired t-test |
Note: These are general guidelines. A formal power calculation (see Protocol 2.1) is mandatory for each study.
Ensuring Representative Imaging
A single 5x5 µm AFM image captures only a minuscule fraction of a deposited sample. Systematic sampling is required.
Table 2: Protocol for Representative AFM Image Acquisition
| Parameter | Recommended Specification | Rationale |
|---|---|---|
| Minimum Scan Area | Start with 10x10 µm | Captures fibril network heterogeneity. |
| Number of Fields per Sample | ≥ 9 fields, randomly selected | Reduces field-selection bias. |
| Total Sampled Area per Condition | ≥ 5000 µm² (e.g., 5 images at 10x10 µm) | Provides a population for statistical morphology analysis. |
| Image Resolution | 512 x 512 or 1024 x 1024 pixels | Balances detail, scan time, and file size. |
| Verification Step | Low-magnification optical microscopy (if equipped) | To pre-identify and avoid gross artifacts or empty regions. |
Experimental Protocols
Protocol 3.1: A Priori Power Analysis for AFM Experiments
Objective: To calculate the required sample size (n) before data collection. Materials: Statistical software (e.g., G*Power, R, Python). Procedure:
- Define Primary Metric: Select one key quantitative output (e.g., mean fibril height).
- Estimate Effect Size: From pilot data or literature, determine the minimum difference you need to detect (e.g., 1 nm height change due to a drug).
- Estimate Variability: Calculate the standard deviation (SD) for your metric from pilot data.
- Set Statistical Parameters:
- Significance level (α): Typically 0.05.
- Power (1-β): Typically 0.8 or 0.9.
- Perform Calculation: Use software to input α, power, effect size, and SD. The output is the required n per experimental group.
- Adjust for AFM: Multiply the calculated n by a factor of 1.2-1.5 to account for potential sample loss or poor scan quality.
Protocol 3.2: Systematic Random Imaging for Representative Sampling
Objective: To acquire AFM images without operator selection bias. Materials: AFM with motorized X-Y stage, sample substrate (e.g., mica), grid template or software control. Procedure:
- Define Imaging Grid: Mentally superimpose a 3x3 grid over your sample substrate (e.g., 10mm disc).
- Randomize Starting Point: Use a random number generator to select the first grid cell to image.
- Acquire Images: Engage the AFM tip and acquire a large-area scan (e.g., 10x10 µm) in the selected field.
- Systematic Traversal: Move the stage to the next predetermined, non-adjacent field (e.g., a "random walk" or pre-defined pattern) to avoid correlated neighboring areas.
- Repeat: Continue until the target number of fields (≥9) is imaged. If the tip crashes, replace it and resume the pattern.
- Document: Record the X-Y stage coordinates of each acquired image.
Protocol 3.3: Automated Image Analysis for Population Metrics
Objective: To extract unbiased quantitative data from multiple AFM images. Materials: AFM images, image analysis software (e.g., Gwyddion, Gatan DigitalMicrograph, custom Python/ImageJ scripts). Procedure:
- Batch Processing: Apply identical flattening and filtering steps to all images.
- Thresholding: Use an automated, consistent algorithm (e.g., Otsu's method) to identify fibrils/particles from the background.
- Feature Analysis: For each image, run automated analysis to extract:
- Morphology: Height, length, width (via particle analysis or line profiling).
- Abundance: Number of fibrils/oligomers per unit area.
- Organization: Persistence length, network density.
- Data Pooling: Aggregate data from all images of the same biological replicate into a single population.
- Statistical Reporting: Report the mean ± standard deviation for the population from each replicate, not the mean of image averages.
Visualization of Workflows and Relationships
Title: Statistical Rigor Workflow for AFM Studies
Title: AFM Statistical Pitfalls and Solutions
The Scientist's Toolkit: Research Reagent Solutions
Table 3: Essential Materials for Statistically Rigorous AFM Protein Aggregation Studies
| Item | Function & Rationale | Example Product/ Specification |
|---|---|---|
| Muscovite Mica Discs (V1 Grade) | Provides an atomically flat, negatively charged surface for reproducible protein adsorption. Essential for consistent imaging. | 10mm or 12mm diameter discs. |
| APTES ((3-Aminopropyl)triethoxysilane) | Functionalizes surfaces (e.g., mica, glass) with amine groups to promote stronger, more uniform adhesion of fibrils, reducing drift. | 99% purity, anhydrous. |
| Calibrated AFM Tip Check Sample | A grating or nanoparticle sample used to regularly verify tip sharpness and imaging resolution. Prevents analysis of artifacts from worn tips. | TGT1 or STR calibration grating. |
| Motorized AFM Stage | Enables precise, repeatable movement to pre-defined coordinates for systematic random imaging. | Stage with ± 1 µm accuracy. |
| Image Analysis Software with Batch Processing | Allows automated, consistent analysis of hundreds of images, eliminating manual measurement bias. | Gwyddion (open source), SPIP. |
| Statistical Power Analysis Software | Calculates the required sample size before the experiment begins, ensuring the study is adequately powered. | G*Power (free), R (pwr package). |
Correlating AFM Data: Validating Findings with Complementary Biophysical Techniques
This Application Note details the integration of Atomic Force Microscopy (AFM) and Electron Microscopy (EM) for the structural analysis of protein aggregates and amyloid fibrils. Within the thesis context of advancing AFM for protein aggregation research, this document establishes EM as a critical cross-validation tool. We provide detailed protocols and comparative data to guide researchers in leveraging the synergistic strengths of these techniques for robust, high-resolution structural biology in drug discovery.
The study of protein aggregation and amyloid fibril formation demands techniques that provide high-resolution structural information under diverse conditions. While AFM excels in topographic imaging under physiological buffers and measuring nanomechanical properties, its lateral resolution is limited by tip geometry. Transmission Electron Microscopy (TEM), particularly negative stain and cryo-EM, provides superior resolution for visualizing fibril ultrastructure, protofilament twisting, and periodic cross-β stacking. This cross-validation framework is essential for confirming structural models, eliminating imaging artifacts, and building a definitive understanding of aggregation pathways—a cornerstone for therapeutic development.
Comparative Strengths of AFM and EM
Table 1: Quantitative Comparison of AFM and EM for Amyloid Fibril Analysis
| Feature | Atomic Force Microscopy (AFM) | Electron Microscopy (EM - Negative Stain) | Cryo-Electron Microscopy (Cryo-EM) |
|---|---|---|---|
| Resolution (Typical) | ~1 nm vertical; ~5-20 nm lateral | ~1-2 nm | ~3-5 Å for fibrils (near-atomic) |
| Sample Environment | Liquid (physiological buffers), air, vacuum | High vacuum | Vitrified ice (near-native) |
| Sample Preparation | Adsorption to mica/substrate; minimal processing | Negative staining (uranyl acetate) on carbon grid | Rapid vitrification on EM grid |
| Key Measurable Parameters | Height, length, mechanical properties (elasticity, adhesion), aggregation kinetics | Fibril width, periodicity, helical twist, morphology classification | 3D structure, protofilament arrangement, subunit interface |
| Throughput | Medium (single images); High for force spectroscopy mapping | High (multiple particles/grid) | Medium-High (automated data collection) |
| Main Artifact Risks | Tip convolution, sample deformation by tip | Stain deposition artifacts, flattening, fibril fragmentation | Preferred orientation, ice thickness limitations |
Experimental Protocols for Cross-Validation
Protocol 3.1: Correlative AFM and Negative Stain TEM on Aβ(1-42) Fibrils
Objective: To correlate fibril morphology and dimensions from the same sample batch using AFM in liquid and negative stain TEM.
Materials:
- Purified Aβ(1-42) fibrils (incubated for 48h at 37°C under quiescent conditions).
- Freshly cleaved mica discs (for AFM).
- Carbon-coated 400-mesh copper TEM grids.
- 2% (w/v) Uranyl acetate stain solution, pH 4.5.
- AFM with liquid cell and silicon nitride cantilevers (nominal spring constant 0.1 N/m).
- 120 kV Transmission Electron Microscope.
Procedure:
- Sample Split: Divide the 100 µL Aβ fibril sample into two 50 µL aliquots (A for AFM, B for TEM).
- AFM Sample Prep (Aliquot A):
- Deposit 10 µL of fibril solution onto freshly cleaved mica.
- Incubate for 5 minutes.
- Gently rinse with 1 mL of filtered 10 mM HEPES buffer, pH 7.4, to remove unbound protein.
- Add 100 µL of the same buffer to the liquid cell.
- AFM Imaging: Engage in contact or tapping mode in fluid. Acquire 10×10 µm² overview scans followed by 2×2 µm² high-resolution scans.
- Negative Stain TEM Sample Prep (Aliquot B):
- Glow-discharge TEM grid for 30 seconds to increase hydrophilicity.
- Apply 5 µL of fibril solution to the grid, wait 60 seconds.
- Wick away excess liquid with filter paper.
- Immediately apply 10 µL of 2% uranyl acetate, wait 45 seconds.
- Wick away stain and air-dry for 5 minutes.
- TEM Imaging: Insert grid into microscope. Acquire images at 40,000-80,000x magnification using low-dose procedures.
Protocol 3.2: Cryo-EM Grid Preparation for High-Resolution Fibril Structure
Objective: Prepare vitrified amyloid fibril samples for single-particle analysis or helical reconstruction.
Materials:
- Quantifoil R1.2/1.3 or UltrAufoil gold grids.
- Vitrobot Mark IV (or equivalent plunge freezer).
- Liquid ethane.
- Filter paper (grade 595).
Procedure:
- Grid Preparation: Glow-discharge grid for 60 seconds at 15 mA.
- Loading: Apply 3 µL of fibril sample (≥ 0.1 mg/mL) onto the grid in the Vitrobot chamber (100% humidity, 4°C).
- Blotting: After a 30-second incubation, blot from both sides for 3-4 seconds with force level -5 to -10.
- Plunge-Freezing: Immediately plunge the grid into liquid ethane cooled by liquid nitrogen.
- Storage: Transfer grid under liquid nitrogen to a storage box for subsequent Cryo-EM data collection.
Synergistic Workflow for Structural Validation
Diagram Title: Cross-Validation Workflow for Amyloid Fibril Analysis
The Scientist's Toolkit: Key Reagent Solutions
Table 2: Essential Research Reagents and Materials
| Item | Function & Rationale |
|---|---|
| Freshly Cleaved Mica (Muscovite) | Atomically flat, negatively charged substrate for AFM. Promotes even adsorption of protein aggregates for reliable height measurement. |
| Uranyl Acetate (2% aqueous) | High-contrast, heavy metal negative stain for TEM. Surrounds and outlines fibrils, revealing ultrastructure without penetrating the dense β-sheet core. |
| Glow Discharger | Treats carbon EM grids with a plasma charge, making them hydrophilic. Ensures even sample spread and reduces aggregation during blotting. |
| HEPES Buffer (10 mM, pH 7.4) | Standard non-nucleating buffer for handling amyloidogenic proteins in AFM fluid cells. Maintains physiological pH with minimal salt artifacts. |
| Liquid Ethane | Cryogen for rapid vitrification in Cryo-EM. Its high heat capacity enables cooling rates fast enough to prevent crystalline ice formation, preserving native structure. |
| Silicon Nitride AFM Cantilevers (Sharp tip) | For high-resolution imaging in liquid. Low spring constant minimizes sample deformation. Sharp tip radius improves lateral resolution. |
| Quantifoil Holey Carbon Grids | Standard Cryo-EM support. The regular holes provide areas of unsupported vitrified ice ideal for imaging, minimizing background. |
The deliberate cross-validation of AFM data with EM establishes a gold standard in protein aggregation research. For the thesis focusing on AFM methodologies, EM provides the essential, high-resolution structural benchmark. This synergy not only validates AFM findings but also significantly enriches the structural model, directly informing the rational design of aggregation inhibitors and diagnostics in neurodegenerative disease drug development.
Within the broader thesis on Atomic Force Microscopy (AFM) for studying protein aggregation and amyloid fibrils, integrating AFM’s nanoscale topographic data with complementary spectroscopic techniques is paramount. This multidimensional approach validates findings and provides a comprehensive view of aggregation kinetics, structural evolution, and fibril morphology. These integrated Application Notes and Protocols detail the synergistic use of AFM with Thioflavin T (ThT) fluorescence, Fourier-Transform Infrared (FTIR), and Circular Dichroism (CD) spectroscopy.
Core Synergies and Data Integration
| Technique | Primary Information | Complementarity with AFM | Key Quantitative Outputs |
|---|---|---|---|
| ThT Fluorescence | Kinetic profile of fibril formation; lag time, growth rate. | Correlates temporal aggregation states with AFM topography snapshots (oligomers, protofibrils, mature fibrils). | Lag time (Tlag), Apparent growth rate (kapp), Maximum fluorescence (Fmax). |
| FTIR Spectroscopy | Secondary structure evolution; β-sheet content, parallel/antiparallel arrangement. | Validates structural assignments of morphologies seen by AFM (e.g., confirming β-sheet-rich fibrils). | Amide I band peak position (cm-1), % β-sheet from deconvolution. |
| CD Spectroscopy | Solution-phase secondary structure changes; α-helix to β-sheet transition. | Provides solution-state context for AFM samples deposited on substrates; monitors early conformational changes. | Mean residue ellipticity [θ] (deg·cm2·dmol-1), % secondary structure estimates. |
Detailed Experimental Protocols
Protocol 1: Integrated AFM & ThT Fluorescence Kinetics
Aim: To correlate real-time aggregation kinetics with fibril morphology at key time points. Materials: Purified protein (e.g., Aβ42, α-synuclein), ThT stock solution, buffer, 96-well plate (black, clear bottom), plate reader with fluorescence capability, AFM with tapping mode capability, freshly cleaved mica. Procedure:
- Prepare protein solution in aggregation buffer (e.g., PBS, pH 7.4, with 0.02% NaN3).
- Add ThT to a final concentration of 20 µM. Aliquot into multiple wells.
- ThT Assay: Incubate plate at 37°C in a plate reader. Measure fluorescence (λex = 440 nm, λem = 482 nm) every 10-15 minutes with orbital shaking before each read. Run in quadruplicate.
- AFM Sampling: From a parallel, non-ThT-containing aggregation reaction, extract aliquots at critical kinetic phases: (i) during lag phase, (ii) at onset of fluorescence increase, (iii) during growth phase, (iv) at plateau.
- AFM Sample Prep: For each aliquot, dilute 10-20 µL into appropriate buffer (e.g., 50-100 µL of 10 mM HEPES, pH 7.4) to reduce salt. Deposit 10 µL onto freshly cleaved mica for 2 minutes. Rinse gently with ultrapure water and dry under a gentle stream of nitrogen or argon.
- AFM Imaging: Acquire images in tapping mode in air using high-resolution probes (e.g., RTESPA-300, Bruker). Scan multiple 5x5 µm and 1x1 µm areas.
- Data Correlation: Overlay AFM topographies (height, phase) with the corresponding time points on the ThT kinetic curve.
Protocol 2: AFM and FTIR for Structural Validation
Aim: To confirm the β-sheet structure of fibrils imaged by AFM. Materials: Aggregated protein sample, buffer exchange system (e.g., centrifugal filters), D2O-based buffer, FTIR spectrometer with ATR accessory, AFM as above. Procedure:
- Generate mature fibrils via incubation (e.g., 37°C, 300 rpm, 24-72 hrs).
- Buffer Exchange: Exchange aggregation buffer to D2O buffer via multiple centrifugation/resuspension cycles to minimize H2O interference in Amide I region.
- FTIR Measurement: Load ~50 µL of sample onto the ATR crystal. Acquire spectra (e.g., 256 scans, 4 cm-1 resolution). Subtract buffer background. Deconvolute the Amide I band (1600-1700 cm-1) using appropriate software (e.g., OPUS, GRAMS) to quantify secondary structure components.
- AFM Imaging: In parallel, deposit an aliquot of the same fibril sample onto mica (as in Protocol 1, step 5) for AFM characterization.
- Data Correlation: Compare the dominant FTIR peak (typically ~1625-1635 cm-1 for amyloid β-sheets) with AFM fibril dimensions (height, periodicity).
Protocol 3: AFM and CD for Early Conformational Analysis
Aim: To link early secondary structure changes in solution with early oligomeric species observed by AFM. Materials: Purified protein, far-UV CD quartz cuvette (0.1 cm pathlength), CD spectropolarimeter, AFM. Procedure:
- Prepare protein at optimal concentration (e.g., 0.1-0.2 mg/mL in low-absorbance buffer).
- CD Time Course: Acquire spectra (e.g., 190-260 nm) immediately after preparation (t=0) and at regular intervals during aggregation. Monitor the loss of α-helical/minimum at ~222 nm and/or gain of β-sheet signature.
- AFM Sampling: At the t=0 and early time points (e.g., 1, 3, 6 hours), take aliquots for AFM sample preparation (as in Protocol 1, step 5), using minimal perturbation.
- Data Correlation: Compare the CD spectral evolution with the appearance of oligomers and protofibrils in AFM images.
The Scientist's Toolkit: Key Research Reagents & Materials
| Item | Function/Application |
|---|---|
| Thioflavin T (ThT) | Fluorescent dye that binds specifically to cross-β-sheet structure, enabling real-time monitoring of amyloid fibril formation kinetics. |
| Freshly Cleaved Mica | Atomically flat, negatively charged substrate ideal for adsorbing protein aggregates for high-resolution AFM imaging in air or liquid. |
| Silicon AFM Probes (Tapping Mode) | High-resolution tips (e.g., RTESPA-300, NSC15) for imaging delicate protein aggregates without excessive sample displacement. |
| D2O-based Buffers | Used for FTIR sample preparation to shift the solvent absorption band away from the protein-sensitive Amide I region (~1600-1700 cm-1). |
| Low-Binding Microcentrifuge Tubes | Minimizes loss of protein aggregates, especially fibrils, to tube walls during sample handling and buffer exchange. |
| Far-UV Quartz Cuvette (0.1 cm pathlength) | Allows accurate measurement of protein secondary structure in the 190-260 nm wavelength range by CD spectroscopy. |
Experimental Workflow and Data Correlation Diagrams
Title: Integrated Workflow for AFM and Spectroscopy in Aggregation Studies
Title: ThT Kinetic Phases Linked to AFM Morphology
1.0 Introduction & Thesis Context Within the broader thesis exploring Atomic Force Microscopy (AFM) as a pivotal tool for studying protein aggregation kinetics, polymorphism, and the structural landscape of amyloid fibrils, a critical gap exists in linking these nanoscale morphological features directly to biological toxicity. This document provides application notes and protocols for establishing quantitative correlations between AFM-derived structural parameters and endpoints from cell-based viability assays, thereby bridging structure and function in amyloid research.
2.0 Quantitative Correlation Data Summary Key structural parameters obtained from AFM imaging are statistically analyzed against cytotoxicity metrics. The following table summarizes typical correlative data from model amyloid-forming systems (e.g., Aβ42, α-synuclein).
Table 1: Correlation of AFM Structural Parameters with Cell Viability (MTT Assay)
| Protein System | AFM Morphological Parameter | Measurement | Cell Line | Correlation Coefficient (r) with Viability | p-value | Key Inference |
|---|---|---|---|---|---|---|
| Aβ42 oligomers | Aggregate Height | 2.5 ± 0.5 nm | SH-SY5Y | -0.92 | <0.001 | Smaller oligomer height strongly correlates with high toxicity. |
| Aβ42 fibrils | Fibril Length | >1 μm | SH-SY5Y | -0.45 | 0.03 | Fibril length shows a weak inverse correlation with viability. |
| α-synuclein | Surface Roughness (Rq) | 1.8 ± 0.3 nm | PC12 | -0.87 | <0.001 | Higher surface roughness of aggregates correlates with increased toxicity. |
| Lysozyme fibrils | Persistence Length | 150 ± 20 nm | HEK293 | 0.78 | <0.005 | Greater fibril rigidity (high persistence length) correlates with lower toxicity. |
| Insulin fibrils | Branching Frequency | 0.8 branches/μm | HeLa | -0.91 | <0.001 | Increased fibril network branching strongly predicts cytotoxicity. |
3.0 Integrated Experimental Protocols
Protocol 3.1: Sample Preparation for AFM of Aggregated Protein Species Objective: To prepare homogeneous, adsorbed protein aggregates for high-resolution AFM imaging.
- Aggregation Induction: Incubate purified protein (e.g., 50 μM Aβ42 in PBS) at 37°C with constant agitation (600 rpm) for the desired time (e.g., 0-48 hrs).
- Substrate Preparation: Cleave a fresh mica disk (Ø 10 mm). Functionalize with 10 μL of 0.1% poly-L-lysine (PLL) for 10 min, then rinse with ultrapure water and dry under nitrogen.
- Sample Adsorption: Dilute aggregated protein sample 1:10 in appropriate buffer (e.g., ammonium acetate). Apply 20 μL to PLL-mica for 5 minutes.
- Washing: Gently rinse with 2 mL of ultrapure water to remove salts and unbound protein.
- Drying: Dry the sample under a gentle stream of nitrogen gas for 5 minutes. Critical Note: For oligomeric species, use minimal agitation and immediate deposition (within 1 min of dilution).
Protocol 3.2: AFM Imaging and Morphometric Analysis Objective: To acquire topographic images and extract quantitative morphological descriptors.
- Instrument Setup: Use an AFM in tapping mode in air. Employ a silicon tip (resonant frequency ~300 kHz, spring constant ~40 N/m).
- Image Acquisition: Scan multiple 5 μm x 5 μm and 1 μm x 1 μm areas at a resolution of 512 x 512 pixels. Maintain a scan rate of 0.5-1 Hz.
- Image Processing: Apply first-order flattening and plane subtraction using analysis software (e.g., Gwyddion, NanoScope Analysis).
- Parameter Extraction:
- Height/Diameter: Use cross-sectional analysis on individual particles/fibrils.
- Length: Trace the contour of linear aggregates.
- Surface Roughness (Rq): Calculate the root-mean-square roughness on a selected aggregate area.
- Branching Frequency: Count the number of branch points per unit length of fibril network.
- Statistical Analysis: Analyze data from ≥100 individual features across ≥3 independent samples.
Protocol 3.3: Parallel Cell Viability Assay (MTT) for Toxicity Assessment Objective: To quantitatively assess the cytotoxicity of the same aggregated protein samples imaged by AFM.
- Cell Culture: Plate SH-SY5Y neuroblastoma cells at 10,000 cells/well in a 96-well plate. Culture in complete medium for 24 hrs.
- Treatment: Prepare serial dilutions of the aggregated protein samples (from Protocol 3.1, step 1) in serum-free medium. Apply 100 μL/well to cells in triplicate. Include vehicle-only controls.
- Incubation: Incubate cells with aggregates for 24 hrs at 37°C, 5% CO₂.
- MTT Development: Add 10 μL of MTT reagent (5 mg/mL in PBS) per well. Incubate for 4 hrs.
- Solubilization: Carefully aspirate medium. Add 100 μL of DMSO to each well to dissolve formazan crystals.
- Absorbance Measurement: Shake plate gently for 10 min. Measure absorbance at 570 nm with a reference at 650 nm using a microplate reader.
- Data Analysis: Calculate cell viability as a percentage: (Mean Abssample / Mean Abscontrol) x 100%.
4.0 The Scientist's Toolkit: Research Reagent Solutions
Table 2: Essential Materials for Correlative AFM-Cell Assay Studies
| Item | Function/Description | Example Product/Catalog |
|---|---|---|
| Ultra-Flat Mica Substrates | Atomically flat surface essential for high-resolution AFM of adsorbed proteins. | Muscovite Mica V1, Ø 10mm, SPI Supplies |
| Poly-L-Lysine (PLL) Solution | Provides a positively charged coating on mica to enhance adhesion of protein aggregates. | 0.1% (w/v) PLL in water, Sigma-Aldrich P4707 |
| Silicon AFM Probes | Tapping mode tips for high-resolution imaging in air without sample destruction. | RTESPA-300, Bruker (k ~40 N/m, f₀ ~300 kHz) |
| Amyloid-beta (Aβ42) Peptide | Model amyloidogenic protein for aggregation and neurotoxicity studies. | Human Aβ42, rPeptide A-1002-2 (lyophilized) |
| Cell Viability Assay Kit | Reliable, colorimetric assay for quantifying metabolic activity (cytotoxicity). | MTT Cell Proliferation Assay Kit, Cayman Chemical 10009365 |
| Differentiated SH-SY5Y Cells | Human-derived neuroblastoma cell line, a standard model for neuronal toxicity studies. | ATCC CRL-2266 |
| Image Analysis Software | Open-source software for processing AFM data and extracting quantitative metrics. | Gwyddion (http://gwyddion.net/) |
5.0 Visualized Workflows and Relationships
Title: Integrated Workflow for Correlating AFM Morphology with Cell Viability
Title: Linking AFM Parameters to Toxicity Mechanisms and Assay Readouts
Benchmarking Against Super-Resolution and Single-Molecule Fluorescence Microscopy
Within a thesis investigating protein aggregation and amyloid fibril formation using Atomic Force Microscopy (AFM), benchmarking against optical microscopy techniques is essential. AFM provides topographical data at nanoscale resolution but lacks inherent biomolecular specificity. Super-resolution microscopy (SRM) and single-molecule fluorescence microscopy (SMFM) offer complementary strengths in specificity, dynamic imaging, and molecular counting. This application note details protocols for correlative and comparative studies, enabling researchers to leverage the synergistic potential of these technologies in neurodegenerative disease and drug development research.
Comparative Analysis: Capabilities and Quantitative Metrics
The choice of technique depends on the specific research question. The following table summarizes key performance metrics relevant to protein aggregation studies.
Table 1: Benchmarking of Techniques for Amyloid Fibril Analysis
| Parameter | Atomic Force Microscopy (AFM) | Super-Resolution Microscopy (e.g., STORM, PALM) | Single-Molecule Fluorescence (e.g., TIRF, smFRET) |
|---|---|---|---|
| Lateral Resolution | ~0.5-1 nm (in air) ~1-3 nm (in liquid) | 20-50 nm | Diffraction-limited (~250 nm) for localization; smFRET distance: 1-10 nm |
| Axial Resolution | <0.1 nm (height) | 50-100 nm | ~500 nm (TIRF); smFRET is insensitive to axial distance |
| Labeling Requirement | None (native samples) | High: Dense, photo-switchable fluorescent labels | High: Specific, photo-stable fluorescent labels (e.g., Cy3, Cy5) |
| Molecular Specificity | Indirect (via functionalization) | Direct via fluorescence | Direct via fluorescence; smFRET probes conformational dynamics |
| Key Measurable | Topography, stiffness, adhesion, assembly morphology | Protein localization, cluster size/density, nanoscale organization | Co-localization, stoichiometry, conformational states, kinetics of binding |
| Throughput | Low (single fibril/oligomer analysis) | Medium (100s of fibrils/field) | High (1000s of molecules/field) |
| Sample Environment | Air/Liquid (physiological buffers) | Liquid (imaging buffer with switching agents) | Liquid (oxygen-scavenging/blinking buffers) |
| Live-Cell Viability | Limited (surface-bound cells) | Good | Excellent |
| Primary Limitation | Slow scan speed, no inherent specificity | Special buffers, photobleaching, label size | Fluorophore photophysics, complex data analysis |
Integrated Experimental Protocols
Protocol 1: Correlative AFM and STORM for Amyloid Fibril Morphology and Composition
Aim: To correlate the nanoscale topography of amyloid fibrils with the spatial distribution of specific protein components (e.g., Aβ42, α-synuclein).
Materials (Research Reagent Solutions):
- Functionalized AFM Substrate: Muscovite mica (V1 grade), freshly cleaved and treated with (3-aminopropyl)triethoxysilane (APTES) to enhance fibril adhesion.
- Amyloid Fibril Sample: Purified protein fibrils (e.g., 10 µM Aβ42) incubated in PBS, pH 7.4, for 24-48 hours at 37°C.
- Labeling Solution: Primary antibody against target protein (e.g., anti-Aβ monoclonal 6E10), followed by secondary antibody conjugated to a photoswitchable dye (e.g., Alexa Fluor 647).
- STORM Imaging Buffer: Tris-HCl (pH 8.0) containing 50 mM mercaptoethylamine (MEA), 5% (w/v) glucose, 0.5 mg/mL glucose oxidase, and 40 µg/mL catalase to induce dye blinking.
- Imaging Medium for AFM: PBS or ammonium acetate buffer to prevent salt crystallization.
Methodology:
- Sample Preparation: Adsorb amyloid fibrils (10 µL, dilute suspension) onto APTES-mica for 10 minutes. Rinse gently with PBS.
- Immunolabeling: Fix sample with 4% paraformaldehyde (PFA) for 10 min. Permeabilize (if needed) with 0.1% Triton X-100. Block with 1% BSA. Incubate with primary antibody (1:500, 1 hour), wash, then incubate with Alexa Fluor 647-conjugated secondary antibody (1:1000, 45 min). Wash thoroughly.
- Correlative Imaging Workflow:
- Step A (Fluorescence Map): Mount sample in STORM buffer. Acquire a widefield fluorescence image to locate areas of interest. Perform STORM imaging (acquire 20,000-50,000 frames) to generate a super-resolution map of protein localization.
- Step B (Topographical Map): Carefully rinse the sample with PBS to remove STORM buffer salts. Exchange to AFM-compatible imaging medium. Using the fluorescence map as a guide, locate the same fibrils and acquire high-resolution AFM topography images in PeakForce Tapping mode.
- Data Analysis: Overlay STORM localization clusters with AFM height data using fiduciary markers (e.g., gold nanoparticles) or distinct fibril patterns. Correlate fluorescence intensity (protein density) with fibril height and morphology.
Protocol 2: Benchmarking Oligomer Size Distributions via AFM and smFRET
Aim: To compare the size and conformational heterogeneity of early amyloid oligomers using AFM (physical size) and smFRET (conformational distance).
Materials (Research Reagent Solutions):
- Dual-Labeled Protein: Target protein (e.g., tau) site-specifically labeled with donor (Cy3) and acceptor (Cy5) fluorophores for smFRET.
- Chromatography Resin: Size-exclusion chromatography (SEC) column (e.g., Superdex 75) for isolating oligomeric species.
- smFRET Imaging Buffer: PBS with 1% (w/v) β-mercaptoethanol or Trolox to reduce blinking and photobleaching.
- AFM Substrate: Ultra-flat template-stripped gold or silicon wafer for high-contrast oligomer imaging.
Methodology:
- Oligomer Generation: Incubate dual-labeled protein under aggregation-promoting conditions (e.g., with heparin for tau). Quench reaction at early time points (minutes to hours).
- Size Separation: Fractionate the aggregation mixture using SEC. Collect the oligomer-enriched fraction (eluting between monomer and fibril peaks).
- Parallel Measurement:
- AFM Path: Dilute an aliquot of the fraction and adsorb onto template-stripped gold. Image in air after gentle rinse and drying. Use particle analysis software to measure the height and volume of individual oligomers (>200 particles).
- smFRET Path: Dilute another aliquot in smFRET imaging buffer for single-molecule detection via TIRF microscopy. Acquire movies, identify single molecules, and calculate FRET efficiency (E) from donor and acceptor intensities for thousands of molecules.
- Benchmarking Analysis: Generate histograms: AFM oligomer height (nm) vs. smFRET efficiency (0-1). Correlate populations of similar height with distinct FRET states, identifying oligomer species with defined physical size and conformation.
Visualization of Workflows and Relationships
Title: Integrated Workflows for Correlative and Benchmarking Microscopy
Title: Technique Selection Logic for Protein Aggregation Studies
The Scientist's Toolkit: Essential Research Reagents
Table 2: Key Reagents for Integrated Microscopy Studies of Amyloids
| Reagent/Material | Function in Experiment | Key Consideration |
|---|---|---|
| Freshly Cleaved Mica | Atomically flat, negatively charged substrate for AFM sample adsorption. Ideal for imaging fibril structure. | Inert; may require functionalization (e.g., APTES) to improve adhesion of certain proteins. |
| Template-Stripped Gold | Ultra-smooth, molecularly flat substrate for high-contrast AFM of small oligomers and single molecules. | Provides consistent background, crucial for accurate height measurement of nano-objects. |
| Photoswitchable Dyes (Alexa Fluor 647, CF680) | Fluorophores for STORM/PALM. Can be cycled between fluorescent and dark states to achieve super-resolution. | Require specific chemical buffers (MEA, glucose oxidase) to control blinking kinetics. |
| smFRET Dye Pair (Cy3/Cy5, ATTO550/ATTO647N) | Donor and acceptor fluorophores for single-molecule FRET. Efficiency reports intramolecular distances (1-10 nm). | Requires site-specific protein labeling to ensure meaningful conformational data. |
| Oxygen Scavenging System (GlOx/Cat, PCA/PCD) | Critical component of SRM/SMFM buffers. Reduces photobleaching and dye blinking by removing oxygen. | Concentration must be optimized to balance dye longevity and imaging stability. |
| Size-Exclusion Chromatography (SEC) Columns | Separates monomeric, oligomeric, and fibrillar protein species by hydrodynamic radius. Isolates specific populations for analysis. | Essential for obtaining homogeneous oligomer samples for meaningful benchmarking. |
| Functionalization Reagents (APTES, NHS-PEG-Biotin) | Modifies substrate surface properties to control protein adsorption density and orientation for AFM or TIRF. | Minimizes non-specific binding and maintains protein functionality. |
The Role of AFM in a Multi-Technique Framework for Drug Candidate Screening
This application note is framed within a doctoral thesis investigating Atomic Force Microscopy (AFM) for the study of protein aggregation kinetics, oligomer populations, and amyloid fibril morphology. The central thesis posits that while AFM provides unparalleled nanoscale structural and mechanical data, its true power in drug candidate screening is unlocked only when integrated into a multi-technique framework. This approach correlates nanomechanical phenotypes with biochemical and cellular readouts, transforming AFM from a descriptive tool into a predictive platform for identifying and validating modulators of protein aggregation.
The Multi-Technique Framework: Rationale and Workflow
Screening for drugs targeting protein aggregation requires interrogation at multiple scales: from single-molecule interactions and oligomer formation to cellular toxicity and fibril dissolution. No single technique captures this spectrum.
Title: Multi-Technique Screening Workflow with AFM Integration
Key AFM Protocols for Drug Screening
Protocol 1: AFM Sample Preparation for Aggregation Time-Course
- Objective: To immobilize protein aggregates from different time points and treatment conditions for consistent AFM imaging.
- Materials: Freshly cleaved mica (V1 grade), 10-100 µM protein solution (incubated with/without candidate drug), 10 mM MgCl₂ or NiCl₂ solution, molecular biology-grade water, AFM fluid cell (if applicable).
- Procedure:
- Surface Functionalization: Pipette 20 µL of 10 mM MgCl₂ (for electrostatic adsorption) onto a freshly cleaved mica disc. Incubate for 2 min.
- Sample Adsorption: Gently rinse with 1 mL water to remove excess salt. Immediately apply 20 µL of the protein aggregation reaction mixture (typically diluted 10-50x in relevant buffer to minimize overcrowding). Incubate for 5-10 min.
- Washing: Rinse gently with 2 mL of filtered (0.02 µm) water or buffer to remove unbound protein and salts. Carefully dry under a gentle stream of nitrogen or argon.
- Storage: Store the prepared sample in a desiccator until imaging (preferably within 2-4 hours).
Protocol 2: Quantitative Morphological and Mechanical AFM Analysis
- Objective: To quantify drug-induced changes in fibril properties and oligomer populations.
- Imaging Parameters: ScanAsyst or Tapping Mode in air; Silicon nitride tip (k ~0.7 N/m) for tapping; RTESPA-150 (k ~5 N/m) for PeakForce QNM; Scan rate: 0.5-1.0 Hz; Resolution: 512x512 or 1024x1024 pixels.
- Analysis Workflow (using NanoScope Analysis or Gwyddion):
- Flattening: Apply 2nd or 3rd order flattening to all images.
- Fibril Analysis: Use the "Particle Analysis" tool. Manually trace individual fibrils to extract:
- Height: Cross-sectional profile.
- Length: Using the section tool along the fibril axis.
- Periodicity: Fast Fourier Transform (FFT) of fibril segments.
- Oligomer Analysis: Apply a threshold to isolate particles. Set minimum pixel threshold to 5-10. Automatically count and measure:
- Particle Density (counts/µm²).
- Mean Particle Height & Diameter.
- Nanomechanics (PeakForce QNM): Ensure careful calibration. Apply modulus fitting (DMT model) only to data from regions with adhesion >5 nm. Report Reduced Young's Modulus for fibrils and oligomers.
Data Presentation: Correlative Findings from a Model Aβ42 Study
Table 1: Multi-Technique Data for Candidate Molecules Modulating Aβ42 Aggregation
| Candidate Drug (10 µM) | ThT Fluorescence (% of Control) | AFM: Fibril Height (nm) | AFM: Oligomer Density (particles/µm²) | AFM: Fibril Modulus (GPa) | ITC: ΔH of Binding (kJ/mol) | Cell Viability (% vs. Vehicle) |
|---|---|---|---|---|---|---|
| Control (No drug) | 100 ± 8 | 8.2 ± 1.1 | 125 ± 18 | 2.1 ± 0.3 | N/A | 100 ± 5 |
| Compound A | 25 ± 5 | 5.1 ± 0.8 | 310 ± 45 | 1.2 ± 0.2 | -45.2 ± 4.1 | 45 ± 7 |
| Compound B | 155 ± 12 | 9.8 ± 1.5 | 15 ± 5 | 2.8 ± 0.4 | +12.3 ± 2.5 | 92 ± 6 |
| Compound C | 85 ± 7 | 7.9 ± 1.2 | 110 ± 20 | 2.0 ± 0.3 | -5.1 ± 1.8 | 105 ± 4 |
Interpretation: Compound A potently inhibits fibril formation (low ThT, low fibril height) but correlates with a dangerous increase in oligomer load and cytotoxicity. Compound B promotes fibrillization (high ThT, robust fibrils) but sequesters protein into less toxic aggregates (low oligomers, high viability). AFM data explains the paradoxical biochemical and cellular readouts.
Title: AFM Bridges Molecular Interaction and Macroscopic Effect
The Scientist's Toolkit: Essential Research Reagent Solutions
| Item | Function in AFM-Based Screening |
|---|---|
| Functionalized Mica Substrates (e.g., Ni²⁺-NTA, APTES) | Provides a stable, flat, and chemically specific surface for immobilizing his-tagged proteins or controlling adsorption kinetics for consistent imaging. |
| Calibrated AFM Probes (PeakForce Tapping, SCANASYST-AIR) | Essential for reproducible imaging and quantitative nanomechanical mapping (QNM). Different spring constants and tip shapes are selected for fragile aggregates vs. mature fibrils. |
| Size-Exclusion Chromatography (SEC) Columns | Used to isolate specific oligomeric species from aggregation mixtures immediately prior to AFM analysis, linking a defined biochemical population to a nanomorphology. |
| Fluorescent Dyes (Thioflavin T, ANS) | Provide the primary high-throughput biochemical screen. AFM validates the structural changes these dyes report on (e.g., ThT decrease could mean fewer fibrils or different fibril structure). |
| Microfluidic Incubation Devices | Enable controlled, small-volume aggregation time-course studies with minimal handling. Aliquots can be extracted at precise times for parallel AFM and spectroscopic analysis. |
| Reference Fibril Samples (e.g., characterized α-synuclein fibrils) | Served as internal controls for AFM tip quality, image processing, and nanomechanical measurement consistency across multiple screening sessions. |
Conclusion
Atomic Force Microscopy stands as a cornerstone technique in the structural biophysics of protein aggregation, offering unparalleled nanoscale resolution under physiologically relevant conditions. By mastering foundational principles, robust methodologies, diligent troubleshooting, and integrative validation, researchers can extract highly reliable quantitative data on amyloid formation pathways. This capability is critical for elucidating disease mechanisms and evaluating therapeutic interventions. Future directions point toward more automated, high-throughput AFM platforms, advanced multimodal integration, and the application of AI for image analysis, promising to accelerate the discovery of anti-aggregation drugs and diagnostics for a range of protein misfolding disorders.