Kretschmann vs Otto: A Complete Guide to SPR Configuration Selection for Biosensing and Drug Development
This comprehensive guide explores the critical distinction between Kretschmann and Otto configurations for surface plasmon resonance (SPR) sensing.
Kretschmann vs Otto: A Complete Guide to SPR Configuration Selection for Biosensing and Drug Development
Abstract
This comprehensive guide explores the critical distinction between Kretschmann and Otto configurations for surface plasmon resonance (SPR) sensing. Targeted at researchers and drug development professionals, it provides a foundational understanding of each configuration's physics, details practical methodologies and applications in biomolecular interaction analysis, offers troubleshooting and optimization strategies, and delivers a direct comparative validation of performance metrics. The article synthesizes this information to empower informed experimental design for label-free detection, binding kinetics, and novel therapeutic development.
Understanding the Core Physics: Kretschmann and Otto Configuration Fundamentals
Surface Plasmon Resonance (SPR) is a label-free, real-time optical sensing technique that exploits the evanescent wave generated under total internal reflection (TIR) to monitor molecular interactions at a metal-dielectric interface. Within the broader research context comparing Kretschmann and Otto configurations, this whitepaper serves as a technical refresher on the core principles of evanescent wave sensing underpinning both methods. This guide is intended for researchers and professionals in biophysics, biochemistry, and drug development who require a precise understanding of SPR fundamentals for experimental design and data interpretation.
Core Physical Principle: Surface Plasmons and the Evanescent Field
When p-polarized light strikes a glass prism at an angle greater than the critical angle, it undergoes TIR. Although the incident light is completely reflected, an electromagnetic field component, the evanescent wave, penetrates a short distance (typically < 200 nm) into the medium of lower refractive index. In SPR, a thin metal film (typically gold, ~50 nm) is deposited on the prism. At a specific resonance angle of incident light, the momentum of the evanescent wave couples with the free electron oscillations (plasmons) in the metal film, generating surface plasmon polaritons (SPPs). This coupling results in a sharp dip in the intensity of the reflected light.
The resonance condition is exquisitely sensitive to changes in the refractive index within the evanescent field's penetration depth. The binding of analyte molecules to ligands immobilized on the metal surface alters this local refractive index, shifting the resonance angle, which is monitored in real-time to generate a sensorgram.
Kretschmann vs. Otto: Configurational Framework
The two primary configurations for exciting surface plasmons differ in how the evanescent field interacts with the metal layer.
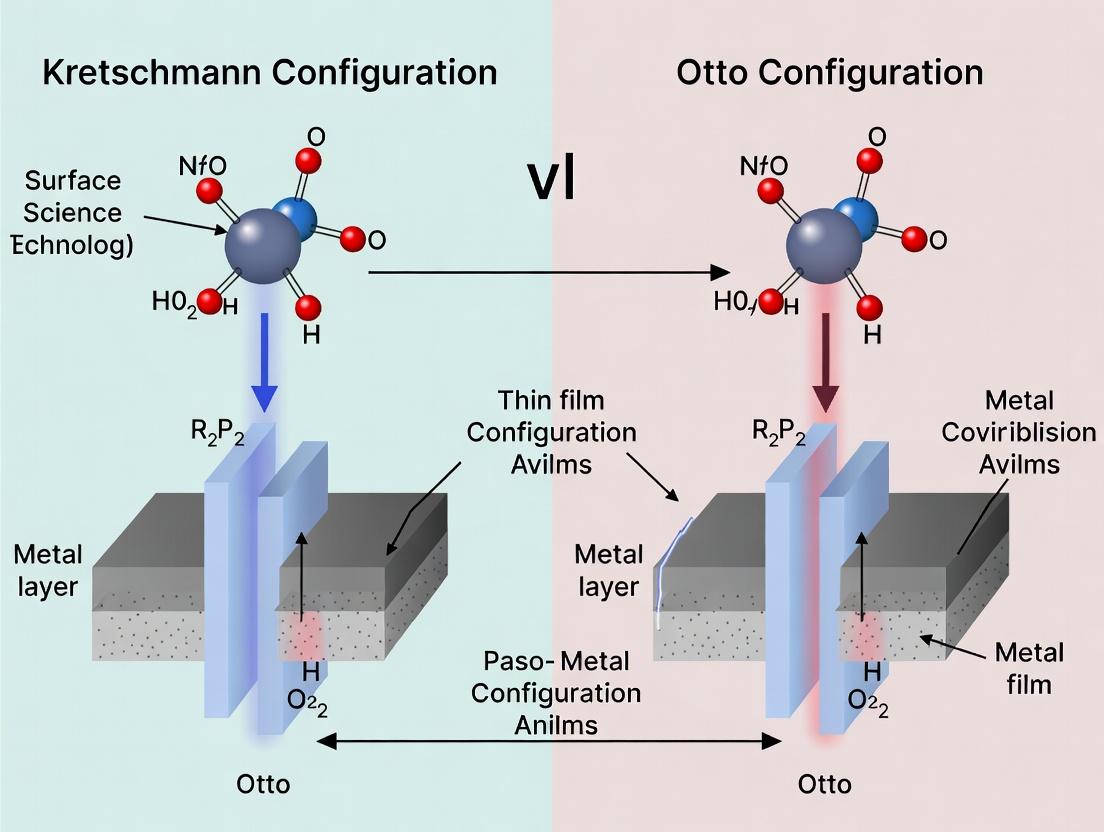
Kretschmann Configuration: The metal film is deposited directly onto the prism base. The evanescent wave from the prism penetrates the thin metal film and excites surface plasmons at the outer metal-dielectric (e.g., buffer/analyte) interface. This is the most common experimental setup due to its simpler fabrication and robust fluidic handling.
Otto Configuration: A thin gap (of the order of the wavelength of light) separates the prism from the metal film. The evanescent wave traverses this gap to excite surface plasmons at the metal surface opposite the prism. This configuration is often used for studying thick films or samples where direct metal contact is undesirable but is more challenging to implement experimentally due to precise gap control requirements.
Table 1: Core Comparison of Kretschmann and Otto Configurations
| Parameter | Kretschmann Configuration | Otto Configuration |
|---|---|---|
| Metal Film Placement | Directly on prism surface | Separate from prism, with a defined gap |
| Typical Gap | N/A (direct contact) | ~λ, precisely controlled (e.g., 500-1000 nm) |
| Primary Application | Study of interactions at metal-liquid interface (bio-sensing) | Study of thick dielectric coatings or air/metal interfaces |
| Experimental Complexity | Relatively simple, robust | High, requires precise mechanical alignment |
| Sensitivity | High | Can be higher for specific dielectric studies |
| Common Use in Biosensing | Dominant | Rare |
Quantitative Data and Key Parameters
Table 2: Key Quantitative Parameters in SPR Sensing
| Parameter | Typical Range/Value | Description & Impact |
|---|---|---|
| Penetration Depth (Ev. Wave) | 100 - 200 nm | Decay length into sensing medium. Defines sensing volume. |
| Metal Film Thickness (Au) | 45 - 55 nm | Optimal for maximal coupling efficiency in Kretschmann config. |
| Resonance Angle Shift | 0.1° ≈ 10⁻³ - 10⁻⁶ RIU | Angular shift per refractive index unit (RIU) change. Core measurable output. |
| Detection Limit (Mass) | ~0.1 - 1 pg/mm² | Minimum detectable mass change on sensor surface. |
| Assay Kinetics Range | kₐ: 10³ - 10⁷ M⁻¹s⁻¹, k_d: 10⁻¹ - 10⁻⁵ s⁻¹ | Measurable association (kₐ) and dissociation (k_d) rate constants. |
| Flow Rate (Typical) | 10 - 100 µL/min | Standard for continuous flow systems to control mass transport. |
Detailed Experimental Protocol: Ligand-Amine Coupling and Analyte Binding
This protocol outlines a standard amine-coupling procedure for immobilizing a protein ligand on a CM5 (carboxymethylated dextran) sensor chip in a Kretschmann-configuration SPR instrument (e.g., Biacore series).
Materials:
- SPR instrument with continuous flow system.
- CM5 sensor chip.
- Running Buffer: HBS-EP (10 mM HEPES, 150 mM NaCl, 3 mM EDTA, 0.05% v/v Surfactant P20, pH 7.4).
- Activation Solutions: 0.4 M EDC (1-ethyl-3-(3-dimethylaminopropyl)carbodiimide) and 0.1 M NHS (N-hydroxysuccinimide).
- Ligand Solution: Target protein in low-sodium acetate buffer (pH 4.0-5.0, optimized for isoelectric point).
- Blocking Solution: 1.0 M ethanolamine hydrochloride-NaOH, pH 8.5.
- Regeneration Solution: 10 mM glycine-HCl, pH 2.0-3.0 (or as optimized).
- Analyte Solutions: Serial dilutions in running buffer.
Procedure:
- System Startup: Prime the instrument with filtered and degassed running buffer.
- Baseline Stabilization: Dock the CM5 chip and run buffer over all flow cells at the intended operating temperature until a stable baseline is achieved.
- Surface Activation: Inject a 1:1 mixture of EDC and NHS (typical injection volume: 35 µL, flow rate: 10 µL/min) over the target flow cell(s). This converts carboxyl groups to reactive NHS esters.
- Ligand Immobilization: Immediately inject the ligand solution (typical concentration: 10-100 µg/mL in appropriate acetate buffer) over the activated surface. Monitor the response increase until the desired immobilization level (Response Units, RU) is reached.
- Deactivation/Blocking: Inject ethanolamine solution (typical injection: 35 µL) to block remaining activated esters.
- Reference Surface Creation: Use a separate flow cell activated and blocked without ligand injection, or immobilized with a non-interacting protein, for reference subtraction.
- Analyte Binding Analysis: Inject analyte solutions at varying concentrations (serial 2-fold dilutions) over ligand and reference surfaces (association phase, 60-180 s). Follow with a switch to running buffer to monitor dissociation (120-300 s). Use a flow rate of 30 µL/min to minimize mass transport limitation.
- Surface Regeneration: Inject regeneration solution (typically 10-30 s pulse) to remove bound analyte without damaging the ligand. Re-equilibrate with running buffer.
- Data Analysis: Subtract reference flow cell data. Fit the resulting sensorgrams to a 1:1 Langmuir binding model or other appropriate model to determine kinetic constants (kₐ, kd) and the equilibrium dissociation constant (KD = k_d/kₐ).
Visualizing the SPR Experimental Workflow
Diagram Title: SPR Biosensor Experimental Workflow
The Scientist's Toolkit: Essential Research Reagents & Materials
Table 3: Key Research Reagent Solutions for SPR Biosensing
| Item / Reagent | Function & Rationale |
|---|---|
| CM5 Sensor Chip | Gold surface with a covalently attached carboxymethylated dextran hydrogel. Provides a hydrophilic matrix for ligand immobilization, reduces non-specific binding, and increases loading capacity. |
| HBS-EP Running Buffer | Standard buffered saline with EDTA and surfactant. Maintains pH and ionic strength, chelates divalent cations, and minimizes non-specific binding via surfactant P20. |
| EDC & NHS | Cross-linking reagents for amine coupling. EDC activates carboxyl groups, NHS forms stable amine-reactive esters for efficient ligand coupling. |
| Ethanolamine-HCl | Blocking agent. Deactivates excess NHS esters after immobilization to prevent non-specific binding. |
| Low pH Acetate Buffer | Ligand dilution buffer (pH 4.0-5.5). Creates optimal electrostatic pre-concentration of positively charged proteins to the negatively charged dextran matrix for high immobilization efficiency. |
| Glycine-HCl (pH 1.5-3.0) | Regeneration solution. Low pH disrupts protein-protein interactions, stripping bound analyte to regenerate the ligand surface for subsequent cycles. Must be optimized for each interaction. |
| Series S Sensor Chips | A range of specialized surfaces (e.g., NTA for His-tag capture, streptavidin for biotinylated ligands, lipid surfaces for membrane protein studies). Provides flexibility for diverse immobilization strategies. |
| Pioneer Chips (J1, F1) | Bare gold (J1) or flat hydrophobic (F1) surfaces. Used for capturing lipid monolayers/bilayers or for custom surface chemistry, essential for studying membrane-associated interactions. |
The Kretschmann configuration is a predominant method for exciting surface plasmon polaritons (SPPs) on a thin metallic film, forming the cornerstone of modern label-free biosensing platforms like Surface Plasmon Resonance (SPR). Within the broader thesis comparing Kretschmann and Otto configurations for advanced sensing applications, this guide details the core principles, implementation, and protocols of the Kretschmann approach. The Otto configuration, which utilizes an air gap between a prism and a bulk metal surface, offers advantages in avoiding direct metal contact with analytes but suffers from precise gap control challenges. In contrast, the Kretschmann configuration's direct deposition of a thin metal film onto the prism coupling element provides robust, reproducible experimental setups ideal for high-throughput drug development research, albeit with potential for metal film degradation. This whitepaper focuses on the Kretschmann method as the industry standard for real-time, kinetic binding analysis.
Surface plasmon polaritons are electromagnetic waves coupled to electron charge density oscillations propagating along a metal-dielectric interface. Their excitation requires momentum matching between the incident photon and the SPP. For a given metal and dielectric, the SPP wavevector (k{SPP}) is greater than that of a free-space photon (k0).
The Kretschmann configuration achieves this momentum matching via total internal reflection (TIR) in a high-index prism (e.g., SF10 glass, BK7) coated with a thin (≈50 nm) noble metal film (typically gold). Under TIR, the incident light evanescently tunnels through the metal film. At a specific angle of incidence ((\theta{SPR})) greater than the critical angle, the component of the incident wavevector parallel to the interface (kx = \frac{2\pi}{\lambda} np \sin(\theta{SPR})) equals the real part of (k_{SPP}), resulting in resonant energy transfer to the surface plasmon. This manifests as a sharp minimum in the intensity of reflected light (the SPR dip).
Quantitative Data and Material Properties
The performance is governed by material optical constants and geometry. Key parameters are summarized below.
Table 1: Common Prism and Metal Film Materials
| Material | Refractive Index (n) @ 633 nm | Function | Key Property |
|---|---|---|---|
| BK7 Glass | 1.515 | Coupling Prism | High optical quality, cost-effective |
| SF10 Glass | 1.723 | Coupling Prism | Higher index, greater momentum enhancement |
| Gold (Au) | 0.172 + i·3.421 (ε) | Plasmonic Layer | Biologically inert, sharp resonance |
| Silver (Ag) | 0.055 + i·3.32 (ε) | Plasmonic Layer | Sharper resonance but oxidizes easily |
| Chromium (Cr) / Titanium (Ti) | - | Adhesion Layer | ~1-2 nm, improves Au adhesion to glass |
Table 2: Typical Kretschmann Configuration Parameters (λ=633 nm, Au/Water)
| Parameter | Typical Value | Impact on Resonance |
|---|---|---|
| Prism Index (n_p) | 1.515 - 1.723 | Higher np increases (kx), shifting (\theta_{SPR}) lower |
| Gold Film Thickness | 47 - 52 nm | Optimizes coupling efficiency (min. reflectance) |
| Adhesion Layer Thickness | ≤ 2 nm | Thicker layers broaden and dampen the resonance |
| Incident Wavelength (λ) | 633 nm (He-Ne), 760-850 nm (LED) | Longer λ shifts (\theta_{SPR}) higher, alters sensitivity |
| Sensitivity (Δθ/Δn) | ~80-120 °/RIU* | Angular shift per Refractive Index Unit change |
Detailed Experimental Protocols
Protocol 1: Substrate Preparation and Metal Deposition
Objective: Fabricate a sensor chip with a thin gold film on a prism or microscope slide. Materials: Cleaning piranha solution, Thermal evaporator or sputter coater, Quartz crystal microbalance, BK7 prism or glass slide, Gold wire (99.999%), Chromium pellets. Method:
- Substrate Cleaning: Sonicate substrate in acetone and isopropanol for 10 min each. Treat with fresh piranha solution (3:1 H₂SO₄:H₂O₂) for 1 min. CAUTION: Piranha is highly corrosive. Rinse thoroughly with deionized water and dry under N₂ stream.
- Metal Deposition: Place cleaned substrate in deposition chamber. Pump to high vacuum (<5×10⁻⁶ Torr).
- Adhesion Layer: Thermally evaporate a 1-2 nm chromium layer at 0.1-0.2 Å/s.
- Gold Layer: Immediately evaporate a 48 nm gold layer at a rate of 0.5 Å/s. Monitor thickness with a calibrated quartz crystal microbalance.
- Storage: Store fabricated chips in a clean, dry nitrogen environment. Use within 2 weeks for optimal performance.
Protocol 2: Angular Interrogation SPR Measurement
Objective: Measure the SPR angle shift upon analyte binding to a functionalized sensor surface. Materials: Kretschmann-configured SPR instrument, Microfluidic flow cell, Peristaltic pump, Running buffer (e.g., HEPES Buffered Saline), Analyte samples, Data acquisition software. Method:
- Instrument Alignment: Mount the gold-coated prism on the TIR stage of the SPR instrument using index-matching fluid. Align the optical train to achieve a collimated, p-polarized beam at the prism base.
- Fluidic Setup: Attach a clean microfluidic flow cell to the gold surface. Connect inlet/outlet tubing to a peristaltic pump and buffer reservoirs.
- Baseline Acquisition: Flow running buffer at a constant rate (e.g., 20 µL/min). Perform an angular scan (e.g., 55° to 75°) to locate the precise SPR dip minimum. Set the instrument to monitor reflectance at a fixed angle near the dip's inflection point for kinetic measurements.
- Ligand Immobilization: Functionalize the gold surface (e.g., via a self-assembled thiol monolayer). Inject ligand solution (10-100 µg/mL in running buffer) until saturation binding is observed.
- Kinetic Measurement: Inject a series of analyte concentrations (in running buffer) across the sensor surface for 3-5 minutes (association phase), followed by running buffer alone for 5-10 minutes (dissociation phase). Regenerate the surface if necessary (e.g., with mild acid or chaotropic agent).
- Data Analysis: Fit the resulting sensorgrams (reflectance vs. time) with a 1:1 Langmuir binding model using the instrument's software to extract association ((ka)) and dissociation ((kd)) rate constants, and the equilibrium dissociation constant ((KD = kd/k_a)).
Visualization: Experimental Workflow and Signal Generation
Diagram 1: Kretschmann SPR Experimental Setup
Diagram 2: Momentum Matching & Resonance Dip Generation
The Scientist's Toolkit: Research Reagent Solutions
Table 3: Essential Materials for Kretschmann SPR Biosensing
| Item | Function & Rationale |
|---|---|
| High-Index Prism (SF10 or BK7) | Provides the necessary momentum enhancement via TIR to match the SPP wavevector. |
| Gold-Coated Sensor Chips (≈50 nm Au) | Standard plasmonic substrate; can be pre-functionalized with various chemistries (e.g., carboxyl, streptavidin). |
| Index-Matching Fluid (Cargille Labs) | Eliminates air gaps between prism and sensor chip, ensuring optimal optical coupling. |
| Piranha Solution (H₂SO₄/H₂O₂) | Extreme Hazard. Creates a clean, hydrophilic, and oxide-free glass surface prior to metal deposition. |
| Alkanethiol Self-Assembled Monolayers (SAMs) | Form a stable, ordered layer on gold (via Au-S bond) for presenting ligand capture sites (e.g., COOH for EDC/NHS coupling). |
| EDC (1-Ethyl-3-(3-dimethylaminopropyl)carbodiimide) & NHS (N-Hydroxysuccinimide) | Crosslinkers for activating carboxylated surfaces to immobilize amine-containing ligands (proteins, peptides). |
| Running Buffer (e.g., HBS-EP: 10mM HEPES, 150mM NaCl, 3mM EDTA, 0.005% v/v Surfactant P20) | Maintains pH and ionic strength; surfactant reduces non-specific binding. |
| Regeneration Solutions (e.g., 10mM Glycine-HCl pH 2.0-3.0, 10-50mM NaOH) | Gently dissociates bound analyte from ligand to regenerate the sensor surface for repeat measurements. |
| Kinetic Analysis Software (e.g., Biacore Evaluation Software, TraceDrawer) | Fits sensorgram data to binding models to extract kinetic ((ka), (kd)) and affinity ((K_D)) parameters. |
Within the field of surface plasmon resonance (SPR) spectroscopy, the prism-coupled Otto and Kretschmann configurations represent the two foundational attenuated total reflection (ATR) geometries for exciting surface plasmon polaritons (SPPs). The broader thesis of comparative research centers on their respective applications in sensing, particularly for biomolecular interactions critical to drug development. While the Kretschmann configuration, with its thin metal film deposited directly on the prism, is the industry standard for biosensing, the Otto configuration—which employs an air or dielectric gap between the prism and the metal layer—offers distinct advantages for specialized scenarios. This guide demystifies the Otto configuration, detailing its principles, implementation, and niche applications where it surpasses the Kretschmann approach, particularly in studying delicate or rigid samples where metal film integrity is paramount.
Core Principles & Quantitative Comparison
The fundamental operation of both configurations relies on the ATR method to provide the necessary momentum matching (wavevector) to excite SPPs at a metal-dielectric interface. The key distinction lies in the architecture of the coupling region.
| Parameter | Otto Configuration | Kretschmann Configuration | |||||
|---|---|---|---|---|---|---|---|
| Coupling Geometry | Prism | Air/Gap | Metal Film | Analyte | Prism | Metal Film | Analyte |
| Metal Contact | No direct contact with prism. | Direct deposition on prism base. | |||||
| Typical Gap (d) | ~λ/4 to > 1 μm (tunable). | Metal film thickness ~50 nm (fixed). | |||||
| Field Penetration | Strong evanescent field across gap. | Evanescent field in analyte. | |||||
| Key Advantage | Protects metal surface; studies solids, crystals, or sensitive films. | Robust, easier to implement; standard for liquid-phase biosensing. | |||||
| Primary Disadvantage | Precise gap control is critical and challenging. | Metal film can degrade; not suitable for all solid samples. | |||||
| Typical Refractive Index Range (Analyte) | Best for lower-index analytes (gases, thin adsorbates). | Broad range, optimized for aqueous solutions. | |||||
| Sensitivity (Angular, Δθ/ΔRIU) | ~50-150 °/RIU (highly gap-dependent). | ~50-120 °/RIU. |
Detailed Experimental Protocol for Otto Configuration Setup
Objective: To construct an Otto configuration SPR setup for characterizing a solid crystalline sample.
Materials & Reagent Solutions:
| Item | Function |
|---|---|
| High-Index Prism (e.g., SF10 glass) | Provides incident light coupling for momentum matching. |
| Precision XYZ & Goniometric Stage | Enables nanometer-scale gap control and angular scanning. |
| Laser Source (λ = 632.8 nm He-Ne typical) | Monochromatic, p-polarized light source. |
| Photodetector | Measures intensity of reflected light. |
| Index-Matching Oil | Eliminates air gaps between prism and mounting stage. |
| Gold or Silver Film Sample (on rigid substrate) | The plasmon-active metal layer. |
| Piezoelectric Actuators or Spacer Micrometer | For precise control of the air/dielectric gap distance. |
| Sample Alignment Fixture | Holds metal sample parallel to prism base. |
Methodology:
- Prism Mounting: Secure the prism to the rotating stage using index-matching fluid.
- Initial Alignment: Mount the metal film sample on a separate stage opposite the prism base. Coarsely align to achieve near-parallelism.
- Gap Initialization: Using the piezoelectric actuators, establish an initial air gap of several micrometers.
- Laser Alignment: Align the p-polarized laser beam to undergo total internal reflection at the prism base.
- Angular Scan & Gap Optimization: Perform an angular scan of incident light while monitoring reflected intensity. Initially, no SPR dip will be present. Gradually decrease the gap distance (d) in sub-100 nm steps, performing a scan after each adjustment. The SPR resonance dip (reflectivity minimum) will appear, deepen, and then broaden as d approaches the optimal value (typically λ/4 to λ/2). The process is iterative until a sharp, deep resonance is observed.
- Data Collection: With the gap fixed at the optimal distance, perform a high-resolution angular scan to record the reflectivity curve. Introduce the analyte (e.g., a gas) to the gap region and monitor the shift in the resonance angle (Δθ).
Visualizing the Comparative Workflow
Title: Decision Flow: Choosing Between Otto and Kretschmann Configurations
The Scientist's Toolkit: Key Reagent Solutions & Materials
| Category | Item | Specific Example/Function |
|---|---|---|
| Coupling Components | High-Index Prisms | SF10, BK7 with high-index coating; enables momentum matching. |
| Index-Matching Fluid | Cargille Labs oils; eliminates parasitic reflections. | |
| Metal Films | Pre-fabricated Substrates | Gold (50nm)/Chromium(2nm) on silica wafers for Otto geometry. |
| Evaporation/Sputtering Targets | 99.999% pure Au, Ag for in-house Kretschmann film creation. | |
| Probe Molecules | Functionalization Kits | Thiol-PEG-carboxyl for Au surface ligand immobilization. |
| Model Analytes | Bovine Serum Albumin (BSA), Immunoglobulin G (IgG) for binding assays. | |
| Buffer & Regeneration | Running Buffer | HEPES Buffered Saline (HBS-EP) with surfactant for microfluidics. |
| Regeneration Solution | Glycine-HCl (pH 2.0) or SDS for chip surface regeneration. | |
| Gap Control | Piezoelectric Nanopositioners | Sub-nanometer resolution for precise Otto gap adjustment. |
| Calibrated Silica Spacers | Used for fixed-gap, proof-of-concept experiments. |
Technological Advances and Application in Drug Development
Recent advances in nano-fabrication and fluidics have revived interest in the Otto configuration. Its primary drug development application lies in characterizing membrane proteins and lipid bilayers supported on solid substrates without damaging interactions with a sensor metal. By using a functionalized metal surface across a controlled gap from a cell membrane fragment, label-free binding kinetics of drug candidates can be studied in a more native environment. Furthermore, the Otto configuration is uniquely suited for gas-phase sensing and studying phase transitions in thin polymeric films, areas relevant to inhaler technology and drug delivery system design. The precise control of the gap dielectric constant allows for tuning the plasmon field profile, offering a degree of flexibility not present in the fixed Kretschmann design.
This whitepaper provides a technical guide to three interdependent parameters critical for optimizing surface plasmon resonance (SPR) sensing. The analysis is framed within a comparative research thesis on the two primary attenuated total reflection (ATR) configurations: the Kretschmann and Otto configurations. The choice between these configurations fundamentally influences the attainable resonant angle, the depth and quality of the reflectivity dip, and the electric field penetration depth into the analyte medium—parameters that directly dictate sensor sensitivity, resolution, and application suitability. This guide equips researchers with the knowledge to select and optimize the appropriate configuration for advanced applications, such as label-free biomolecular interaction analysis in drug development.
Core Parameter Definitions & Theoretical Foundation
Resonant Angle (θ_SPR)
The specific incident angle at which photon momentum couples maximally to surface plasmon polaritons (SPPs) at the metal-dielectric interface, resulting in a minimum in reflected light intensity. It is highly sensitive to the refractive index (RI) of the dielectric medium within the evanescent field.
Reflectivity Dip (ΔR)
The minimum value of reflectance at the resonant angle. Its depth (ideally reaching near zero) and width (Full Width at Half Minimum, FWHM) are indicators of coupling efficiency and plasmon resonance quality. A sharper, deeper dip correlates with higher detection accuracy.
Electric Field Penetration Depth (L_p)
The distance from the metal surface into the dielectric medium at which the evanescent electric field intensity decays to 1/e of its value at the interface. It determines the sensing volume and the size of biomolecules that can be detected effectively.
Kretschmann vs. Otto: A Comparative Framework
The core distinction lies in the interface where SPPs are excited.
- Kretschmann Configuration: A thin metal film (e.g., ~50 nm Au) is deposited directly on the prism base. The light couples through the prism and metal to excite SPPs at the metal-analyte (external) interface.
- Otto Configuration: A gap (air or dielectric) is maintained between the prism base and a thick metal film. The light couples through the prism and the gap to excite SPPs at the metal-analyte interface on the far side of the metal film.
Thesis Context: The Kretschmann configuration is the dominant choice for biosensing due to its simpler fabrication and direct contact with liquid analyte. The Otto configuration, while more challenging to align, is essential for studying plasmonics on pristine, thick metal surfaces or for analyzing highly absorbing samples where direct metal contact is undesirable. The optimal configuration is dictated by the specific experimental requirements and the trade-offs between these key parameters.
Quantitative Parameter Comparison & Data Tables
Table 1: Typical Parameter Ranges for Common Configurations (λ = 633 nm)
| Parameter | Kretschmann (50nm Au / Water) | Otto (100nm Air Gap / 50nm Au / Water) | Impact on Sensing |
|---|---|---|---|
| Resonant Angle (θ_SPR) | 70° - 75° | 41° - 45° | Determines optical setup geometry. |
| Reflectivity Min. (R_min) | < 0.01 (Near zero) | ~0.1 - 0.3 | Deeper dip = stronger coupling = better SNR. |
| Dip Width (FWHM) | 1° - 3° | 0.5° - 1.5° | Narrower width = higher angular resolution. |
| Field Penetration (L_p) | ~200 nm | ~150 - 200 nm | Deeper penetration = probes larger analytes. |
| RI Sensitivity (S_θ) | ~80 - 120 °/RIU | ~50 - 80 °/RIU | Higher is better for detecting binding events. |
| Figure of Merit (FOM=S_θ/FWHM) | ~30 - 100 RIU⁻¹ | ~60 - 120 RIU⁻¹ | Balances sensitivity and resolution. |
Table 2: Configuration Selection Guide Based on Application
| Research Objective | Recommended Configuration | Rationale Linked to Key Parameters |
|---|---|---|
| Kinetics of protein-ligand binding | Kretschmann | Robust, deep reflectivity dip for stable, real-time monitoring. |
| Detection of large cells or vesicles | Kretschmann | Larger electric field penetration depth (L_p) samples more of the analyte. |
| Study of intrinsic metal surface properties | Otto | Avoids modification of metal surface by prism adhesion layer. |
| Ultra-high spectral resolution studies | Otto | Often yields narrower resonant dips (lower intrinsic damping). |
| Sensing in conductive or corrosive liquids | Otto (with protective layer) | Metal film is isolated from the damaging analyte. |
Experimental Protocols for Parameter Characterization
Protocol 1: Measuring the Angular Reflectivity Curve
Objective: To experimentally determine θ_SPR, ΔR depth, and FWHM. Materials: SPR setup (prism, rotation stage, laser, polarizer, photodetector), sensor chip, flow cell, microfluidic pump, buffer solution. Methodology:
- Mount the sensor chip (Kretschmann: metal-coated; Otto: spaced metal film) on the prism using index-matching oil.
- Align the laser beam to the prism center and ensure p-polarization.
- Flush the flow cell with a reference buffer (e.g., PBS) to establish a baseline RI.
- Program the rotation stage to scan through a range of incident angles (e.g., 40°-80°) in small steps (e.g., 0.01°).
- Record the photodetector intensity (reflectance, R) at each angle.
- Fit the resulting R vs. θ curve with a Lorentzian or polynomial function.
- Extract Parameters: The angle at the minimum is θ_SPR. The minimum reflectance value is ΔR depth. Calculate FWHM from the fitted curve.
Protocol 2: Calibrating Refractive Index Sensitivity (S_θ)
Objective: To quantify the shift in θ_SPR per unit change in bulk refractive index. Materials: As in Protocol 1, plus a series of standard sucrose or NaCl solutions with known, incrementally different RIs. Methodology:
- Perform an angular scan (Protocol 1) with the first reference solution (lowest RI).
- Flush sequentially with solutions of increasing known RI.
- For each solution, perform an angular scan and determine the new θ_SPR.
- Plot the shift in θSPR (ΔθSPR) against the change in RI (Δn).
- Perform a linear regression. The slope of the line is the angular sensitivity (S_θ) in °/RIU.
Protocol 3: Estimating Electric Field Penetration Depth (L_p)
Objective: To derive the decay length of the evanescent field. Materials: Simulation software (e.g., COMSOL, MATLAB with transfer matrix method) or analytical calculation based on experimental data. Methodology (Computational):
- Model the multilayer structure: Prism / (Gap for Otto) / Metal / Analyte.
- Input the complex dielectric constants (ε) for each layer at the laser wavelength.
- Solve Maxwell's equations for the described geometry (often using the transfer matrix method).
- Calculate the electric field intensity profile |E(z)|² as a function of distance (z) from the metal surface into the analyte.
- Extract Lp: Determine the distance
zat which |E(z)|² falls to 1/e (~37%) of its value at the interface (z=0). *Note: Lp is primarily a theoretical parameter derived from the imaginary part of the SPP wave vector.*
The Scientist's Toolkit: Essential Research Reagents & Materials
| Item | Function in SPR Experiment | Typical Specification / Example |
|---|---|---|
| High-Index Prism | Provides total internal reflection and momentum matching. | SF10 or BK7 glass, hemispherical or trapezoidal. |
| Sensor Chip (Kretschmann) | The functional substrate where SPPs are excited and binding occurs. | Glass slide with 2 nm Cr adhesion layer + 50 nm Au coating. |
| Index Matching Fluid | Eliminates air gaps between prism and chip, ensuring optical continuity. | Cargille Labs immersion oil, n_D = 1.515. |
| Polarizer | Filters light to ensure p-polarization, required for SPP excitation. | Glan-Thompson or wire-grid polarizer. |
| Microfluidic Flow Cell | Delays analyte solution in a controlled lamilar flow over the sensor surface. | Poly(dimethylsiloxane) (PDMS) or hard polymer with defined channel volume. |
| Running Buffer | Provides a stable ionic and pH background, minimizes non-specific binding. | 10 mM HEPES buffered saline, pH 7.4, with 0.005% surfactant P20. |
| Ligand Immobilization Kit | Enables covalent attachment of bait molecules to the gold surface. | Carboxymethylated dextran matrix, EDC/NHS chemistry for amine coupling. |
| Regeneration Solution | Gently breaks specific binding to allow chip reuse for multiple cycles. | 10 mM Glycine-HCl, pH 2.0, or 50 mM NaOH. |
Visualizations
Diagram Title: SPR Parameter Measurement Workflow
Diagram Title: Factors Governing SPR Key Parameters
Historical Context and Evolution of Both Configurations in Sensing Technology
Within the broader thesis on Kretschmann versus Otto configuration research, understanding their historical evolution is paramount. These prism-coupled configurations form the bedrock of surface plasmon resonance (SPR) sensing, a technology that has revolutionized label-free, real-time biomolecular interaction analysis. This guide details their development, technical nuances, and modern applications in drug discovery.
Historical Development and Core Principles
The Otto (1968) and Kretschmann (1971) configurations were developed to optically excite surface plasmon polaritons (SPPs) at metal-dielectric interfaces. Both overcome the photon momentum mismatch problem but employ distinct geometric arrangements.
- Otto Configuration (1968): The original attenuated total reflection (ATR) method. A thin air or dielectric gap separates a high-index prism from a thick metal film. The evanescent wave from the prism tunnels across the gap to excite SPPs on the far side of the metal. Its primary historical role was in foundational physics demonstrations.
- Kretschmann Configuration (1971): The inverted and now-predominant structure. A thin metal film (≈50 nm) is directly deposited onto the prism base. The evanescent wave penetrates the metal film to excite SPPs at its outer interface with the sample dielectric. This robust, easily fabricated configuration became the standard for sensing.
Quantitative Comparison of Configurations
Table 1: Historical & Technical Comparison of Core Configurations
| Parameter | Kretschmann Configuration | Otto Configuration |
|---|---|---|
| Year Introduced | 1971 | 1968 |
| Layer Order | Prism / Metal / Analyte | Prism / Gap / Metal / Analyte |
| Typical Metal Thickness | 45-55 nm (Au) | >100 nm (Au) |
| Gap Thickness | Not Applicable (direct contact) | 100-1000 nm (precise control critical) |
| Excitation Efficiency | High, robust | Highly gap-dependent, often lower |
| Fabrication Complexity | Low (standard metallization) | High (requires precise gap spacing) |
| Primary Historical Role | Applied sensing and commercialization | Fundamental plasmonics research |
| Dominant Modern Use | Commercial biosensors, drug binding assays | Specialized spectroscopy, 2D material studies |
Table 2: Typical Performance Metrics in Biosensing
| Metric | Kretschmann Configuration | Otto Configuration |
|---|---|---|
| Typical Refractive Index Unit (RIU) Sensitivity | 2x10^3 – 3x10^3 nm/RIU | Can be higher (theoretically) but less stable |
| Figure of Merit (FOM) | ~10-100 RIU^{-1} | Varies significantly with gap optimization |
| Detection Limit (Protein) | ~0.1 - 1 pg/mm² | Rarely reported for routine bioassays |
| Kinetic Rate Constant Range | 10^3 – 10^{-6} s^{-1} (ka / kd) | Not standard for kinetic analysis |
Experimental Protocols
Protocol 1: Standard Kretschmann SPR Binding Kinetics Assay (Ligand Immobilization)
- Sensor Chip Preparation: Use a commercially available SPR chip (e.g., CM5 dextran-coated gold). Mount it onto the prism using index-matching fluid.
- System Priming: Prime the integrated microfluidic system with running buffer (e.g., HBS-EP: 10 mM HEPES, 150 mM NaCl, 3 mM EDTA, 0.05% v/v Surfactant P20, pH 7.4).
- Baseline Establishment: Flow buffer at a constant rate (e.g., 30 µL/min) to establish a stable baseline resonance angle (RU signal).
- Surface Activation: Inject a 1:1 mixture of 0.4 M EDC (1-ethyl-3-(3-dimethylaminopropyl)carbodiimide) and 0.1 M NHS (N-hydroxysuccinimide) for 7 minutes.
- Ligand Immobilization: Dilute the target ligand (e.g., protein antigen) in 10 mM sodium acetate buffer (pH 4.5) and inject until the desired immobilization level (e.g., 100-200 RU) is reached.
- Surface Deactivation: Inject 1 M ethanolamine-HCl (pH 8.5) for 7 minutes to block remaining activated groups.
- Analyte Binding Analysis: Inject analyte (e.g., drug candidate) in running buffer at varying concentrations (serial dilutions) using a contact time of 120-180 seconds, followed by dissociation in buffer for 300+ seconds.
- Data Processing: Subtract reference channel data. Fit resulting sensograms globally to a 1:1 Langmuir binding model using software (e.g., Biacore Evaluation Software) to extract association (kₐ) and dissociation (kd) rate constants, and the equilibrium dissociation constant (KD = k_d/kₐ).
Protocol 2: Otto Configuration for Ultra-Sensitive Dielectric Measurement
- Gap Assembly: A high-index prism (e.g., SF10) is mounted on a precision translation stage with nano-positioning control. A thick, optically smooth metal film (100 nm Au) is deposited on a separate substrate.
- Gap Alignment: The metal substrate is brought parallel to the prism base. Using piezoelectric controllers, a precise air gap (λ/4 to several wavelengths) is established, monitored via interference fringes or capacitive sensing.
- Angular Scan: A p-polarized, monochromatic laser beam (e.g., He-Ne, 633 nm) is directed onto the prism. The stage rotates to vary the incident angle (θ) while detecting reflected intensity (R).
- SPR Dip Characterization: The angle (θ_SPR) at which the reflectance minimum (SPR dip) occurs is recorded for different dielectric samples placed atop the metal film.
- Sensitivity Calibration: Measure θSPR for known dielectrics (e.g., air, water, ethanol). Plot θSPR vs. refractive index (n) to determine system sensitivity (dθ_SPR/dn).
Visualizations
The Scientist's Toolkit: Key Research Reagents & Materials
Table 3: Essential Reagents for SPR Biosensing (Kretschmann-based)
| Item | Function & Explanation |
|---|---|
| Biacore Series S Sensor Chip (CM5) | Gold sensor surface with a covalently attached carboxymethylated dextran hydrogel. Provides a versatile matrix for ligand immobilization via amine, thiol, or other chemistries. |
| HBS-EP+ Buffer | Standard running buffer (HEPES, NaCl, EDTA, Polysorbate 20). Maintains pH and ionic strength, minimizes non-specific binding via surfactant. |
| EDC & NHS | Crosslinking reagents. Activate carboxyl groups on the dextran surface to form amine-reactive esters for covalent ligand coupling. |
| Ethanolamine-HCl | Blocking agent. Deactivates remaining ester groups after ligand immobilization to prevent unwanted analyte attachment. |
| Format-Specific Capture Ligands | e.g., Anti-GST, Anti-His, or Streptavidin. Immobilized on the chip to uniformly capture and orient tagged (GST/His/Biotin) analytes, enabling standardized assays. |
| Regeneration Solutions | e.g., 10 mM Glycine-HCl (pH 1.5-3.0), 4M MgCl₂. Gently disrupt the specific interaction to regenerate the ligand surface for repeated use without damage. |
| Index Matching Fluid | High-viscosity, stable fluid (n ~ prism). Eliminates interfering air gaps between the sensor chip and the optical prism. |
| Precision Microfluidic Syringes/Tubing | Deliver sample and buffer in a pulse-free, precise manner essential for accurate kinetic measurements. |
Practical Implementation: Step-by-Step Guide to Configuring Kretschmann and Otto Setups
The Kretschmann configuration is the predominant method for exciting surface plasmon resonance (SPR) in biosensing applications, favored over the Otto configuration for its superior practicality and stability in liquid-phase analysis. This whitepaper details the core protocols for implementing the Kretschmann setup. The critical distinction lies in the placement of the metallic film: in Kretschmann, a thin metal layer (≈50 nm Au) is deposited directly on the prism base and interfaces with the analyte, while in Otto, a thin dielectric gap separates the metal film from the prism. Although Otto can offer sharper resonances under ideal conditions, its requirement for a precise, nanometer-scale air gap makes it unsuitable for fluidic integration and real-time biomolecular interaction analysis. Therefore, this guide focuses on the robust, industry-standard Kretschmann approach.
Substrate Preparation Protocol
A pristine, uniform gold film is paramount for high-quality SPR data.
Detailed Methodology:
- Glass Substrate Cleaning: Use 1" x 1" or 25 mm diameter BK7 or SF10 glass slides. Sonicate sequentially in 2% Hellmanex III solution (60°C, 15 min), deionized water (15 min), and absolute ethanol (15 min). Dry under a stream of dry, filtered nitrogen.
- Adhesion Layer Deposition: Load slides into an electron-beam evaporator. At a base pressure < 5 x 10⁻⁶ Torr, deposit a 2-3 nm thick chromium or titanium layer at a rate of 0.1 Å/s. This promotes Au adhesion.
- Gold Film Deposition: Without breaking vacuum, deposit 47-50 nm of high-purity (99.999%) gold at a rate of 0.5 Å/s. Lower deposition rates yield smoother films.
- Quality Control: Characterize film thickness and roughness via spectroscopic ellipsometry and Atomic Force Microscopy (AFM). Target RMS roughness < 1 nm. Store substrates in a clean, dry nitrogen atmosphere.
Prism Coupling & Optical Alignment
Detailed Methodology:
- Index Matching: Apply a small drop of refractive index matching fluid (nD = prism nD, e.g., Cargille Labs series) to the hypotenuse of a hemispherical or triangular prism (SF10, n=1.723 at 633 nm).
- Substrate Mounting: Gently place the prepared gold substrate onto the fluid-covered prism face, gold-side out. Apply slight pressure to exclude all air bubbles. Secure the substrate with a mechanical clip or holder.
- Optical Setup: Mount the prism assembly on a high-precision goniometer stage. Align a p-polarized, monochromatic laser source (e.g., 633 nm He-Ne) to strike the prism-metal interface at the center of rotation.
- Angular Scan: Connect a photodetector to measure reflected intensity. Rotate the goniometer through the expected SPR angle (typically 65-75° for Au/water interface at 633 nm) with a step resolution of ≤ 0.01°. Record reflectance (R) vs. incident angle (θ).
Quantitative SPR Response Data: Table 1: Characteristic SPR Parameters for Common Configurations (at 633 nm)
| Substrate | Prism Material | Sensing Medium (n) | SPR Angle (θ, °) | Minimum Reflectance (%) | Angular FWHM (°) | Theoretical Sensitivity (RIU/°) |
|---|---|---|---|---|---|---|
| 50 nm Au / 2 nm Cr | SF10 (n=1.723) | Water (1.333) | 68.5 | < 1 | 1.5 | 85-120 |
| 50 nm Au / 2 nm Cr | BK7 (n=1.515) | Water (1.333) | 73.2 | < 5 | 3.5 | 50-80 |
| 50 nm Ag / 2 nm Ti | SF10 (1.723) | Water (1.333) | 66.8 | < 0.5 | 0.8 | 120-180 |
Fluidics Integration Protocol
Stable, bubble-free liquid handling is critical for kinetic binding studies.
Detailed Methodology:
- Flow Cell Assembly: A polydimethylsiloxane (PDMS) or polycarbonate flow cell with a defined channel geometry (e.g., 0.1 mm height x 2 mm width x 10 mm length, volume ≈ 2 µL) is used. Align the flow cell inlet/outlet with the gold surface and clamp securely using a inert gasket (e.g., Viton) to prevent leaks.
- System Priming: Connect the flow cell via PEEK or PTFE tubing to a syringe or peristaltic pump. Prime the entire system with running buffer (e.g., 10 mM HEPES, 150 mM NaCl, pH 7.4, 0.005% surfactant P20) at a high flow rate (e.g., 100 µL/min) to wet surfaces and remove bubbles.
- Baseline Establishment: Under constant flow (typical 20-50 µL/min), establish a stable angular baseline for at least 5-10 minutes. The reflected intensity at a fixed angle near the resonance curve's inflection point is monitored for real-time sensing.
- Sample Injection: Using an automated injection valve, switch the flow from running buffer to analyte solution (e.g., antibody, drug candidate) for a defined association phase (3-5 minutes). Switch back to running buffer for the dissociation phase. Multiple concentrations are run sequentially for kinetic analysis.
Essential Research Reagent Solutions
Table 2: The Scientist's Toolkit for Kretschmann SPR Biosensing
| Item / Reagent | Function & Critical Notes |
|---|---|
| SF10 Glass Prism | High refractive index material for achieving SPR at convenient angles with visible light. |
| High-Purity Gold (99.999%) Target | Source for e-beam evaporation; purity minimizes film damping and broadens resonance. |
| Chromium (or Titanium) Target | For depositing a thin adhesion layer between glass and gold. |
| Refractive Index Matching Fluid | Optically couples prism to substrate, eliminating lossy air gaps. Must be non-reactive with prism adhesive. |
| P20 Surfactant (Tween 20) | Added to running buffer (0.005-0.01%) to reduce non-specific binding to the sensor surface. |
| Carboxymethylated Dextran Hydrogel (e.g., CM5 Chip) | Common commercial sensor chip coating. Provides a hydrophilic, carboxylic acid-rich matrix for ligand immobilization. |
| N-ethyl-N'-(3-dimethylaminopropyl)carbodiimide (EDC) / N-hydroxysuccinimide (NHS) | Crosslinking agents for activating carboxyl groups on the sensor surface for ligand coupling. |
| 1M Ethanolamine-HCl, pH 8.5 | Used to deactivate and block remaining activated ester groups after ligand immobilization. |
| HBS-EP+ Buffer (10 mM HEPES, 150 mM NaCl, 3 mM EDTA, 0.05% P20, pH 7.4) | Standard running buffer for most biomolecular interaction analyses. EDTA minimizes metal-dependent non-specific binding. |
| Regeneration Solutions (e.g., 10 mM Glycine-HCl, pH 2.0-3.0; 50 mM NaOH) | Low or high pH buffers used to dissociate tightly bound analyte from the ligand, regenerating the surface for a new cycle. |
Visualization: Experimental Workflow
Kretschmann SPR Biosensing Protocol Workflow
Kretschmann Configuration Principle & Signal Generation
The Otto configuration and the Kretschmann configuration represent the two principal experimental arrangements for exciting surface plasmon polaritons (SPPs) in the attenuated total reflection (ATR) method. This technical guide focuses on the Otto setup, a configuration where a thin dielectric gap separates a prism from a metal film. The primary research trade-off centers on experimental complexity versus signal integrity. The Kretschmann configuration (direct metal film deposition on the prism) offers simpler alignment but introduces potential sample-metal interactions and damping. The Otto configuration, while avoiding direct metal contamination and enabling studies on pristine metal surfaces, imposes critical challenges in maintaining a nanoscale, uniform air or dielectric gap. This protocol details the methodologies to overcome these challenges, specifically for applications in label-free biomolecular sensing and drug development.
Core Challenge: Gap Distance Control & Alignment
The efficacy of the Otto configuration hinges on precise control of the gap distance (d), which is typically on the order of the evanescent decay length (~λ/10, often 50-300 nm). An optimal gap allows evanescent wave coupling to the SPP on the adjacent metal surface. Too large a gap prevents coupling; too small a gap leads to scattering and damping.
Quantitative Parameters & Data
Table 1: Key Parameters for Otto Configuration Gap Control
| Parameter | Typical Range | Critical Influence | Measurement Technique |
|---|---|---|---|
| Gap Distance (d) | 50 nm - 300 nm | Coupling efficiency, resonance dip sharpness | Interferometry, piezoelectric feedback, SPR angle shift calibration. |
| Gap Uniformity | < ±5 nm variation | Quality of resonance curve (width, depth) | Imaging ellipsometry, multi-point laser reflectance. |
| Prism Refractive Index | 1.5 - 1.8 (e.g., SF11, LaSFN9) | Incident wavevector, required angle of incidence | Abbe refractometer. |
| Laser Wavelength (λ) | 633 nm (HeNe), 785 nm (diode) | Penetration depth, optimal gap distance | Spectrometer. |
| Resonance Angle (θ_SPR) | 60° - 75° (dependent on metal/λ) | Primary experimental observable | Goniometer resolution (< 0.001°). |
Detailed Protocol for Gap Alignment & Stabilization
Protocol: Piezo-Electric Gap Formation and Active Stabilization
- Materials Preparation: A high-index hemispherical or cylindrical prism is mounted on a high-precision goniometer stage. A clean, flat metal substrate (e.g., 50 nm Au on a glass slide) is mounted on a multi-axis piezo-electric transducer (PZT) stage opposite the prism base.
- Coarse Approach: Using micrometers, bring the metal substrate to within ~5 µm of the prism base. Monitor via a calibrated capacitance probe or optical interference fringes.
- Gap Formation: Engage fine control of the PZT. Move the metal substrate towards the prism in 10 nm steps. Simultaneously, direct a p-polarized laser (λ=633 nm) at a fixed angle near the expected SPR angle onto the prism and monitor reflected intensity with a photodiode.
- Initial Coupling Detection: A sharp drop in reflected intensity indicates the onset of SPP coupling. Record the PZT voltage at this point (V_contact). Retract the substrate by a predefined voltage corresponding to the target gap (e.g., 100 nm).
- Active Stabilization: Implement a feedback loop. Use a small AC modulation (e.g., 1 nm oscillation at 1 kHz) on the PZT. The reflected intensity signal will contain a component at the modulation frequency. The phase and amplitude of this component are used as an error signal to maintain a constant average gap distance via PID control of the PZT DC offset.
Sample Handling in Liquid & Gaseous Environments
Sample handling in the Otto configuration is uniquely challenged by the need to introduce analyte into the nanoscale gap without disturbing its geometry.
Protocol: Microfluidic Sample Introduction for Otto Configuration
- Flow Cell Fabrication: A microfluidic gasket (PDMS, Teflon) with a defined channel (height ~100 µm) is fabricated. The channel design must ensure uniform flow across the entire sensing area (typically 1-2 mm diameter).
- Integration: The gasket is sandwiched between the prism base and the metal substrate, with the gap distance mechanically defined by the gasket thickness minus the controlled retraction of the PZT. This creates a hybrid gap: a nano-gap for evanescent coupling and a micro-gap for fluidics.
- Priming and Flow: Use a syringe pump to prime the system with running buffer (e.g., PBS). The system must be thoroughly degassed to prevent bubble formation in the gap, which would destroy coupling.
- Kinetic Measurements: Switch the flow to analyte solution. The SPR angle shift (Δθ) is monitored in real-time. The Otto configuration's advantage is that the metal surface is pristine and can be characterized independently before assembly, allowing for more controlled surface functionalization (e.g., with drug targets) prior to the experiment.
The Scientist's Toolkit: Research Reagent Solutions
Table 2: Essential Materials for Otto Configuration Experiments
| Item | Function | Example/Specification |
|---|---|---|
| High-Index Prism | Provides wavevector matching for SPP excitation. | Hemispherical, LaSFN9 glass (n ~1.85 @ 633 nm). |
| Piezo-Electric Transducer (PZT) | Nano-positioning for gap control and active stabilization. | 3-axis closed-loop PZT stage, sub-nm resolution. |
| Gold-coated Substrate | Provides the plasmonic surface. | 47 nm Au on 2 nm Cr adhesion layer on BK7 glass. |
| Precision Goniometer | Accurate control and measurement of incident angle. | Motorized rotation stage, < 0.001° resolution. |
| p-Polarized Laser Source | Provides polarized excitation light for SPPs. | HeNe Laser (633 nm), with Glan-Thompson polarizer. |
| Microfluidic Flow System | Introduces analyte without disturbing the nano-gap. | Syringe pump, degasser, PDMS gasket with low dead volume. |
| Index Matching Fluid | Optical coupling between prism and mount. | Cargille Labs fluid, n_D = 1.85, non-drying. |
| Surface Functionalization Kit | Modifies gold surface with biorecognition elements. | Thiol-PEG-COOH for anti-fouling; NHS/EDC coupling chemistry. |
Visualization of Protocols and Relationships
Diagram 1: Otto Setup Alignment and Measurement Workflow (64 characters)
Diagram 2: Research Trade-off: Kretschmann vs. Otto (55 characters)
Ligand Immobilization Strategies for Gold Films (Kretschmann) and Dielectric Substrates (Otto)
This technical guide details ligand immobilization strategies tailored for surface plasmon resonance (SPR) configurations. The Kretschmann configuration, employing thin gold films, and the Otto configuration, utilizing dielectric substrates, present distinct surface chemistry challenges. This whitepaper, framed within a broader thesis comparing these two SPR methodologies, provides in-depth protocols, material specifications, and data analysis frameworks for researchers in biosensing and drug development.
The choice between Kretschmann and Otto configurations dictates the substrate material, which in turn imposes specific constraints and opportunities for ligand immobilization. The Kretschmann configuration relies on a thin (typically ~50 nm) gold film deposited on a glass prism. Gold's affinity for thiols enables robust self-assembled monolayer (SAM) formation. Conversely, the Otto configuration employs a dielectric substrate (e.g., glass, silicon) separated from the metal film by an air or fluid gap. This requires covalent chemistry directly on oxide or polymer surfaces. The immobilization strategy must maximize ligand density, orientation, and activity while minimizing non-specific binding, with the method fundamentally linked to the chosen SPR geometry.
Core Immobilization Chemistries
For Gold Films (Kretschmann)
Strategies exploit gold-thiol (Au-S) chemisorption.
- Alkanethiol SAMs: The foundational layer. Molecules like 11-mercaptoundecanoic acid (11-MUA) provide a ordered monolayer with terminal carboxyl groups for further coupling.
- Thiolated Biomolecules: Direct immobilization of ligands (e.g., peptides, DNA) synthesized with a terminal cysteine or disulfide group.
- Mixed SAMs: Incorporation of spacer thiols (e.g., PEG-thiols) to reduce steric hindrance and non-specific binding.
- Commercial Gold Coatings: Often pre-functionalized with carboxymethylated dextran hydrogels (e.g., CM5 chips) for high-capacity immobilization via amine coupling.
For Dielectric Substrates (Otto)
Strategies rely on silane chemistry or polymer coatings on glass/silicon.
- Silane Coupling: (3-Aminopropyl)triethoxysilane (APTES) introduces amine groups. (3-Glycidyloxypropyl)trimethoxysilane (GPTMS) introduces epoxide groups.
- Polymer Layers: Spin-coating of functional polymers (e.g., polycarboxylates, polyacrylates) to create a 3D matrix.
- Direct Covalent Linkage: Activation of native hydroxyl groups on glass via reagents like epoxy or aldehyde silanes.
Quantitative Comparison of Substrate Properties
Table 1: Substrate & Immobilization Characteristics
| Property | Kretschmann (Gold Film) | Otto (Dielectric Substrate) |
|---|---|---|
| Typical Substrate | 47-50 nm Au on glass/chromium | Bare glass, silicon, or functionalized dielectric |
| Key Chemistry | Au-Thiol (≈ 200 kJ/mol) | Silane-Oxide (Covalent), Adsorption |
| Typical Ligand Density | 1-4 x 10¹² molecules/cm² (SAM-based) | 0.5-2 x 10¹² molecules/cm² (planar silane) |
| Functional Group | -COOH (from MUA), -OH, -CH3 | -NH2 (APTES), Epoxy (GPTMS) |
| Non-Specific Binding | Low with PEG-modified SAMs | Can be higher; requires careful blocking |
| Commercial Chip Availability | Extensive (Biacore, Reichert, etc.) | Limited; often custom-fabricated |
Table 2: Common Coupling Protocols & Efficiency
| Immobilization Step | Reagent/ Condition | Kretschmann Example | Otto Example | Typical Efficiency |
|---|---|---|---|---|
| Surface Activation | EDC/NHS | 0.4M EDC / 0.1M NHS in water, 7 min flow | 50mM EDC / 20mM NHS in MES buffer, 10 min | >95% COOH activation |
| Ligand Coupling | pH, Concentration | 10-100 µg/mL in acetate buffer (pH 4.5-5.5) | 10-100 µg/mL in PBS or carbonate (pH 8.5 for amine) | 50-90% depending on ligand |
| Deactivation | Ethanolamine | 1M ethanolamine-HCl, pH 8.5, 7 min | 1M ethanolamine-HCl, pH 8.5, 10 min | Blocks remaining esters |
| Stability (Operational) | Continuous Flow | High (thiol-gold bond stable) | Moderate (susceptible to hydrolysis) | Days to weeks |
Detailed Experimental Protocols
Protocol A: Kretschmann Gold Film via Mixed SAM & Amine Coupling
- Substrate Preparation: Clean gold-coated glass slide (47nm Au, 2nm Cr adhesive) in piranha solution (3:1 H2SO4:H2O2) CAUTION: Highly corrosive. Rinse with ethanol and Milli-Q water, dry under N2.
- SAM Formation: Immerse slide in 1 mM ethanolic solution of 99% 11-mercaptoundecanoic acid (11-MUA) and 1% hexa(ethylene glycol) undecanethiol (EG6-thiol) for 24 hours at room temperature.
- Rinsing: Rinse thoroughly with absolute ethanol to remove physisorbed thiols, dry under N2.
- SPR Mounting: Mount functionalized slide onto the prism using index-matching oil in the Kretschmann setup.
- In-situ Activation & Coupling (Flow System):
- Prime system with HBS-EP buffer (10 mM HEPES, 150 mM NaCl, 3 mM EDTA, 0.005% v/v Surfactant P20, pH 7.4).
- Inject a 1:1 mixture of 0.4 M EDC and 0.1 M NHS for 7 minutes to activate carboxyl groups.
- Inject ligand (e.g., protein) solution (10-50 µg/mL in 10 mM sodium acetate buffer, pH 5.0) for a target immobilization level (e.g., 100-200 Response Units).
- Inject 1 M ethanolamine-HCl, pH 8.5, for 7 minutes to block unreacted esters.
- Regeneration Test: Inject a series of mild regeneration solutions (e.g., 10 mM glycine-HCl, pH 2.0-3.0) to establish a stable baseline for binding studies.
Protocol B: Otto Dielectric Substrate via APTES & Glutaraldehyde
- Substrate Preparation: Clean bare glass or silicon substrate in oxygen plasma for 5 minutes.
- Silanization: Vapor-phase silanization with (3-Aminopropyl)triethoxysilane (APTES). Place substrate in a vacuum desiccator with 100 µL APTES, evacuate for 30 minutes, then leave under vacuum for 2 hours at room temperature.
- Curing: Bake silanized substrate at 120°C for 1 hour to condense silanol groups.
- Linker Attachment: Immerse substrate in 2.5% (v/v) glutaraldehyde in PBS (pH 7.4) for 1 hour at room temperature. Rinse copiously with PBS and water.
- Ligand Coupling: Incubate substrate with amine-containing ligand (e.g., antibody, protein A) at 50 µg/mL in PBS (pH 7.4) for 2 hours at 4°C.
- Quenching: Incubate with 0.1 M glycine in PBS for 30 minutes to reduce remaining aldehyde groups.
- Otto Configuration Assembly: Precisely align and space the functionalized dielectric substrate opposite the gold-coated prism (typically using a micrometer-controlled stage) to establish the critical air/fluid gap.
The Scientist's Toolkit: Research Reagent Solutions
Table 3: Essential Materials for Ligand Immobilization
| Item | Function | Example Product/Catalog # (Illustrative) |
|---|---|---|
| Gold-coated Slides | Kretschmann substrate; 47-50nm Au with 1-2nm Cr/Ti adhesive. | G.214 from Sigma-Aldrich or equivalent from Phasis (Switzerland). |
| Functional Thiols | Form SAM on gold; provide -COOH for coupling. | 11-Mercaptoundecanoic acid (11-MUA), HS-(CH2)11-EG6-OH (PEG-thiol). |
| Coupling Agents (EDC/NHS) | Activate carboxyl groups to form amine-reactive esters. | 1-Ethyl-3-(3-dimethylaminopropyl)carbodiimide (EDC) and N-Hydroxysuccinimide (NHS). |
| Silane Coupling Agents | Functionalize dielectric (Otto) surfaces with amines or epoxies. | (3-Aminopropyl)triethoxysilane (APTES), (3-Glycidyloxypropyl)trimethoxysilane (GPTMS). |
| Crosslinkers | Provide extended spacer/linker on aminated surfaces. | Glutaraldehyde (25% solution), bis(sulfosuccinimidyl) suberate (BS3). |
| SPR Running Buffer | Maintain pH and ionic strength; minimize NSB with surfactant. | HBS-EP Buffer: 10mM HEPES, 150mM NaCl, 3mM EDTA, 0.005% P20, pH 7.4. |
| Regeneration Solutions | Dissociate bound analyte without damaging immobilized ligand. | Glycine-HCl (10-100mM, pH 2.0-3.0), NaOH (10-50mM). |
| Index Matching Oil | Ensure optical contact between prism and substrate in Kretschmann. | Cargille Laser Liquid Type FF, nD = 1.515. |
Visualization: Workflow & Pathway Diagrams
Diagram 1: Kretschmann Gold Film Functionalization Workflow
Diagram 2: Otto Dielectric Substrate Functionalization Workflow
Diagram 3: Thesis Framework Linking Config to Chemistry
Surface plasmon resonance (SPR)-based biosensing is a cornerstone technology for real-time, label-free analysis of biomolecular interactions in drug discovery. The performance of SPR instruments is fundamentally governed by the optical excitation configuration. The ongoing research thesis comparing the Kretschmann configuration versus the Otto configuration is critical for advancing this field. The Kretschmann configuration, where a thin metal film (typically gold) is deposited directly on the prism, is the industrial standard due to its robust and straightforward implementation. In contrast, the Otto configuration, which employs a thin dielectric spacer between the prism and the metal film, offers advantages in protecting the metal surface and tuning the evanescent field penetration depth. Current research indicates that while Kretschmann dominates practical drug discovery applications, the Otto configuration presents unique benefits for studying membrane-associated targets and complex cellular interfaces, areas of high importance in modern biotherapeutics. This guide details the application of SPR, predominantly using the Kretschmann paradigm, within the drug discovery pipeline.
Core Principles & Quantitative Comparison of Configurations
The choice of configuration impacts sensitivity, stability, and applicability. The following table summarizes key comparative data based on recent experimental studies.
Table 1: Quantitative Comparison: Kretschmann vs. Otto Configuration for SPR Biosensing
| Parameter | Kretschmann Configuration | Otto Configuration | Implication for Drug Discovery |
|---|---|---|---|
| Typical Sensitivity (RIU⁻¹) | 80 - 120 | 60 - 100 | Kretschmann offers marginally higher bulk refractive index sensitivity, beneficial for standard binding assays. |
| Field Penetration Depth (nm) | ~200-300 | Tunable, 100-500+ | Otto allows deeper field penetration, advantageous for studying large vesicles, cell membranes, and protein aggregates. |
| Metal Film Integrity | Direct exposure to flow cell. Risk of degradation/scratching. | Protected by dielectric spacer. Enhanced long-term stability. | Otto configuration may reduce sensor chip replacement frequency in high-throughput screening. |
| Experimental Complexity | Low. Robust, reproducible chip fabrication. | High. Requires precise control of dielectric gap uniformity. | Kretschmann's simplicity favors its widespread adoption in industrial labs. |
| Optimal Application | Soluble protein-protein, protein-small molecule interactions. | Membrane proteins in native-like lipid environments, cell-surface binding. | Otto is a focus of research for difficult membrane target classes (e.g., GPCRs, ion channels). |
| Commercial Availability | Widespread (Biacore, Nicoya, etc.). | Limited to specialized or research-grade instruments. | Kretschmann is the de facto standard for integrated drug discovery platforms. |
Detailed Experimental Protocol: Kinetic Characterization of a Protein-Small Molecule Interaction
This protocol assumes an SPR instrument using the Kretschmann configuration (e.g., Cytiva Biacore T200).
A. Reagent Preparation
- Immobilization: The target protein (e.g., kinase) is purified and buffer-exchanged into HBS-EP+ running buffer (10 mM HEPES, 150 mM NaCl, 3 mM EDTA, 0.05% v/v Surfactant P20, pH 7.4).
- Ligand Solutions: Serial dilutions of the small molecule inhibitor are prepared in running buffer from a DMSO stock. Final DMSO concentration across all samples must be identical (typically ≤1%).
- Sensor Chip: A CM5 (carboxymethylated dextran) sensor chip is used.
B. Target Immobilization (via Amine Coupling)
- Conditioning: Dock the CM5 chip and prime the system with HBS-EP+.
- Activation: Inject a 1:1 mixture of 0.4 M EDC and 0.1 M NHS for 7 minutes.
- Immobilization: Dilute the target protein to 10-50 µg/mL in 10 mM sodium acetate buffer (pH 4.5). Inject over the desired flow cell until the desired immobilization level (Response Units, RU) is achieved (typically 5-10,000 RU for kinetic analysis).
- Deactivation: Inject 1 M ethanolamine-HCl (pH 8.5) for 7 minutes to block remaining active esters.
- Reference Surface: A separate flow cell is activated and deactivated without protein to serve as a reference.
C. Kinetic Binding Experiment
- Baseline Stabilization: Flow running buffer at the operational temperature (e.g., 25°C) until a stable baseline is achieved.
- Association Phase: Inject small molecule dilutions (typically 5-8 concentrations, 3-fold serial dilution) over the target and reference surfaces at a constant flow rate (e.g., 30 µL/min) for 60-180 seconds.
- Dissociation Phase: Switch back to running buffer and monitor dissociation for 300-600 seconds.
- Regeneration: Inject a regeneration solution (e.g., 10 mM glycine pH 2.0 or a mild detergent) for 30-60 seconds to completely remove bound analyte without damaging the target. The condition must be determined empirically.
- Repeat steps 2-4 for all analyte concentrations in random order to avoid injection artifacts.
D. Data Analysis
- Reference Subtraction: Subtract the sensorgram from the reference flow cell from the target flow cell sensorgram.
- Double-Referencing: Further subtract the average response from a buffer-only injection.
- Kinetic Fitting: Fit the processed, concentration-series sensorgrams to a 1:1 Langmuir binding model using the instrument’s software (e.g., Biacore Evaluation Software). The model solves the differential equations for
ka(association rate constant, M⁻¹s⁻¹) andkd(dissociation rate constant, s⁻¹). - Derived Metrics: Calculate the equilibrium dissociation constant
KD = kd/ka(M). Reportχ²and residual plots to assess goodness of fit.
Signaling Pathway & Workflow Visualizations
Diagram 1: SPR Experimental Workflow (76 chars)
Diagram 2: Binding to Phenotype Logic Flow (79 chars)
The Scientist's Toolkit: Key Research Reagent Solutions
Table 2: Essential Materials for SPR-Based Interaction Analysis
| Item | Function & Specification | Key Consideration for Drug Discovery |
|---|---|---|
| SPR Instrument | Optical system (Kretschmann/Otto), microfluidics, and detector for real-time monitoring. | Throughput, sensitivity, automation, and software for regulatory compliance (21 CFR Part 11). |
| Sensor Chips | Functionalized gold surfaces (e.g., CM5 dextran, NTA for His-tag, L1 for liposomes). | Choice dictates immobilization strategy. L1 chips are vital for membrane protein studies. |
| Running Buffer | HBS-EP+ is standard. Must minimize non-specific binding and maintain protein stability. | DMSO compatibility is essential for small molecule screening. Buffer standardization is critical for reproducibility. |
| Immobilization Kits | Amine coupling (EDC/NHS, ethanolamine), thiol coupling, or capture kits (anti-GST, anti-Fc). | Defines ligand orientation and activity. Capture methods often preserve native protein function better. |
| Regeneration Solutions | Low/high pH buffers (glycine), salts, detergents, or chaotropes. | Must fully dissociate complex without inactivating the immobilized target. Empirical screening required. |
| High-Purity Analytes/Ligands | Target proteins (>95% purity), small molecule compounds (known concentration/DMSO stock). | Protein monodispersity is crucial. Compound solubility and aggregation potential must be assessed. |
| Data Analysis Software | Proprietary (Biacore Insight) or third-party (Scrubber, TraceDrawer) for kinetic modeling. | Ability to fit complex interaction models (heterogeneity, bivalent, conformational change) is increasingly important. |
This whitepaper provides an in-depth technical guide on the application of Kretschmann and Otto configurations for studying membrane proteins and lipid bilayers. It is framed within the context of a broader thesis comparing the fundamental principles, experimental advantages, and specific use cases of these two primary surface plasmon resonance (SPR) coupling methods in biophysical research.
Core Principles: Kretschmann vs. Otto for Biological Interfaces
Surface plasmon resonance is a label-free, real-time technique for monitoring biomolecular interactions. The choice of configuration profoundly impacts the quality of data obtained from delicate membrane-mimetic systems.
- Kretschmann Configuration: The most common setup. A thin metal film (typically gold, 50 nm) is deposited directly on the prism. The biomembrane system (e.g., a supported lipid bilayer or tethered vesicle) is assembled on the metal surface. Light undergoes total internal reflection at the prism/metal interface, exciting surface plasmons.
- Otto Configuration: A dielectric spacer (e.g., a silica layer or the aqueous sample itself) separates the metal film from the prism. The biomembrane system is assembled on the metal, but the evanescent field probes it through this spacer.
The central thesis in membrane studies posits that the Kretschmann configuration offers superior signal strength and experimental simplicity for most applications, while the Otto configuration provides a critical advantage by preventing direct interaction of the biomembrane with the metal surface, reducing denaturation and more closely mimicking a native cellular environment.
Quantitative Comparison of Configurations
Table 1: Performance Comparison for Membrane Protein Studies
| Parameter | Kretschmann Configuration | Otto Configuration |
|---|---|---|
| Field Decay Length | ~200 nm (into sample) | Tunable; longer by adjusting spacer thickness. |
| Typical Sensitivity (RIU) | High (2x10⁻⁶ – 5x10⁻⁷) | Slightly Lower (requires precise spacer control) |
| Membrane Integrity | Risk of protein denaturation on metal. | Superior; spacer preserves native conformation. |
| Supported Bilayer Setup | Straightforward deposition on gold. | Complex; requires precise spacer fabrication. |
| Throughput & Robustness | High; commercially dominant. | Lower; primarily a research tool. |
| Key Application | Ligand binding kinetics to membrane targets. | Structural studies of sensitive proteins. |
Table 2: Experimental Data from a Model GPCR Study (Hypothetical Data Based on Current Literature)
| Experiment | Configuration | Measured KD (nM) | On-rate (kon) M⁻¹s⁻¹ | Off-rate (koff) s⁻¹ | Notes |
|---|---|---|---|---|---|
| Agonist Binding | Kretschmann | 5.2 ± 0.8 | 1.5 x 10⁶ | 7.8 x 10⁻³ | Strong signal, stable baseline. |
| Agonist Binding | Otto | 18.5 ± 3.2 | 4.2 x 10⁵ | 7.8 x 10⁻³ | Slower observed on-rate may reflect spacer damping. |
| Antagonist Binding | Kretschmann | 1.1 ± 0.2 | 2.1 x 10⁶ | 2.3 x 10⁻³ | Robust data. |
| Antagonist Binding | Otto | 1.3 ± 0.4 | 1.8 x 10⁶ | 2.3 x 10⁻³ | Similar kinetics, confirming native conformation. |
Detailed Experimental Protocols
Protocol 1: Forming a Hybrid Lipid Bilayer in Kretschmann Configuration for Protein Insertion
Objective: Create a stable, fluid membrane on a gold sensor chip for measuring ligand binding to an incorporated receptor.
- Surface Preparation: Clean a gold-coated SPR sensor chip (47-50 nm Au over 2 nm Cr adhesion layer) in piranha solution (3:1 H₂SO₄:H₂O₂). CAUTION: Highly corrosive. Rinse with ethanol and Millipore water, dry under N₂.
- Self-Assembled Monolayer (SAM) Formation: Immerse chip in 1 mM solution of alkanethiol (e.g., 90% mercaptounderanol : 10% mercaptohexadecanoic acid) in ethanol for 12-24 hours. This creates a hydrophilic surface.
- Lipid Monolayer Fusion: Inject small unilamellar vesicles (SUVs, 50 nm diameter) of desired lipid composition (e.g., POPC:Cholesterol 7:3) in HEPES buffer over the SAM at 25 μL/min for 30 minutes. Vesicles rupture to form a continuous lipid monolayer on the SAM.
- Membrane Protein Incorporation: Dilute detergent-solubilized, purified membrane protein (e.g., a GPCR) into a micellar solution. Inject over the hybrid bilayer. Micelles destabilize, allowing protein to insert into the lipid layer. Wash extensively.
- Ligand Binding Assay: Perform kinetic injections of ligand analytes at varying concentrations in running buffer. Analyze association/dissociation phases to determine kinetics (ka, kd) and affinity (KD).
Protocol 2: Building a Spacer-Coupled Membrane in Otto Configuration
Objective: Assemble a membrane atop a dielectric spacer to isolate proteins from the metal.
- Spacer Fabrication: Use a silica-coated SPR chip or deposit a precise layer of SiO₂ (e.g., 100-500 nm) via plasma-enhanced chemical vapor deposition (PECVD) onto the gold film.
- Surface Functionalization: Activate silica surface with oxygen plasma. Use silane chemistry (e.g., (3-aminopropyl)triethoxysilane, APTES) to create an amine-terminated layer.
- Lipid Bilayer Formation: Employ the Langmuir-Blodgett/Langmuir-Schaefer (LB/LS) transfer technique. First, a lipid monolayer is transferred vertically (LB) onto the spacer. Then, a second monolayer is transferred horizontally (LS) to form a complete bilayer. Alternatively, use vesicle fusion onto a highly hydrophilic spacer.
- Protein Reconstitution: Proteoliposomes (vesicles containing pre-reconstituted protein) are prepared. These are flowed over the spacer-supported bilayer, where they fuse, delivering the protein into the pre-formed membrane.
- SPR Measurement: Align the prism precisely to maintain the critical air/spacer gap. Perform ligand binding studies as in Protocol 1.
Signaling Pathway & Experimental Workflow Visualizations
Title: SPR Configuration Decision & Workflow
Title: GPCR Signaling Pathway & SPR Detection Point
The Scientist's Toolkit: Research Reagent Solutions
Table 3: Essential Materials for SPR-based Membrane Studies
| Item | Function & Description | Typical Supplier/Example |
|---|---|---|
| SPR Instrument | Core platform for excitation and detection of plasmons. | Biacore (Cytiva), SPR Navi (BioNavis), OpenSPR (Nicoya). |
| Sensor Chips (Kretschmann) | Gold-coated glass slides with precise optical properties. | Cytiva Series S Sensor Chip Au, XanTec biochips. |
| Sensor Chips (Otto) | Custom chips with dielectric spacer (SiO₂, polymers). | Fabricated in-house or by specialty vendors (e.g., Ssens). |
| Functional Lipids | Lipids for bilayer formation with reactive headgroups (e.g., DOPE-cap-biotin, DOGS-NTA-Ni). | Avanti Polar Lipids, Sigma-Aldrich. |
| Detergents | For protein solubilization and micelle formation during insertion. | n-Dodecyl-β-D-maltoside (DDM), Lauryl Maltose Neopentyl Glycol (LMNG). |
| Blocking Agents | Minimize non-specific binding to sensor surface. | Bovine Serum Albumin (BSA), casein, surfactant P20. |
| Coupling Reagents | For covalent immobilization of capture molecules (if used). | EDC/NHS chemistry kits. |
| Microfluidic System | Precise, pulsation-free buffer and sample delivery. | Integrated into commercial SPR systems. |
| Data Analysis Software | Fitting sensorgrams to kinetic and equilibrium models. | Scrubber (BioLogic), Biacore Evaluation Software, TraceDrawer. |
Overcoming Challenges: Troubleshooting and Enhancing SPR Configuration Performance
The Kretschmann configuration is the predominant method for exciting surface plasmon resonance (SPR) for label-free biosensing. Within the broader thesis comparing the Kretschmann and Otto configurations, a critical analysis reveals distinct advantages and persistent challenges. While the Kretschmann setup (thin metal film on a prism) offers superior practicality for liquid sensing compared to the Otto configuration (an air gap between prism and metal), it introduces several inherent experimental issues. This whitepaper details the core challenges of nonspecific binding, gold film degradation, and bulk refractive index effects, which are often more pronounced in Kretschmann than in Otto due to the direct sample contact with the sensor surface. Understanding and mitigating these issues is paramount for advancing SPR biosensing in drug development and basic research.
Nonspecific Binding
Nonspecific binding (NSB) refers to the adsorption of non-target molecules to the sensor surface or the molecular recognition layer, leading to false-positive signals and reduced sensitivity.
Table 1: Common NSB Mitigation Strategies and Reported Efficacy
| Mitigation Strategy | Substrate/Coating | Reported % Reduction in NSB | Key Application |
|---|---|---|---|
| PEGylation | Poly(ethylene glycol) thiols | 70-95% | Serum, plasma studies |
| Carbohydrate Matrices | Dextran, carboxymethylated dextran | 60-85% | Antibody-antigen kinetics |
| Surface Blockers | Bovine Serum Albumin (BSA), casein | 50-80% | Cell lysate, crude samples |
| Zwitterionic Layers | Poly(carboxybetaine) | >90% | Undiluted whole blood |
| Mixed Self-Assembled Monolayers (SAMs) | EG6-OH / EG3-COOH mixtures | 75-90% | Small molecule screening |
Experimental Protocol: Passivation with Mixed SAMs
A detailed protocol for creating a low-fouling, functional surface for ligand immobilization:
- Gold Substrate Cleaning: Sonicate a fresh gold sensor chip in absolute ethanol for 10 minutes, rinse with Milli-Q water, and dry under a stream of nitrogen.
- Oxygen Plasma Treatment: Treat the chip in a plasma cleaner for 2 minutes at medium power to remove organic contaminants and refresh the gold surface.
- SAM Formation: Immediately immerse the chip in a 1 mM ethanolic solution containing a mixture of (1) a carboxylic acid-terminated thiol (e.g., 11-mercaptoundecanoic acid, 90% of molecules) and (2) a hydroxyl-terminated thiol (e.g., 6-mercapto-1-hexanol, 10% of molecules). Incubate overnight at room temperature in a sealed vial.
- Rinsing: Rinse the chip thoroughly with absolute ethanol, followed by Milli-Q water, and dry under nitrogen.
- Surface Activation: The carboxylic acid groups are activated using a standard EDC/NHS (400 mM/100 mM) coupling chemistry for 7 minutes.
- Ligand Immobilization: The target ligand (e.g., an antibody, protein receptor) is diluted in a suitable low-ionic-strength acetate buffer (pH 4.5-5.5) and injected over the surface for 5-10 minutes.
- Deactivation & Blocking: Inject 1 M ethanolamine-HCl (pH 8.5) for 7 minutes to deactivate remaining NHS esters. Finally, inject a 0.1% (w/v) solution of BSA in running buffer for 5 minutes to block any residual nonspecific sites.
Gold Film Degradation
The thin (typically 50 nm) gold film is vulnerable to chemical and physical degradation, which alters plasmonic properties and ruins experiments.
Table 2: Causes and Effects of Gold Film Degradation
| Degradation Mechanism | Primary Cause | Observable Effect on SPR Signal | Typical Timeframe |
|---|---|---|---|
| Adlayer Corrosion/Scratching | Improper cleaning, mechanical contact | Permanent baseline shift, increased noise | Immediate/Acute |
| Sulfur Compound Adsorption | Exposure to thiols, atmospheric H₂S | Permanent baseline shift, reduced sensitivity | Hours to days |
| Surface Oxidation/Contamination | Exposure to ozone, organics in air | Gradual baseline drift | Days to weeks |
| Delamination | Poor adhesion layer (Cr/Ti) quality, extreme pH | Complete signal loss, visual damage | Acute or chronic |
Experimental Protocol: Assessing Film Quality via CV
A simple electrochemical protocol to check gold film integrity before SPR use:
- Setup: Use a standard three-electrode electrochemical cell with the gold chip as the working electrode, a platinum wire counter electrode, and an Ag/AgCl reference electrode. The electrolyte is 0.5 M H₂SO₄.
- Cleaning: Electrochemically clean the surface by cycling the potential between 0 V and +1.5 V (vs. Ag/AgCl) at a scan rate of 100 mV/s for 20-30 cycles until a stable cyclic voltammogram (CV) is obtained.
- Characterization: Record a final CV between 0 V and +1.5 V at 50 mV/s.
- Analysis: A high-quality, clean polycrystalline gold film will show characteristic gold oxide formation (~+1.2-1.4 V) and sharp reduction peaks (~+0.8-0.9 V). The charge under the gold oxide reduction peak is proportional to the electroactive surface area. A distorted CV indicates contamination or poor film morphology.
Bulk Refractive Index Effects
Bulk effects are changes in the SPR signal caused by alterations in the refractive index (RI) of the solution overlaying the sensor surface, unrelated to specific binding events. These are a major source of noise and false positives.
Table 3: Sources of Bulk Refractive Index Changes
| Source of Change | Typical ΔRI (RIU) | Equivalent Mass Change (ng/cm²) | Correction Method |
|---|---|---|---|
| Temperature Drift (0.01°C) | ~1 x 10⁻⁶ | ~0.1 | Active temperature control |
| Buffer Concentration (1% salt) | ~1.75 x 10⁻⁴ | ~17.5 | Reference channel, meticulous buffer matching |
| Sample Matrix (e.g., DMSO) | High (e.g., 0.2% DMSO ΔRI=5.4x10⁻⁴) | ~54 | Dilution, calibration curves, dual-wavelength SPR |
| Cellular Debris/lysis | Variable, often large | N/A | Sample clarification, filtration |
Experimental Protocol: Dual-Referencing for Bulk Effect Correction
This standard protocol minimizes bulk effect artifacts:
- Surface Preparation: Create at least two flow channels on the same sensor chip: (A) an active surface with immobilized ligand, and (B) a reference surface with a non-interacting but otherwise similar coating (e.g., a passivated surface or an immobilized irrelevant protein).
- Buffer Baseline: Establish a stable baseline with running buffer over both channels.
- Sample Injection: Inject the analyte sample (e.g., drug candidate in running buffer with 0.5% DMSO) simultaneously over both the active and reference channels.
- Data Processing:
- Step 1 - Reference Subtraction: Subtract the sensorgram from channel B (reference) from channel A (active). This removes most of the bulk RI shift and system noise.
- Step 2 - Blank Subtraction: Perform a separate injection of a "blank" solution (running buffer with 0.5% DMSO but no analyte) over both channels. Subtract this blank-referenced signal from the sample-referenced signal obtained in Step 1. This removes any residual artifacts due to minor buffer mismatches.
Visualizations
Mitigating Nonspecific Binding Surface Preparation Workflow
Causes and Consequences of Bulk Refractive Index Effects
The Scientist's Toolkit: Research Reagent Solutions
Table 4: Essential Materials for Addressing Kretschmann SPR Issues
| Item | Function / Purpose | Specific Example / Note |
|---|---|---|
| CM5 or Similar Sensor Chip | Gold surface with a pre-formed carboxylated dextran hydrogel. Provides a standard, well-characterized substrate for ligand immobilization with some inherent passivation. | Cytiva Series S CM5 chip. |
| PEGylated Thiols | Form self-assembled monolayers (SAMs) to dramatically reduce nonspecific binding from complex fluids. | HS-(CH₂)₁₁-(EG)₆-OH (EG6 Thiol). |
| Carboxylated Thiols | Provide functional groups (-COOH) for covalent ligand immobilization via EDC/NHS chemistry within a mixed SAM. | 11-Mercaptoundecanoic acid (11-MUA). |
| EDC & NHS | Crosslinking agents that activate carboxyl groups to form amine-reactive esters for coupling to protein ligands. | 1-ethyl-3-(3-dimethylaminopropyl)carbodiimide and N-hydroxysuccinimide. |
| Ethanolamine-HCl | A small amine-containing molecule used to "deactivate" or "quench" remaining NHS esters after ligand coupling, blocking unreacted sites. | Typically used at 1 M, pH 8.5. |
| Bovine Serum Albumin (BSA) | A common blocking protein used to passivate any remaining hydrophobic or charged sites on the sensor surface after functionalization. | Use fatty-acid-free, protease-free grade. |
| Running Buffer Additives | Surfactants (e.g., Tween 20) added at low concentration (0.005-0.05%) to running buffers to minimize nonspecific hydrophobic interactions. | Polysorbate 20 (Tween 20). |
| Dual-Channel or Multi-Spot SPR Instrument | Enables simultaneous measurement on active and reference surfaces, which is critical for subtracting bulk refractive index effects and system drift. | Instruments from Biacore (Cytiva), Reichert, or BioNavis. |
Framed within the context of Kretschmann vs Otto configuration research
Within the domain of surface plasmon resonance (SPR) spectroscopy, the Otto and Kretschmann configurations represent the two primary attenuated total reflection (ATR) methodologies for exciting surface plasmons. The Otto configuration, which employs an air or dielectric gap between the prism and the metal film, is particularly valued for studying plasmonic interactions with thick adsorbates or biological samples where direct metal contact is undesirable. However, its experimental implementation is notoriously challenging. This technical guide details the core issues of gap stability, contamination, and precise alignment maintenance, which are critical variables in comparative research against the more robust Kretschmann setup. The integrity of such comparative studies hinges on the rigorous management of these Otto-specific parameters.
Gap Stability: The Quintessential Challenge
The heart of the Otto configuration is the precise, nanometer-scale gap between the prism base and the thin metal film (typically Au or Ag). Instability in this gap directly modulates the evanescent field coupling, introducing significant noise and systematic error.
Quantitative Data on Gap Effects
Table 1: Impact of Gap Width Variation on Resonance Parameters (Theoretical)
| Gap Width (nm) | Resonance Angle Shift (Degrees) | Resonance Dip Width (a.u.) | Coupling Efficiency (%) |
|---|---|---|---|
| 50 | 0.00 (Reference) | 1.00 | 98.5 |
| 55 | +0.15 | 1.12 | 92.1 |
| 60 | +0.32 | 1.28 | 85.0 |
| 65 | +0.51 | 1.47 | 76.5 |
| 70 | +0.72 | 1.70 | 67.3 |
Assumptions: 632.8 nm wavelength, BK7 prism (n=1.515), 50 nm Au film, air gap. Calculations based on transfer matrix method.
Experimental Protocol: Piezoelectric Gap Stabilization
Title: Protocol for Active Gap Control in Otto Configuration
Objective: To maintain a fixed gap width (±1 nm) using a closed-loop piezoelectric positioning system.
Materials:
- High-resolution piezoelectric transducer (PZT) stack (e.g., 100 nm/V sensitivity).
- Capacitance micrometer or laser interferometer for gap measurement (sub-nm resolution).
- Lock-in amplifier and feedback controller (PID).
- Differential screw mechanism for coarse initial gap setting.
- Vibration isolation table.
Methodology:
- Coarse Alignment: Using the differential screw mechanism, bring the prism and metal film to a gap of approximately 100-200 nm, verified via optical interference fringes.
- Sensor Integration: The capacitance micrometer probe is positioned to measure the gap distance continuously. This signal serves as the input to the feedback controller.
- Feedback Loop Establishment: The desired set-point gap (e.g., 60 nm) is entered into the PID controller. The controller compares the measured gap to the set-point.
- Active Stabilization: Any deviation (e.g., from thermal drift) generates an error signal. The PID controller outputs a correction voltage to the PZT, which expands or contracts to return the gap to the set-point.
- Validation: SPR angular scans are performed over time. Gap stability is confirmed by a standard deviation of the resonance angle of less than 0.01° over a 1-hour period.
Contamination of the Gap Region
The nano-gap is highly susceptible to contaminants (dust, condensed volatiles, oxides), which alter the dielectric constant of the gap medium, leading to irreversible drift and unreliable data.
Experimental Protocol: In-Situ Plasma Cleaning and Environmental Control
Title: Protocol for Contamination Prevention in Otto Gap
Objective: To establish and maintain a pristine dielectric gap environment.
Materials:
- Glove box or environmental chamber with humidity/T control.
- Inert gas supply (Argon, Nitrogen) with high-purity purifier.
- Miniature RF plasma cleaner mounted within the sample chamber.
- High-vacuum components and turbomolecular pump.
- Particle-free sample handling tools.
Methodology:
- Assembly in Controlled Environment: All components (prism, spacer, metal film substrate) are cleaned in solvent baths (piranha etch for substrates, followed by acetone and ethanol) and assembled within an argon-purged glove box (<1 ppm H₂O, O₂).
- Pre-Experiment Plasma Treatment: After assembly and initial pump-down in the SPR instrument chamber, a low-power Ar plasma is ignited within the gap region for 2-5 minutes to desorb any residual organic contaminants from the metal and prism surfaces.
- Gap Purging: The chamber is back-filled with dry, inert gas (N₂ or Ar) to the desired pressure, establishing the uniform dielectric medium for the gap.
- Sealing: For long-term experiments, the gap periphery is sealed with a vacuum-compatible, low-outgassing epoxy to prevent ambient incursion.
- Monitoring: A control SPR measurement using a known, stable analyte (e.g., buffer solution refractive index) is run periodically to detect any contamination-induced baseline drift.
Precise Angular Alignment Maintenance
Accurate initial alignment and its maintenance are more critical in the Otto configuration than in Kretschmann due to the sensitivity of the gap coupling.
Quantitative Data on Misalignment Effects
Table 2: Impact of Angular Misalignment on Measured Resonance Angle
| Misalignment Type | Error (mrad) | Induced Resonance Angle Error (Degrees) | Comment |
|---|---|---|---|
| Prism Rotation (θ) | ±1.0 | ±1.0 (Direct) | Direct scaling. |
| Beam Lateral Shift | 100 µm | ±0.05 - ±0.15 | Depends on lensing. |
| Gap Non-Parallelism | 0.1 mrad | ±0.02 - ±0.08 | Causes gap gradient. |
Experimental Protocol: Auto-Collimation Alignment
Title: Protocol for Initial Alignment of Otto Configuration
Objective: To achieve precise parallel alignment between the prism base and metal film.
Materials:
- Auto-collimator or shear-plate interferometer.
- Kinematic mirror mounts with fine-thread adjusters (e.g., 80 threads per inch).
- He-Ne alignment laser.
- Beam profiling camera.
Methodology:
- Prism Face Normal Alignment: The prism is mounted on a goniometer. The auto-collimator is used to ensure the input face of the prism is normal to the incident beam. The prism mount is adjusted until the return beam from this face coincides with the source.
- Metal Film Surface Alignment: The substrate holding the metal film is mounted on a tip-tilt stage. A separate auto-collimator beam is reflected off the metal film surface. The tip-tilt stage is adjusted until this reflected beam is coincident with its source, ensuring the metal film surface is normal to the probe beam path.
- Parallelism Verification: With both surfaces individually aligned to the same optical axis, they are inherently parallel. This is verified by observing a uniform interference fringe pattern (Fizeau fringes) in the gap when illuminated with a monochromatic source. Adjustments are made to minimize fringe curvature, indicating parallelism.
- Beam Path Finalization: The alignment laser is replaced by the SPR light source (e.g., laser diode or monochromator output), and its position is fine-tuned using the beam profiling camera to ensure it is centered and normal at the point of incidence.
The Scientist's Toolkit: Research Reagent Solutions
Table 3: Essential Materials for Advanced Otto Configuration Research
| Item | Function & Rationale |
|---|---|
| Piezoelectric Nano-Positioners | Provides active, sub-nanometer control of the gap width to counteract thermal and mechanical drift. Essential for stability. |
| Capacitive/Interferometric Gap Sensor | Enables real-time, non-contact measurement of the absolute gap distance for closed-loop feedback systems. |
| High-Precision Goniometer | Allows angular resolution better than 0.001° for accurate resonance angle determination and comparative studies. |
| Inert Environmental Chamber | Encloses the entire Otto setup to control atmosphere (dry N₂/Ar), preventing condensation and oxidation in the gap. |
| In-Situ RF Plasma Cleaner | Removes organic contaminants from prism and metal surfaces immediately before experiment initiation within the sealed chamber. |
| Index-Matching Fluid (Low-Vapor Pressure) | Optically couples the prism to the holder, eliminating unwanted air gaps. Low vapor pressure prevents outgassing into the critical nano-gap. |
| Standardized Refractive Index Liquids (e.g., Cargille Labs) | Used for daily calibration of the SPR instrument, distinguishing between instrument drift and true sample effects. Critical for comparative Kretschmann-Otto studies. |
| Ultra-Flat, Monodisperse Silica Nanospheres | Serve as a physical gap standard and calibration analyte. Their well-defined size and dielectric constant provide a benchmark for gap width validation. |
Visualizations
Title: Interrelationship of Core Otto Issues Affecting Data Integrity
Title: Integrated Experimental Protocol for Robust Otto Setup
Thesis Context: This technical guide examines Signal-to-Noise Ratio (SNR) optimization within the framework of comparative research between the Kretschmann and Otto configurations for surface plasmon resonance (SPR) sensing. Superior SNR is critical for detecting low-concentration analytes and subtle binding events, directly impacting the efficacy of drug discovery and biomolecular interaction studies.
Light Source Optimization
The choice and management of the light source fundamentally limit SNR in SPR systems.
Key Parameters:
- Spectral Stability: Minimizes baseline drift. Laser sources offer high intensity but are prone to coherence noise. LEDs provide lower spatial coherence, reducing speckle noise.
- Polarization Purity: Essential for exciting surface plasmons. Extinction ratios >20 dB are typically required.
- Intensity Stability: Directly impacts shot noise and baseline stability. Active feedback control is often employed.
Experimental Protocol for Source Characterization:
- Setup: Direct the light source onto a photodetector with a known responsivity.
- Measurement: Record output power over 1 hour using a calibrated optical power meter. Sample at 10 Hz.
- Analysis: Calculate intensity noise as the standard deviation of the recorded power divided by the mean. Characterize temporal drift via linear regression.
Quantitative Comparison of Common Sources:
Table 1: Light Source Characteristics for SPR Configurations
| Source Type | Typical Wavelength (nm) | Intensity Stability (over 1 hr) | Coherence Noise | Best Suited For |
|---|---|---|---|---|
| Laser Diode | 630-850 | ±0.5% | High | Kretschmann (precise angle) |
| LED with Filter | 600-900 | ±1.0% | Low | Otto (requires lower coherence) |
| Tunable Laser | 400-1100 | ±0.2% | Very High | Spectral SPR, both configurations |
Detector Selection and Operation
The detector converts optical signals to electrical ones, introducing its own noise floor.
Critical Noise Sources:
- Shot Noise: Fundamental noise from quantized nature of light (proportional to √N).
- Read Noise: Fixed noise per pixel from readout electronics.
- Dark Current Noise: Thermally generated electrons (doubles every ~6°C rise).
Experimental Protocol for Detector Calibration:
- Dark Frame Acquisition: Cap the detector. Acquire 1000 frames at the intended integration time. Calculate the mean and temporal standard deviation per pixel to map read noise and dark current.
- Flat Field Acquisition: Illuminate with a uniform, stable source. Acquire 1000 frames. The variance provides photon transfer data to calculate gain (e-/ADU) and full-well capacity.
Detector Performance Data:
Table 2: Detector Technologies for SPR Imaging
| Detector Type | Quantum Efficiency (@750 nm) | Read Noise (e-) | Dark Current (e-/pix/s) | Advantage |
|---|---|---|---|---|
| sCMOS | ~70% | 1-2 | 0.1-1.0 | High speed, low read noise |
| CCD (EMCCD) | ~90% | <1 (after gain) | 0.01-0.1 | Extremely low effective noise for weak signals |
| Photodiode Array | ~80% | 100-1000 | 10-100 | High dynamic range, simple operation |
Data Processing Techniques
Post-acquisition processing is essential to extract the signal from system and environmental noise.
Core Techniques:
- Temporal Filtering: Low-pass filters (e.g., Savitzky-Golay) smooth temporal kinetics. High-pass filters remove baseline drift.
- Spatial Filtering: For imaging SPR (SPRi), apply flat-field correction using reference pixels or frames to correct for non-uniform illumination.
- Averaging: Ensemble averaging across repeated experiments or spatial averaging across adjacent pixels improves SNR by √N.
Detailed Protocol for SPR Kinetic Data Processing:
- Reference Subtraction: Subtract response from a reference flow channel or spot.
- Outlier Removal: Apply a median filter or Hampel identifier to remove spike noise.
- Low-Pass Filtering: Apply a 3rd-order Savitzky-Golay filter with a window optimized for the binding kinetics.
- Baseline Alignment: Normalize the baseline period (before analyte injection) to zero.
Application in Kretschmann vs. Otto Configuration Research
SNR requirements differ between the two primary attenuated total reflection (ATR) configurations.
- Kretschmann Configuration: A metal film is deposited directly on the prism. Higher field enhancement but susceptible to microstructure noise from the metal film. Requires excellent polarization purity and angular stability.
- Otto Configuration: A thin air gap exists between the prism and the metal layer. Lower field strength but cleaner interface, reducing non-specific binding noise. Benefits from lower-coherence light sources to mitigate interference fringes from the gap.
Table 3: SNR Optimization Focus by Configuration
| Optimization Factor | Kretschmann Configuration Priority | Otto Configuration Priority |
|---|---|---|
| Light Source | Polarization purity, angular collimation | Temporal coherence control, stability |
| Detector | High dynamic range, linearity | Low read noise for weaker signals |
| Data Processing | Fixed-pattern noise correction (film defects) | Drift removal, interference artifact suppression |
Experimental Workflow for Comparative SNR Measurement:
Diagram 1: Workflow for SNR comparison in SPR configurations
Key Signaling Pathway in SPR-Based Drug Discovery:
Diagram 2: From binding event to optimized SPR signal
The Scientist's Toolkit: Research Reagent Solutions
Table 4: Essential Materials for SNR-Critical SPR Experiments
| Item | Function & Role in SNR Optimization |
|---|---|
| High-Purity Gold Chips (for Kretschmann) | Provide a smooth, homogeneous metal film to minimize scattering and non-uniformity noise. |
| Precision Gap Spacers (for Otto) | Define the air/fluid gap with nanometer accuracy to ensure consistent plasmon coupling. |
| Index-Matching Oil | Eliminates air gaps between prism and substrate, reducing stray light and interference noise. |
| Degassed, Filtered Running Buffer | Prevents bubble formation and particulate scattering during flow, a major source of spike noise. |
| Bio-Inert Surfactant (e.g., Tween 20) | Reduces non-specific binding to the sensor surface, lowering background drift. |
| Reference Channel/Spot Reagents | Allows for real-time subtraction of bulk refractive index changes and instrumental drift. |
| Stable, Purified Ligand | Ensures a uniform, high-affinity surface for immobilization, producing a clean, analyzable signal. |
Within the persistent research into surface plasmon resonance (SPR) biosensing, the Kretschmann and Otto configurations represent the foundational paradigms for attenuated total reflection (ATR)-based excitation. This whitepaper situates advanced sensitivity-enhancement strategies within the core thesis that while the Kretschmann configuration (direct metal-dielectric contact) offers greater experimental practicality, the Otto configuration (with an analyte dielectric gap) provides a pristine environment for probing fundamental interactions and certain nanoscale phenomena. The relentless pursuit of lower detection limits for biomarkers and drug candidates necessitates moving beyond conventional single-metal films. This guide details contemporary, advanced material and structural strategies applicable to both configurations, supported by recent experimental data and protocols.
Core Enhancement Strategies: A Comparative Framework
Nanostructuring of the Plasmonic Interface
Nanostructuring introduces controlled roughness or discrete nanostructures to amplify the local electric field (E-field), thereby enhancing the sensitivity factor and the figure of merit (FOM).
For Kretschmann Configuration: Nanostructuring is applied directly to the thin metal film (typically Au or Ag). Methods include:
- Post-Deposition Annealing: Creates quasi-periodic nanoparticle arrays via solid-state dewetting.
- Direct Nano-Patterning: Using nanoimprint lithography or electron-beam lithography to create nanogratings, nanohole arrays, or discrete nanoantennas on the prism base before metal deposition.
For Otto Configuration: Nanostructuring is more complex due to the required gap. It can be applied to:
- The Reflector Surface: The metal surface facing the analyte gap can be nanostructured.
- The Prism Base: Creating nanofeatures on the prism itself, establishing a defined, nanoscale gap.
Table 1: Performance Metrics of Nanostructuring Strategies (Recent Data)
| Configuration | Nanostructure Type | Sensitivity (nm/RIU)* Increase vs. Flat | FOM (RIU⁻¹) | Key Application |
|---|---|---|---|---|
| Kretschmann | Au Nanoislands (Annealed) | 3,800 (≈ 1.4x) | 45 | Protein-protein interaction kinetics |
| Kretschmann | Ag Nanograting (300 nm pitch) | 5,200 (≈ 1.9x) | 98 | Viral particle detection |
| Otto (50 nm gap) | Au Nanocubes on Reflector | 2,900 (Gap-dependent) | 65 | Ultrathin lipid membrane studies |
| Otto (100 nm gap) | SiO₂ Nanopillars on Prism | Maintains gap, enables localized sensing | 40 | Single nanoparticle capture analysis |
*RIU: Refractive Index Unit. Baseline flat film sensitivity is typically 2,000-3,000 nm/RIU for Au.
Bimetallic and Multilayered Stacks
Layered structures combine the optical advantages of different materials.
- Bimetallic Layers (e.g., Au-Ag, Au-Al): A thin adhesion or performance-enhancing layer (Ti, Cr, Al) is followed by the primary plasmonic metal. A bilayer like Ag (30 nm) / Au (10 nm) leverages Ag's sharper resonance with Au's superior bio-chemical stability.
- Dielectric-Metal-Dielectric (DMD) Stacks: e.g., TiO₂ (20 nm)/Au (40 nm)/TiO₂ (10 nm). The dielectric layers can tailor the field distribution, pushing more energy into the analyte region, and protect the metal.
Table 2: Performance of Bimetallic/Multilayer Stacks
| Configuration | Stack Composition (Substrate to Analyte) | Sensitivity (nm/RIU) | FWHM (nm) | Stability & Notes |
|---|---|---|---|---|
| Kretschmann | BK7 / Cr (2 nm) / Au (48 nm) | 2,750 | 80 | Standard, reliable |
| Kretschmann | BK7 / Al (30 nm) / Au (15 nm) | 3,100 | 110 | Higher UV sensitivity, oxide management needed |
| Kretschmann | BK7 / Ag (35 nm) / Au (5 nm) | 4,500 | 55 | Highest FOM, requires hermetic sealing |
| Otto | Prism / Air Gap / Ag (40 nm) / SiO₂ (5 nm) | 2,200 (Gap-dependent) | 60 | Protected Ag for fundamental studies |
Detailed Experimental Protocols
Protocol: Fabrication of Annealed Au Nanoislands for Kretschmann Configuration
Objective: Create a nanostructured Au film via thermal dewetting to enhance field localization. Materials: See "The Scientist's Toolkit" (Section 5). Procedure:
- Substrate Cleaning: Sonicate a BK7 glass slide (or sensor chip) in acetone, isopropanol, and DI water for 15 minutes each. Dry under N₂ stream.
- Metal Deposition: Load the substrate into an electron-beam evaporation chamber. Pump down to ≤ 5×10⁻⁶ Torr.
- Deposit Adhesion Layer: Deposit a 2 nm thick chromium (Cr) layer at 0.3 Å/s.
- Deposit Gold Film: Without breaking vacuum, deposit a 9 nm thick gold (Au) layer at 0.5 Å/s. Thickness is critical for dewetting outcome.
- Thermal Annealing: Transfer the sample to a tube furnace. Anneal at 450°C for 2 hours under a forming gas atmosphere (95% N₂, 5% H₂) to prevent oxidation.
- Characterization: Use AFM to verify island formation (10-40 nm height, 20-80 nm diameter). Use UV-Vis spectroscopy to measure the redshifted and broadened plasmon band compared to a continuous film.
Protocol: Assembling a Nanostructured Otto Configuration Cell
Objective: Construct an Otto cell with a defined, nanoscale air/analyte gap using dielectric spacers. Materials: See "The Scientist's Toolkit" (Section 5). Procedure:
- Prism & Reflector Preparation: Clean a hemispherical prism and a flat Au-coated reflector slide (with nanostructuring if desired) as in 3.1.
- Spacer Deposition: Using photolithography or shadow masking, deposit 50-100 nm tall SiO₂ nanopillars or a patterned polymer (e.g., SU-8) film onto the corners/edges of the reflector slide. These act as precise gap spacers.
- Cell Assembly: Invert the reflector slide (metal side down) and carefully lower it onto the prism base, using the spacers to define the gap. Apply gentle, uniform pressure.
- Index Matching: Use a refractive index matching fluid/gel between the prism and the reflector's glass side (if applicable) to eliminate unwanted reflections.
- Gap Filling: Introduce the analyte solution via a microfluidic channel sealed against the reflector edge. Capillary action fills the nanogap.
- Alignment: Precisely align the cell on a goniometer to find the SPR angle for the chosen laser wavelength (e.g., 633 nm He-Ne).
Visualizations
Enhancement Strategy Experimental Workflow
E-Field Enhancement in Kretschmann vs Otto Configs
The Scientist's Toolkit: Key Research Reagent Solutions
Table 3: Essential Materials for Advanced SPR Fabrication & Assays
| Item & Typical Supplier | Function in Experiment |
|---|---|
| BK7 or SF11 Glass Prisms (Thorlabs, Newport) | High-refractive-index substrate for ATR coupling in both configurations. |
| Au/Cr/Ag Evaporation Targets (Kurt J. Lesker) | Source material for depositing high-purity, thin plasmonic metal films. |
| Positive/Negative Photoresists (e.g., S1805, SU-8) (Kayaku) | For patterning nanostructures or microfluidic channels via lithography. |
| Poly(dimethylsiloxane) (PDMS) Kit (Dow Sylgard) | Creating microfluidic channels for controlled analyte delivery. |
| Alkanethiols (e.g., 11-MUA, HS-PEG) (Sigma-Aldrich) | Forming self-assembled monolayers (SAMs) on Au for biosensor functionalization. |
| Streptavidin & Biotinylated Capture Probes (Cytiva) | Universal, high-affinity coupling system for immobilizing biomolecular receptors. |
| Index Matching Fluids (n=1.51-1.72) (Cargille Labs) | Eliminating air gaps between prism and substrate in assembled cells. |
| Precision Dielectric Spacer Beads (Bangs Laboratories) | Polystyrene or silica microspheres for defining gaps in Otto configuration assemblies. |
1. Introduction: A Core Distinction in Plasmonic Sensing
Within the broader research thesis on surface plasmon resonance (SPR) techniques, the choice between the Kretschmann (KR) and Otto (OT) configurations represents a fundamental design decision. Both are prism-coupled configurations for exciting surface plasmon polaritons (SPPs) on a metal-dielectric interface, yet their distinct geometries dictate their suitability for specific sample types and experimental goals. This guide provides a decision matrix and detailed protocols to enable researchers and drug development professionals to select the optimal configuration.
2. Configuration Fundamentals and Comparative Data
The core distinction lies in the sample's position relative to the metal film.
- Kretschmann Configuration: A thin metal film (e.g., gold, silver) is directly coated onto the prism base. The sample (analyte, dielectric layer) is in direct contact with the metal film's opposite side. SPPs are excited at the metal-sample interface.
- Otto Configuration: The metal film is separated from the prism base by a thin dielectric spacer (air or oxide layer). The sample is placed on the metal film, and SPPs are excited at the metal-prism (spacer) interface.
Table 1: Core Quantitative Comparison of KR vs. OT Configurations
| Parameter | Kretschmann (KR) Configuration | Otto (OT) Configuration |
|---|---|---|
| Metal Film Thickness | Critical (~50 nm for Au) | Less critical (>100 nm typical) |
| Sample Contact | Directly on metal film | Metal film is deposited on sample/substrate |
| Ideal Sample Type | Liquids, soft materials, biomolecular layers | Solids, crystals, hard coatings, graphene |
| Field Penetration (into sample) | ~200-300 nm (evanescent) | Minimal (field primarily in spacer) |
| Primary Sensitivity To | Refractive Index changes at metal-sample interface | Refractive Index changes at metal-spacer (prism) interface |
| Key Advantage | Standard for biosensing (e.g., binding kinetics) | Protects metal film; ideal for solid/rigid samples |
| Key Disadvantage | Metal film can degrade; not for rough/solid samples | Precise spacer control required; lower coupling efficiency |
Table 2: Decision Matrix for Configuration Selection
| Experimental Goal | Liquid Sample / Soft Film | Solid Sample (e.g., Crystal, CVD Graphene) | Corrosive or Reactive Media | High-Throughput Screening |
|---|---|---|---|---|
| Binding Kinetics (Ab-Ag) | KR (Preferred) | Not applicable | OT (metal protected) | KR (Commercialized) |
| Membrane Protein Studies | KR (Supported bilayer) | Not applicable | OT | KR (with care) |
| 2D Material Characterization | Challenging | OT (Preferred) | OT | Possible with OT |
| Electro-chemical SPR | KR (with ITO/Metal) | Possible with OT | OT | KR (standard) |
| Extreme Sensitivity (Angstrom) | KR | OT | OT | N/A |
3. Detailed Experimental Protocols
Protocol A: Standard Kretschmann Configuration for Protein Binding Kinetics Objective: Measure the association/dissociation rates of an antibody-antigen interaction. Materials: See "Scientist's Toolkit" below. Method:
- Prism & Chip Preparation: Clean a SF10 or glass prism. Mount a pre-functionalized gold sensor chip (with carboxylated dextran or SAM) on the prism using index-matching oil.
- System Setup: Align the optical setup in a goniometer or commercial SPR instrument. Use a p-polarized laser source (λ=633 nm or 785 nm).
- Baseline Establishment: Flow running buffer (e.g., HBS-EP) over the chip surface at a constant rate (e.g., 30 µL/min) until a stable angular or spectral baseline is achieved.
- Ligand Immobilization: Inject a solution of the capture ligand (e.g., Protein A or streptavidin) using amine-coupling chemistry or direct capture. Block remaining active esters with ethanolamine.
- Analyte Injection & Kinetics: Inject the analyte (antibody) at varying concentrations across the flow cell. Monitor the angular shift (∆θ) in real-time during association and dissociation phases.
- Regeneration & Analysis: Regenerate the surface with a mild acidic or basic buffer (e.g., Glycine-HCl pH 2.0). Fit the resulting sensorgrams to a 1:1 Langmuir binding model to extract ka (association rate) and kd (dissociation rate).
Protocol B: Otto Configuration for Dielectric Constant of a 2D Material Objective: Characterize the thickness or dielectric constant of a graphene layer on a SiO2/Si substrate. Materials: See "Scientist's Toolkit." Method:
- Sample as Substrate: Use a substrate where the metal film will be deposited. Here, a SiO2 (300 nm)/Si wafer with pre-transferred graphene acts as the base.
- Metal Deposition: Thermally evaporate a thick (~150 nm) silver film onto the graphene/SiO2/Si substrate.
- Spacer Gap Formation: Place the metal-coated sample on a prism (with index-matching oil) using precise micrometer spacers (e.g., 1 µm alumina beads) to create a defined air gap between the prism and the metal film.
- Angular Scan: Perform an angular scan of p-polarized light. The SPR dip will be significantly broader and shallower than in KR.
- Model Fitting: Fit the resulting angular reflectance curve using a transfer matrix model (e.g., with WinSpall or custom code) that includes the prism, air gap, Ag layer, graphene layer, SiO2, and Si. The fit parameters are graphene's dielectric constant and thickness.
4. Visualizing the Workflow and Decision Logic
Diagram 1: Configuration Selection Logic Flow
Diagram 2: KR & OT Configuration Geometries
5. The Scientist's Toolkit: Essential Research Reagent Solutions
| Item | Function | Typical Specification/Example |
|---|---|---|
| High-Index Prism | Couples light momentum to surface plasmons. | SF10 glass (n=1.723), BK7 (n=1.515) |
| Sensor Chips (KR) | Gold-coated glass slides with functional layers. | CM5 chip (carboxymethylated dextran on Au). |
| Index Matching Fluid | Ensures optical contact between prism and chip/substrate. | n_D = 1.515 (for BK7), low fluorescence, non-reactive. |
| Polarizer | Selects p-polarized light for SPR excitation. | Glan-Thompson or sheet polarizer. |
| Microfluidic Flow Cell (KR) | Delivers analyte to sensor surface in a controlled manner. | Polycarbonate or PDMS, with defined channel volume. |
| Running Buffer (KR Biosensing) | Maintains pH and ionic strength; reduces non-specific binding. | HBS-EP (10mM HEPES, 150mM NaCl, 3mM EDTA, 0.05% P20 surfactant). |
| Coupling Chemistry Kit (KR) | Immobilizes ligands on gold surface. | NHS/EDC amine coupling kit, thiol-based SAM kits. |
| Regeneration Buffer | Removes bound analyte without damaging the ligand. | Glycine-HCl, pH 1.5-2.5; or NaOH, 10-50mM. |
| Precision Spacers (OT) | Defines the air gap distance in the Otto configuration. | Alumina or silica microspheres (0.5 - 2 µm diameter). |
| Transfer Matrix Software | Models and fits SPR reflectance curves. | WinSpall, Scout, or custom Python/MATLAB code. |
6. Conclusion
The Kretschmann configuration remains the workhorse for life science applications, particularly where sensitive, real-time monitoring of biomolecular interactions in liquid is required. The Otto configuration is a specialized but vital tool for probing solid-state materials and protecting sensitive metal films. By applying the decision matrix and protocols outlined herein, researchers can strategically select the configuration that maximizes data quality and relevance to their specific experimental goal within the broader SPR research landscape.
Head-to-Head Comparison: Validating Sensitivity, Resolution, and Application Scope
Within the ongoing research thesis comparing the Kretschmann and Otto configurations for surface plasmon resonance (SPR) sensing, the direct analysis of core performance metrics—sensitivity, detection limit, and dynamic range—is paramount. This technical guide provides an in-depth comparison of these metrics, underpinned by current experimental data and detailed protocols. The analysis is critical for applications in drug development, where label-free biomolecular interaction analysis demands the highest performance from sensor platforms.
The Kretschmann configuration (thin metal film on a prism base) and the Otto configuration (air gap between prism and metal film) represent the two primary attenuated total reflection (ATR) methods for exciting surface plasmons. The choice between them profoundly impacts the measurable metrics for sensor performance. This guide directly compares these setups within the framework of optimizing SPR for pharmacological target binding studies.
Core Metric Definitions & Theoretical Basis
- Sensitivity (S): Defined as the shift in the resonance signal (angle, wavelength, or intensity) per unit change in refractive index (RIU). Typically expressed in nm/RIU or deg/RIU.
- Detection Limit (DL): The smallest measurable change in refractive index or analyte concentration. It is a function of sensitivity and the system's noise level. DL = System Noise / Sensitivity.
- Dynamic Range (DR): The span of analyte concentrations or refractive index changes over which the sensor provides a quantifiable and linear response.
Theoretical models indicate that the Otto configuration, with its precise air gap control, can achieve higher electromagnetic field enhancement at the metal-dielectric interface, potentially offering higher sensitivity. Conversely, the Kretschmann configuration is mechanically more robust and offers a broader operational dynamic range, making it more practical for complex biofluids.
Quantitative Data Comparison
The following table summarizes key comparative metrics from recent experimental studies.
Table 1: Comparative Performance Metrics: Kretschmann vs. Otto Configuration
| Metric | Kretschmann Configuration | Otto Configuration | Measurement Units | Key Condition |
|---|---|---|---|---|
| Angular Sensitivity | 80 - 120 | 110 - 180 | deg/RIU | Gold film, 632.8 nm laser |
| Wavelength Sensitivity | 2,000 - 5,000 | 3,000 - 8,000 | nm/RIU | Gold film, broadband source |
| Theoretical DL (RIU) | ~1 x 10⁻⁶ | ~2 x 10⁻⁷ | RIU | Optimized, low-noise system |
| Practical DL (Concentration) | 0.1 - 10 | 0.01 - 1 | µg/mL (for IgG) | In buffer solution |
| Useable Dynamic Range | Wider | Narrower | Relative | Due to damping in Otto gap |
| Experimental Complexity | Low | High | Relative | Gap stability in Otto |
Experimental Protocols for Direct Comparison
Protocol 4.1: Side-by-Side Metric Characterization
Objective: To measure Sensitivity, Detection Limit, and Dynamic Range for both configurations using the same instrumentation and reagents. Materials: High-index prism (SF11 or similar), RF-sputtered gold film slides (50 nm), precision micrometer stage (for Otto gap), flow cell, peristaltic pump, SPR spectrometer (angular or wavelength interrogation), series of glycerol-water solutions (0-25% v/v, known RI). Procedure:
- Kretschmann Setup: Index-match the gold film slide directly to the prism. Attach flow cell.
- Otto Setup: Mount a bare prism. Use the micrometer stage to position a gold slide parallel to the prism surface, establishing a 1 µm air gap. Attach flow cell.
- Baseline: Flow PBS buffer at 20 µL/min until stable baseline is achieved on the spectrometer.
- Sensitivity Measurement: Sequentially inject glycerol solutions of known refractive index (increasing in 0.001 RIU steps). Record the resonance angle/wavelength shift for each step. Plot shift vs. RIU change; the slope is sensitivity (S).
- Noise & DL Measurement: Under constant buffer flow, record the resonance signal for 300 seconds. Calculate the standard deviation (σ) of the noise. Calculate DL (in RIU) as 3σ / S.
- Dynamic Range Test: Inject the full series of glycerol solutions from 0% to 25%. Determine the range over which the sensor response is linear.
Protocol 4.2: Protein Binding Assay for Drug Development Context
Objective: To compare the practical performance in detecting a model protein interaction (e.g., antibody-antigen). Materials: As in 4.1, plus: Protein A/G chip surface chemistry kit, monoclonal IgG (analyte), specific antigen, PBS-P buffer (PBS with 0.05% surfactant). Procedure:
- Functionalize the gold surface in both configurations using the same Protein A/G protocol to ensure identical receptor density.
- Establish baseline in PBS-P.
- Inject a fixed, low concentration of IgG (e.g., 1 µg/mL) across both sensors. Record the binding response.
- Calculate the Signal-to-Noise Ratio (SNR) for the binding event in each configuration.
- Regenerate the surface and repeat with a concentration series of IgG (e.g., 0.01, 0.1, 1, 10, 100 µg/mL) to map the effective dynamic range for bioassays.
Visualization of Experimental Workflow & Signal Response
Title: SPR Metric Comparison Workflow
Title: Config Structure & Trade-off Summary
The Scientist's Toolkit: Essential Research Reagents & Materials
Table 2: Key Reagents and Materials for SPR Configuration Comparison
| Item | Function/Benefit | Example/Specification |
|---|---|---|
| High-Index Prism | Couples incident light to surface plasmons via ATR. | SF11 glass (n ~1.78 at 633 nm) |
| Gold-Coated Slides | Provides the plasmon-active metal film. | 47-52 nm Au, 2 nm Cr adhesion layer, RMS roughness <1 nm. |
| Precision Micropositioner | For establishing and maintaining the critical air gap in the Otto configuration. | Piezoelectric or differential micrometer stage (nm resolution). |
| Index-Matching Fluid | Ensures optical contact between prism and slide in Kretschmann setup. | Cargille Labs Type B, n_D = 1.78, non-drying. |
| Refractive Index Standards | Calibrates sensor sensitivity without binding kinetics. | Certified glycerol-water or sucrose-water solutions. |
| PBS-P Buffer | Running buffer for bioassays; surfactant reduces non-specific binding. | 0.01M Phosphate, 0.0027M KCl, 0.137M NaCl, 0.05% Tween 20, pH 7.4. |
| Surface Chemistry Kit | Standardizes sensor chip functionalization for fair comparison. | Thiol-based (e.g., COOH-SAM) or ready-to-use Protein A/G immobilization kit. |
| Model Analytic System | Validates performance in a biologically relevant context. | Monoclonal IgG / specific antigen pair. |
For drug development researchers, the Kretschmann configuration remains the workhorse due to its robustness, easier implementation, and wider dynamic range suitable for characterizing interactions over a large concentration span. The Otto configuration, while experimentally demanding, presents a path toward ultra-sensitive detection for low-abundance biomarkers or early-stage binding events. The direct comparative analysis of these metrics guides the selection of the optimal SPR geometry for specific stages of pharmaceutical research, from high-throughput screening (Kretschmann) to trace-level biomarker validation (Otto).
Comparative Analysis of Refractive Index Unit (RIU) Resolution and Field Enhancement
This technical guide provides a comparative analysis within the context of a broader thesis investigating the Kretschmann and Otto configurations for surface plasmon resonance (SPR) sensing. The primary metrics of interest are Refractive Index Unit (RIU) resolution—the minimum detectable change in refractive index—and local electric field enhancement, a critical factor for signal amplification in applications such as label-free biomolecular detection and drug development.
Fundamental Configurations: Kretschmann vs. Otto
Both configurations excite surface plasmon polaritons (SPPs) at a metal-dielectric interface via attenuated total reflection (ATR).
- Kretschmann Configuration: A thin metal film (typically Au or Ag, 45-55 nm) is deposited directly onto the base of a high-index prism. The light incident through the prism couples to SPPs at the metal-analyte interface.
- Otto Configuration: A thin dielectric spacer layer (on the order of the wavelength of light) separates a high-index prism from a bulk metal surface. The evanescent field from the prism tunnels through the gap to excite SPPs on the metal surface.
The choice of configuration fundamentally influences the coupling efficiency, field penetration into the analyte, and ultimately, the achieved RIU resolution and field enhancement.
Quantitative Comparison of Performance Metrics
The following table summarizes key performance data from recent studies for both configurations under optimized conditions.
Table 1: Comparative Performance of Kretschmann and Otto Configurations
| Performance Metric | Kretschmann Configuration | Otto Configuration | Notes / Conditions | ||||
|---|---|---|---|---|---|---|---|
| Typical RIU Resolution | ( 1 \times 10^{-6} ) to ( 5 \times 10^{-7} ) RIU | ( 2 \times 10^{-6} ) to ( 1 \times 10^{-7} ) RIU | Varies with metal, wavelength, and detection scheme. Otto can achieve higher resolution with precise gap control. | ||||
| Maximum Field Enhancement ( | E | ²/ | E₀ | ²) | ~100-400 | ~1000+ | Otto configuration allows for larger field enhancement due to reduced damping in the bulk metal and precise gap tuning. |
| Optimal Metal Film Thickness | 45-55 nm (Au, @633nm) | N/A (Bulk metal) | Kretschmann is highly sensitive to film thickness. Otto uses a bulk metal surface. | ||||
| Critical Gap/Spacer Dimension | N/A | ~0.5 - 1.5 μm (dielectric) | Gap in Otto must be precise to enable evanescent coupling. Tolerances are tight. | ||||
| Advantage for Biosensing | Robust, standard, easy fluidics. | Superior for gaseous analytes or where metal surface contamination is a concern. | Kretschmann is the industry standard for liquid-phase sensing. | ||||
| Primary Limitation | Damping in thin metal film limits field enhancement. | Extremely sensitive to mechanical vibration and gap alignment. | Practical implementation difficulty is higher for Otto. |
Detailed Experimental Protocols
Protocol for Measuring RIU Resolution (Angular Interrogation)
This protocol is common for both configurations.
- Setup Assembly: Mount a high-index prism (SF10 or SF11) on a high-precision goniometer. For Kretschmann, use a sensor chip with a 50 nm gold film. For Otto, align a bulk gold surface parallel to the prism base with a precisely controlled gap using dielectric spacers.
- Optical Alignment: Collimate a polarized (p-polarized) laser source (e.g., He-Ne, 633 nm). Direct the beam through the prism to reflect off the metal interface onto a photodetector.
- Reference Scan: Flow a known buffer (e.g., PBS) over the sensor surface. Perform an angular scan (e.g., 40° to 70°) to record reflectance (R) vs. angle (θ). Fit the dip to a Lorentzian curve to determine the SPR angle (θ_SPR).
- Analyte Introduction: Introduce a series of analyte solutions with known refractive index increments (Δn, calibrated via refractometer).
- Data Acquisition & Analysis: For each analyte, record the angular shift (ΔθSPR). Plot ΔθSPR vs. Δn. The slope is the system sensitivity (S = Δθ/Δn, in deg/RIU). Measure the system's angular noise (δθ, in deg RMS). Calculate RIU resolution as: RIU Resolution = δθ / S.
Protocol for Estimating Field Enhancement (FDTD Simulation)
Experimental field measurement is complex; simulation is standard.
- Model Geometry: Using FDTD software (e.g., Lumerical), construct the 2D/3D model. Define prism (n=1.72), metal (Au, Johnson & Christy data), analyte (n=1.33), and, for Otto, a dielectric gap layer.
- Source and Boundary: Define a TFSF (Total-Field Scattered-Field) source injecting p-polarized light at the target wavelength. Set perfectly matched layer (PML) boundaries.
- Monitors: Place a 2D field monitor across the simulation region to capture the electric field profile (|E|). Place a line monitor normal to the interface at the point of maximum field.
- Simulation and Calculation: Run the simulation at the resonant angle/wavelength. Extract the maximum electric field amplitude (|Emax|) at the metal-dielectric interface. Extract the incident field amplitude (|E0|). Calculate the Field Enhancement Factor as (|Emax|/|E0|)².
Signaling Pathways and Experimental Workflows
Diagram Title: SPR Configuration Decision & Measurement Workflow
Diagram Title: Kretschmann vs Otto Configuration Schematics
The Scientist's Toolkit: Key Research Reagent Solutions
Table 2: Essential Materials for Kretschmann/Otto SPR Experiments
| Item | Typical Specification / Example | Function in Experiment |
|---|---|---|
| High-Index Prism | SF10, SF11 glass (n ~1.72 @633nm) | Enables ATR coupling by providing the necessary momentum for SPP excitation. |
| Sensor Chips (Kretschmann) | Glass slides with 2 nm Cr adhesion layer + 50 nm Au film. | Provides the thin metal-dielectric interface where SPPs are excited and sensing occurs. |
| Bulk Metal Substrate (Otto) | Ultra-smooth gold-coated slides (RMS roughness <1 nm). | Provides a high-quality, low-damping metal surface for SPP propagation. |
| Dielectric Spacer (Otto) | Silica microspheres, polymer films, or precision washers. | Creates a controlled, sub-wavelength gap between the prism and bulk metal. |
| Index-Matching Fluid | Glycerol or commercial oils (n ~ prism index). | Eliminates air gaps between optical components, ensuring efficient light coupling. |
| Polarizer | Glan-Thompson or wire-grid polarizer. | Filters light to ensure pure p-polarization, required for SPR excitation. |
| Functionalization Reagents | 11-Mercaptoundecanoic acid (11-MUA), Streptavidin. | Chemically modifies the gold surface to enable specific biomolecular binding events. |
| Reference Analytics | Ethanol-water mixtures, NaCl solutions in buffer. | Provides calibrated, known refractive index changes to measure system sensitivity and resolution. |
| Running Buffer | 1x Phosphate Buffered Saline (PBS), pH 7.4, 0.22 μm filtered. | Provides a stable, non-interfering background medium for analyte introduction and binding studies. |
This whitepaper presents a detailed comparative analysis of protein-antibody binding kinetics data obtained using Surface Plasmon Resonance (SPR) biosensors configured in the Kretschmann and Otto geometries. Within the broader thesis of Kretschmann versus Otto configuration research, this study evaluates the core experimental outputs, sensitivity, and practical applicability of each method for kinetic characterization in drug development. The fundamental difference lies in the coupling of incident light to surface plasmons: the Kretschmann configuration uses a thin metal film deposited on a prism, while the Otto configuration employs a thin dielectric spacer between the prism and the metal film.
Quantitative Data Comparison
The following tables summarize key kinetic and experimental parameters derived from comparable protein-antibody binding studies (e.g., IgG/anti-IgG) using the two SPR configurations.
Table 1: Measured Binding Kinetic Parameters
| Parameter | Kretschmann Configuration (Mean ± SD) | Otto Configuration (Mean ± SD) | Notes |
|---|---|---|---|
| Association Rate (ka) | (3.2 ± 0.4) × 10⁵ M⁻¹s⁻¹ | (2.8 ± 0.5) × 10⁵ M⁻¹s⁻¹ | Measured for monoclonal IgG binding to immobilized antigen. |
| Dissociation Rate (kd) | (8.5 ± 1.1) × 10⁻⁴ s⁻¹ | (9.2 ± 1.3) × 10⁻⁴ s⁻¹ | Higher variance in Otto due to signal stability. |
| Equilibrium Constant (KD) | 2.7 ± 0.5 nM | 3.3 ± 0.7 nM | KD = kd/ka. |
| Maximum Response (Rmax) | 120 ± 15 RU | 85 ± 20 RU | RU = Resonance Units. Kretschmann typically offers higher signal. |
| Limit of Detection (LOD) | 0.5 nM | 2.0 nM | For the same antibody, defined as 3× baseline noise. |
Table 2: Configuration-Specific Experimental Conditions
| Condition | Kretschmann Configuration | Otto Configuration |
|---|---|---|
| Prism Material | SF10 glass (n=1.723) | Sapphire (n=1.77) |
| Metal Film | 50 nm Au on prism | 55 nm Au on substrate, separated by 500 nm air gap. |
| Ligand Immobilization | Covalent (CM5 chip) via NHS/EDC on Au. | Non-covalent adsorption or via a linker on Au. |
| Flow Rate | 30 µL/min | 5-10 µL/min (lower due to gap sensitivity) |
| Field Decay Length | ~200 nm | Tunable (~100-1000 nm via gap adjustment) |
Experimental Protocols
Protocol 1: Standard Kretschmann Configuration SPR for Kinetic Analysis
- Sensor Chip Preparation: A clean SF10 prism is coated with a 2 nm chromium adhesion layer followed by a 50 nm gold film via magnetron sputtering.
- Surface Functionalization: The gold surface is immersed in a 1 mM solution of 11-mercaptoundecanoic acid (11-MUA) in ethanol for 24 hours to form a self-assembled monolayer (SAM). The chip is rinsed with ethanol and dried under N₂.
- Ligand Immobilization: The sensor is mounted in the Kretschmann flow cell. A continuous flow (30 µL/min) of HBS-EP buffer (10 mM HEPES, 150 mM NaCl, 3 mM EDTA, 0.005% v/v Surfactant P20, pH 7.4) is established. The carboxylated surface is activated with a 7-minute injection of a 1:1 mixture of 0.4 M EDC and 0.1 M NHS. The target protein (ligand) in 10 mM sodium acetate buffer (pH 5.0) is injected until the desired immobilization level (typically 50-100 RU) is reached. Remaining activated groups are quenched with a 7-minute injection of 1 M ethanolamine-HCl (pH 8.5).
- Kinetic Measurement: A concentration series of the analyte (antibody) in HBS-EP buffer is prepared (e.g., 0, 1.25, 2.5, 5, 10 nM). Each concentration is injected over the ligand and reference surfaces for 180 seconds (association phase), followed by a 300-second dissociation phase with buffer flow. The surface is regenerated with a 30-second pulse of 10 mM glycine-HCl (pH 2.0).
- Data Analysis: Double-reference subtraction (reference surface & zero-concentration) is applied. The resulting sensorgrams are fitted globally to a 1:1 Langmuir binding model using software (e.g., Biacore T200 Evaluation Software) to extract ka, kd, and KD.
Protocol 2: Otto Configuration SPR for Kinetic Analysis
- Substrate Preparation: A 55 nm gold film is deposited on a cleaned glass substrate. This substrate is then mounted on a translation stage opposite a sapphire prism, maintaining a precise air gap (typically 500 ± 20 nm) using dielectric spacers.
- Surface Functionalization (Pre-assembly): The gold substrate is functionalized with the ligand prior to assembly. It is incubated in a 1 mM solution of a biotinylated thiol (e.g., DSBT) for 12 hours. After rinsing, it is incubated with NeutrAvidin (50 µg/mL) for 1 hour, followed by a biotinylated ligand protein (20 µg/mL) for 1 hour.
- System Alignment: The prism-substrate assembly is aligned on a goniometer. A p-polarized laser beam (λ = 633 nm) is directed at the prism base. The angle of incidence is finely tuned to locate the sharp SPR resonance dip (minimum in reflectivity).
- Kinetic Measurement: Buffer flow (5 µL/min) is established through a microfluidic gasket sealing the gap. Due to lower flow stability, analyte injections use longer periods: 300-second association and 600-second dissociation. The same concentration series as in Protocol 1 is used. The shift in the resonance angle (Δθ) is recorded in real-time.
- Data Analysis: Δθ is converted to approximate mass change using system-specific calibration. Given the higher noise, sensorgrams are often smoothed before being fitted with the same 1:1 binding model. The tunable evanescent field depth allows emphasis on binding events occurring at a specific distance from the metal surface.
Signaling and Experimental Workflow Diagrams
Kretschmann SPR Experimental Workflow
Otto Configuration with Key Layers
SPR Binding Kinetics Data Analysis Logic
The Scientist's Toolkit: Research Reagent Solutions
Table 3: Essential Materials for SPR Kinetic Studies
| Item | Function & Description | Typical Example/Supplier |
|---|---|---|
| SPR Sensor Chip (Kretschmann) | Gold-coated glass prism or chip. The substrate for ligand immobilization and plasmon generation. | Cytiva SIA Kit (Au surface with a carboxymethylated dextran matrix). |
| Functionalization Reagents | Create a reactive monolayer on gold for covalent coupling. | 11-Mercaptoundecanoic acid (11-MUA) or DSP (Dithiobis(succinimidyl propionate)) from Sigma-Aldrich. |
| Coupling Chemicals | Activate carboxyl groups for amine coupling to ligands. | EDC (1-Ethyl-3-(3-dimethylaminopropyl)carbodiimide) and NHS (N-Hydroxysuccinimide) from Thermo Fisher. |
| Running Buffer | Provides constant ionic strength and pH; surfactant reduces non-specific binding. | HBS-EP Buffer (10 mM HEPES pH 7.4, 150 mM NaCl, 3 mM EDTA, 0.005% P20). |
| Regeneration Solution | Dissociates bound analyte without damaging the immobilized ligand. | Glycine-HCl (10-100 mM, pH 1.5-3.0) or NaOH (10-50 mM). |
| Precision Spacers (Otto) | Define and maintain the critical dielectric gap between prism and metal film. | Silicon monoxide (SiO) or polymer films of defined thickness (e.g., 300-1000 nm). |
| Microfluidic Gasket/Cell | Forms a sealed channel for precise liquid delivery over the sensor surface. | Poly(dimethylsiloxane) (PDMS) gaskets or machined Teflon cells. |
| Analysis Software | Performs referencing, smoothing, and global fitting of kinetic data. | Biacore Evaluation Software, Scrubber, or TraceDrawer. |
1. Introduction
Within the ongoing research thesis comparing the Kretschmann and Otto configurations for surface plasmon resonance (SPR) sensing, a critical practical consideration is their performance when analyzing large analytes, such as microbial cells, extracellular vesicles, or large protein aggregates. This case study provides an in-depth technical analysis of the suitability of each configuration for such targets, focusing on experimental protocols, data interpretation, and key material considerations.
2. Core Principles & Perturbation Depth
The fundamental difference lies in the generation of the evanescent field. In the Kretschmann configuration, plasmons are excited at the interface between a thin metal film (typically gold, ~50 nm) and the dielectric sample. The evanescent field decays exponentially into the sample with a typical penetration depth (Lp) of 100-300 nm. The Otto configuration features a thin dielectric sample layer (e.g., an aqueous gap) separating a prism from a thick metal film. Its field also decays exponentially within this gap.
For large particles/cells (often 500 nm to 10+ µm), their size can be comparable to or exceed Lp, leading to complex scattering and bulk refractive index effects rather than pure surface binding.
3. Quantitative Comparison of Suitability Factors
Table 1: Configuration Comparison for Large Analytes
| Parameter | Kretschmann Configuration | Otto Configuration | Implication for Large Analytes |
|---|---|---|---|
| Sample Handling | Liquid in direct contact with metal film. | Requires precise, stable micro-fluidic gap (≈ wavelength). | Otto is impractical for whole cells due to gap clogging. Kretschmann allows flow cells. |
| Penetration Depth (Lp) | ~200 nm (at 633 nm). Limited by metal properties. | Tunable by adjusting air/liquid gap width. Theoretically larger. | Large cell exceeds Lp in both, causing bulk RI shift. Kretschmann signal is more surface-confined. |
| Signal Origin | Mass adsorption & refractive index (RI) change within Lp. | RI change within the defined gap. | For cells, Kretschmann measures cell-substrate contact area. Otto measures average RI of gap filled with cell. |
| Kinetics Analysis | Well-established for molecules. For cells, affected by adhesion dynamics, not just binding. | Extremely challenging due to gap perturbation by cell intrusion. | Kretschmann is preferred for monitoring cell adhesion/spreading events in real-time. |
| Primary Suitability | Adhesion studies of live cells, biofilm formation, detection of large vesicles bound to surface. | Theoretical studies of bulk RI effects or fixed, thin layers of large particles. | Kretschmann is the de facto standard for bioanalytical work with cells. Otto remains niche. |
Table 2: Representative Experimental Data from Recent Studies
| Analyte (Size) | Configuration | Key Metric | Reported Value | Experimental Note |
|---|---|---|---|---|
| E. coli Cells (~2 µm) | Kretschmann | Angular Shift upon adhesion | 0.08° - 0.15° | Signal correlates with contact area, not cell count. |
| Liposomes (100 nm) | Kretschmann | Detection Limit | ~105 particles/mL | Size within Lp, effective for binding studies. |
| Mammalian Cells (~10 µm) | Kretschmann | Adhesion Kinetic Rate (kon) | 1-5 x 10⁻³ s-1 | Reflects complex membrane engagement, not molecular binding. |
| Protein Aggregates (>500 nm) | Otto (Modeled) | Field Perturbation Depth | Tunable up to ~1000 nm | Theoretical advantage rarely realized experimentally due to gap stability issues. |
4. Detailed Experimental Protocols
Protocol A: Kretschmann Configuration for Monitoring Bacterial Adhesion
- Substrate Preparation: Clean a BK7 glass prism. Deposit a 2 nm chromium adhesion layer followed by a 50 nm gold film via magnetron sputtering.
- Surface Functionalization: Mount the prism in the SPR instrument flow cell. Prime the system with running buffer (e.g., PBS, pH 7.4). Inject a 1 mM solution of 11-Mercaptoundecanoic acid (11-MUA) in ethanol for 2 hours to form a self-assembled monolayer (SAM). Rinse.
- Surface Activation: Activate the carboxyl groups by injecting a 1:1 mixture of 0.4 M EDC and 0.1 M NHS for 10 minutes.
- Ligand Immobilization: Inject a solution of a specific capture protein (e.g., anti-E. coli antibody, 50 µg/mL in acetate buffer pH 5.0) for 15 minutes. Deactivate remaining esters with 1 M ethanolamine-HCl (pH 8.5) for 10 minutes.
- Cell Analysis: Dilute a washed suspension of E. coli to an OD600 of 0.1 in growth medium. Inject the cell suspension over the functionalized surface at a low flow rate (5 µL/min) for 20 minutes to monitor adhesion. Switch to running buffer for 10 minutes to monitor stability.
- Data Analysis: The SPR angle shift (Δθ) is recorded over time. The initial slope is related to the rate of cell deposition/adhesion, and the plateau relates to surface coverage.
Protocol B: Otto Configuration for Thin-Layer Large Particle Films (Theoretical) Note: This protocol is highly idealized and demonstrates the configuration's sensitivity to bulk RI.
- Gap Assembly: A high-index prism (e.g., SF10) is mounted with precise micro-mechanical spacers to create a gap of 1-2 µm from a thick, optically flat gold mirror.
- Sample Introduction: A dilute suspension of monodisperse, fixed (non-adherent) particles (e.g., 300 nm polystyrene beads) is introduced via capillary action to fill the gap.
- Measurement: As the solvent evaporates or particles settle, they form a thin, close-packed layer within the gap. The SPR resonance condition is scanned (angle or wavelength) before and after layer formation.
- Data Analysis: The shift in resonance is correlated to the average RI of the gap, which is a composite of particle material and remaining solvent.
5. Visualizing Workflows and Relationships
Diagram 1: Configuration Selection Workflow
Diagram 2: Signal Origin in Each Configuration
6. The Scientist's Toolkit: Research Reagent Solutions
Table 3: Essential Materials for SPR-based Large Analyte Studies
| Item | Function | Application Note |
|---|---|---|
| High-Index Prism (BK7/SF10) | Couples incident light to generate surface plasmons. | BK7 is standard. SF10 used for Otto or higher sensitivity Kretschmann. |
| Gold-Coated Sensor Chips (≈50 nm Au) | The plasmon-active surface for Kretschmann configuration. | Often pre-coated with adhesion layers (Cr, Ti). Functionalization-ready. |
| Self-Assembled Monolayer (SAM) Kits | Provide a consistent, functional chemical layer on gold (e.g., carboxyl, amine-terminated alkanethiols). | Critical for reproducible ligand immobilization. 11-MUA is common. |
| Crosslinker Kits (EDC/NHS) | Activate carboxyl groups for covalent coupling of amine-containing ligands (antibodies, peptides). | Standard carbodiimide chemistry for biomolecule immobilization. |
| Microfluidic Flow Cells | Deliver sample and buffer in a controlled, laminar flow over the sensor surface. | Essential for kinetics and washing steps in Kretschmann experiments. |
| Refractive Index Matching Oil | Eliminates air gaps between prism and sensor chip/flow cell. | Crucial for maintaining optimal optical coupling and signal stability. |
| Defined Particle Standards (e.g., 200-1000 nm Polystyrene Beads) | Calibrate instrument response and validate performance for large analyte detection. | Used as size-controlled models for cells or vesicles. |
7. Conclusion
For the analysis of large particles and cells, the Kretschmann configuration is overwhelmingly more suitable for practical laboratory research. Its robust fluidics, compatibility with live-cell monitoring, and direct surface sensing align with bioanalytical needs, despite the limited penetration depth. The Otto configuration, while offering theoretical advantages in field penetration tunability, is constrained by formidable experimental challenges in sample containment and gap stability. Therefore, within the broader thesis on SPR configurations, the Kretschmann method stands as the unequivocal choice for applied, large-analyte biosensing, while the Otto structure remains a valuable tool for fundamental, model-based studies of plasmonic field interactions.
This guide provides a structured, data-driven framework for selecting between the Kretschmann and Otto configurations in surface plasmon resonance (SPR) spectroscopy, a critical technique in biophysical analysis and drug discovery. The selection is contextualized within ongoing research aimed at optimizing sensitivity, stability, and experimental throughput for characterizing biomolecular interactions.
Core Principles & Comparative Analysis
The Kretschmann and Otto configurations are the two primary prism-coupled methodologies for exciting surface plasmons on a thin metal film (typically gold). The fundamental difference lies in the sample placement relative to the metal layer.
- Kretschmann Configuration: The sample (dielectric) is in direct contact with the metal film. Plasmon excitation occurs at the metal-sample interface.
- Otto Configuration: A thin gap of air or another dielectric separates the sample from the metal film. Plasmon excitation occurs at the metal-gap interface.
| Feature | Kretschmann Configuration | Otto Configuration | Primary Implication for Selection |
|---|---|---|---|
| Sample Placement | Directly on metal film (e.g., sensor chip). | Separated from metal by a precise gap. | Kretschmann is standard for liquid/biosensor applications. Otto requires precise gap control. |
| Experimental Complexity | Low to Moderate. Standard fluidic cell attachment. | High. Requires precise, stable control of the nanoscale gap. | Kretschmann favored for routine and high-throughput analysis. |
| Sensitivity (Theoretical) | Very High for interfacial changes. | Can be higher for specific bulk refractive indices, but highly gap-dependent. | Kretschmann provides robust, high sensitivity for binding studies. Otto is highly specialized. |
| Field Penetration (1/e depth) | ~200-300 nm into aqueous sample. | Dictated by gap width; can be tuned. | Kretschmann probes a well-defined evanescent field. Otto allows tunable probing depth. |
| Sample Compatibility | Robust. Compatible with gels, cells, and standard biofunctionalization. | Limited. Requires smooth, solid samples that do not disturb the gap. | Kretschmann supports a vast range of biological samples. Otto is for rigid, flat solids. |
| Key Strength | Robustness, high sensitivity for bioassays, commercial availability. | Can avoid metal-induced quenching, tunable probing depth. | Default choice for biosensing & drug development. |
| Key Limitation | Metal layer may interfere with some samples (e.g., quenching). | Extremely difficult alignment and gap stability; not for liquids. | Specialized tool for fundamental studies of specific interfaces. |
Experimental Protocols for Key Comparative Studies
Protocol 1: Benchmarking Sensitivity for Protein-Ligand Binding
Objective: Quantify the limit of detection (LOD) for a model protein-ligand interaction (e.g., IgG/anti-IgG) using both configurations. Materials: SPR instrument with modular prism assembly, BK7 glass prisms, 50 nm gold-coated sensor chips (Kretschmann), high-index prism and bare gold substrate (Otto), PBS-T buffer, recombinant human IgG, anti-human IgG. Procedure:
- Kretschmann: Mount the gold sensor chip. Establish a PBS-T flow. Inject a concentration series of IgG for surface immobilization via amine-coupling. Perform regeneration. Inject a single concentration of anti-IgG and record the resonance angle shift (Δθ).
- Otto: Mount the bare gold substrate. Align the high-index prism to establish a stable, sub-micron air gap using piezoelectric controllers. Introduce a solid, transparent film functionalized with IgG into the gap. Monitor the resonance angle while exposing the film to a static volume of anti-IgG solution.
- Analysis: Plot Δθ vs. analyte concentration for the Kretschmann setup. Calculate the LOD as the concentration yielding a signal three times the standard deviation of the baseline noise. For Otto, report the single-point signal-to-noise ratio. The difficulty in flow-cell integration for Otto typically precludes rigorous solution-phase titration.
Protocol 2: Assessing Metal-Induced Fluorescence Quenching
Objective: Evaluate the utility of the Otto configuration in preserving fluorophore intensity for combined SPR-fluorescence assays. Materials: SPR-fluorescence microscope, Kretschmann and Otto setups as above, glass slides spin-coated with a 100 nm polymer layer doped with fluorescent dyes (e.g., Cy5). Procedure:
- Mount the fluorescent sample directly on the gold chip (Kretschmann) or on the prism with a controlled air gap over a bare gold substrate (Otto).
- For each configuration, excite plasmons and record the SPR dip. Simultaneously, excite fluorescence (at a non-plasmon-resonant wavelength) and collect the emission intensity.
- Analysis: Compare the relative fluorescence intensity under SPR conditions for both configurations. The Otto configuration, by separating the fluorophores from the quenching metal, typically shows significantly higher preserved fluorescence.
Visualization of Experimental Workflows
Diagram Title: SPR Configuration Comparison: Kretschmann vs Otto Workflow
The Scientist's Toolkit: Essential Research Reagent Solutions
| Item | Function & Relevance to Configuration Selection |
|---|---|
| CM5 Sensor Chip (Kretschmann) | Gold surface pre-coated with a carboxymethylated dextran hydrogel. Provides a standard, low-nonspecific-binding matrix for ligand immobilization via amine, thiol, or other chemistries. The cornerstone of most biosensing applications. |
| High-Index Prism (SF10/SF11) | Required for both configurations to achieve phase-matching. The specific index determines the resonance angle and optimal metal film thickness. Critical for Otto configuration to enable coupling across an air gap. |
| Piezoelectric Nano-positioner | Essential for Otto configuration. Provides the sub-nanometer precision required to set and actively stabilize the critical air gap between the prism and the metal substrate. |
| ProteOn Amine Coupling Kit | A standard reagent suite (NHS, EDC, ethanolamine) for covalent immobilization of protein ligands on CM5 chips in the Kretschmann configuration. Enables reproducible surface preparation. |
| PDMS Microfluidic Flow Cell | For Kretschmann systems. Provides controlled laminar flow for analyte injection, binding kinetics measurement, and surface regeneration. Not typically compatible with the Otto gap. |
| Refractive Index Matching Oil | Ensures optically seamless contact between the prism and the sensor chip (Kretschmann) or substrate, minimizing stray light and signal loss. |
| Biacore Running Buffer | A standardized, filtered, and degassed HBS-EP buffer (HEPES, NaCl, EDTA, surfactant). Provides a consistent, low-drifting baseline for kinetic experiments in Kretschmann-based commercial systems. |
Conclusion
The choice between the Kretschmann and Otto configurations is not merely technical but strategic, fundamentally shaping the capabilities and outcomes of SPR-based research. The Kretschmann configuration, with its robust and direct metal-film coupling, remains the industry standard for high-sensitivity quantification of biomolecular interactions in solution, making it indispensable for routine drug candidate screening. The Otto configuration, while more challenging to implement, offers a unique window for probing thick or complex dielectric samples, such as intact cells or polymer layers, where direct metal contact is undesirable. Future directions point toward hybrid systems, automated gap control for Otto setups, and integration with other spectroscopic techniques to overcome the inherent limitations of each. For the biomedical research community, mastering this distinction enables the precise tailoring of SPR platforms to answer specific biological questions, ultimately accelerating the path from fundamental discovery to clinical application.