Langmuir-Hinshelwood vs Eley-Rideal: A Complete Guide to Surface Reaction Mechanisms for Drug Development
This article provides a comprehensive comparison of the Langmuir-Hinshelwood (LH) and Eley-Rideal (ER) mechanisms, two fundamental models in heterogeneous surface kinetics critical for biomedical research.
Langmuir-Hinshelwood vs Eley-Rideal: A Complete Guide to Surface Reaction Mechanisms for Drug Development
Abstract
This article provides a comprehensive comparison of the Langmuir-Hinshelwood (LH) and Eley-Rideal (ER) mechanisms, two fundamental models in heterogeneous surface kinetics critical for biomedical research. It explores their foundational principles, methodological applications in catalysis and drug discovery, common challenges in experimental validation, and comparative analysis for mechanism discrimination. Designed for researchers and drug development professionals, the guide synthesizes current knowledge to inform the rational design of catalytic therapies, targeted drug delivery systems, and biosensor interfaces.
Core Principles of Surface Kinetics: Understanding LH and ER Mechanism Fundamentals
Within the ongoing research discourse comparing the Eley-Rideal (E-R) and Langmuir-Hinshelwood (L-H) mechanisms, a precise understanding of the heterogeneous surface itself is paramount. This whitepaper details the core concepts, experimental approaches, and material considerations that define this critical playing field.
Fundamental Concepts & Quantitative Data
Heterogeneous catalysis involves reactions where the catalyst and reactants exist in different phases, typically with a solid catalyst and gaseous or liquid reactants. The key distinction between the E-R and L-H mechanisms lies in the sequence of adsorption and the site of reaction.
Table 1: Core Mechanistic Comparison: Eley-Rideal vs. Langmuir-Hinshelwood
| Feature | Eley-Rideal Mechanism | Langmuir-Hinshelwood Mechanism |
|---|---|---|
| Core Principle | A gas-phase reactant directly reacts with an adsorbed species. | Two adsorbed species react while both are on the catalyst surface. |
| Reaction Sequence | A(g) + B(ads) → Products | A(ads) + B(ads) → Products |
| Rate Dependence | Proportional to partial pressure of gas-phase reactant and surface coverage of adsorbed species. | Proportional to the product of the surface coverages of both adsorbed species. |
| Typical Rate Law | r = k PA θB | r = k θA θB |
| Optimal Temperature | Often lower, as high temps may reduce coverage of the adsorbed species. | Often exhibits a maximum at intermediate temps (balance of adsorption & reaction). |
| Sensitivity to Adsorption Competition | Lower. | High; competitive adsorption can significantly inhibit reaction. |
Table 2: Common Surface Characterization Techniques & Key Metrics
| Technique | Primary Information | Typical Quantitative Output (Example Range/Units) |
|---|---|---|
| X-ray Photoelectron Spectroscopy (XPS) | Elemental composition, chemical oxidation states. | Atomic % (0-100%), Binding Energy (eV), Peak Area (counts-eV/s). |
| Temperature-Programmed Desorption (TPD) | Adsorption strength, surface coverage, active site density. | Desorption Peak Temperature (K), Desorbed Amount (μmol/g), Coverage (molecules/cm²). |
| Scanning Tunneling Microscopy (STM) | Atomic-scale surface topography, defect visualization. | Step Height (Å), Defect Density (per nm²), Lattice Constant (Å). |
| Brunauer-Emmett-Teller (BET) Analysis | Specific surface area, pore volume. | Surface Area (m²/g), Pore Volume (cm³/g), Pore Diameter (Å). |
| Low-Energy Electron Diffraction (LEED) | Surface crystallography, ordered adsorbate structures. | Lattice Spacing (Å), Superstructure Notation (e.g., (2x2)). |
Key Experimental Protocols
Protocol 1: Ultra-High Vacuum (UHV) Model Catalyst Study for Mechanistic Discrimination
Objective: To isolate and validate E-R or L-H pathways on a single-crystal metal surface. Methodology:
- Surface Preparation: A metal single crystal (e.g., Pt(111)) is cleaned in UHV (<10⁻¹⁰ mbar) via cycles of Ar⁺ sputtering and annealing.
- Adsorbate Preparation: For L-H pathway: Expose surface to controlled doses (Langmuirs) of reactant A (e.g., CO) until desired coverage (θ_A) is achieved, monitored via TPD or electron spectroscopy.
- Reaction Initiation:
- For E-R: Introduce reactant B (e.g., O₂) into the chamber while continuously monitoring surface species (e.g., with Reflection-Absorption Infrared Spectroscopy (RAIRS)) and gas-phase products (with a Quadrupole Mass Spectrometer (QMS)).
- For L-H: Adsorb both A and B sequentially or co-adsorb at low temperature, then perform a Temperature-Programmed Reaction (TPR) experiment, heating the surface linearly while monitoring desorbing products with QMS.
- Data Analysis: An E-R mechanism shows product formation concurrent with gas-phase B exposure, independent of A's adsorption state for B. An L-H mechanism shows product formation primarily during TPR, with rate peaking at a temperature dependent on the co-adsorption bond strengths.
Protocol 2: Supported Nanoparticle Catalyst Evaluation under Pressure
Objective: To measure kinetics and infer mechanism on practical high-surface-area catalysts. Methodology:
- Catalyst Testing: A known mass of supported metal nanoparticles (e.g., 2% Pt/Al₂O₃) is loaded into a plug-flow microreactor.
- Conditioning: Catalyst is reduced in situ under H₂ flow at elevated temperature.
- Kinetic Measurement: Reactant gases (e.g., CO and O₂ in He) are fed at varying partial pressures (PA, PB) and total flow rates. Steady-state reaction rates are measured via online gas chromatography (GC).
- Parameter Variation: Systematic variation of PA and PB at constant temperature allows fitting to rate laws. Strong inhibition by one reactant suggests competitive adsorption (L-H). A linear dependence on one gas pressure with zero-order in another suggests an E-R-type step may be rate-limiting.
Visualizing Concepts and Workflows
Title: L-H vs. E-R Mechanism Step Comparison
Title: Experimental Workflow for Mechanism Study
The Scientist's Toolkit: Key Research Reagent Solutions
Table 3: Essential Materials for Surface Chemistry Experiments
| Item / Reagent | Function / Rationale |
|---|---|
| Single-Crystal Metal Disks (e.g., Pt(111), Cu(110)) | Provides a well-defined, atomically flat surface to study fundamental processes without complications from disorder or support effects. |
| High-Purity Gases (CO, O₂, H₂, Ar) with Purifiers | Ensures reactant streams are free of contaminants (e.g., metal carbonyls, moisture) that can poison model or real catalyst surfaces. |
| Calibrated Leak Valves & Mass Flow Controllers | Enables precise, reproducible dosing of gases in UHV (Langmuirs) and at elevated pressures (sccm), critical for kinetic measurements. |
| Standard Reference Materials (e.g., NIST-traceable Au foil for XPS) | Allows accurate calibration of analytical instruments, ensuring binding energy and quantitative composition data are reliable. |
| Supported Catalyst Precursors (e.g., Pt(NH₃)₄(NO₃)₂ on γ-Al₂O₃) | A reproducible source for synthesizing supported nanoparticles with controlled metal loading and dispersion. |
| UHV-Compatible Electron Bombardment Heaters | Enables precise annealing of single crystals to specific temperatures for cleaning and surface reconstruction. |
| Sputtering Ion Guns (Ar⁺ or Kr⁺) | Used to remove surface contaminants and layers of atoms via physical sputtering to achieve an atomically clean starting surface. |
| High-Sensitivity Quadrupole Mass Spectrometer (QMS) | The primary tool for monitoring gas-phase composition during TPD, TPR, and reaction studies in both UHV and high-pressure cells. |
Within the foundational study of heterogeneous catalysis, two classical surface reaction mechanisms predominate: the Eley-Rideal (ER) and the Langmuir-Hinshelwood (LH) mechanisms. This whitepaper provides a technical deep dive into the latter, framed within the critical research discourse contrasting these two pathways. The core distinction lies in the state of the reactants: the ER mechanism involves a direct reaction between a gas-phase molecule and an adsorbed species, while the LH mechanism mandates that all reacting species are co-adsorbed on the catalyst surface prior to reaction. The LH pathway is far more common in catalytic processes, governing reactions from CO oxidation in automotive catalytic converters to complex hydrogenations in pharmaceutical synthesis.
Fundamental Principles of the LH Mechanism
The Langmuir-Hinshelwood mechanism operates on several key assumptions derived from Langmuirian adsorption kinetics:
- Adsorption/Desorption Equilibrium: Each reactant competitively and reversibly adsorbs onto distinct or identical active sites on the catalyst surface.
- Surface Reaction as RDS: The rate-determining step (RDS) is the bimolecular reaction between adjacent, chemisorbed species.
- Uniform Surface: The catalyst surface is assumed to be uniform, with equivalent adsorption sites.
The generalized sequence for a bimolecular reaction ( A + B \rightarrow Products ) is:
- ( A{(g)} + * \rightleftharpoons A{*} )
- ( B{(g)} + * \rightleftharpoons B{*} )
- ( A{*} + B{} \rightarrow Products_{} + 2* ) (RDS)
- ( Products{*} \rightleftharpoons Products{(g)} + * )
Where ( * ) denotes a vacant active site.
Quantitative Kinetics and Data
The rate of reaction is derived from the kinetics of the RDS. Assuming Langmuir adsorption isotherms for A and B, and that surface coverage ( \theta ) is proportional to partial pressure ( P ), the rate equation becomes:
[ r = k \thetaA \thetaB = \frac{k KA KB PA PB}{(1 + KA PA + KB PB)^2} ]
Where ( k ) is the surface reaction rate constant, and ( KA ), ( KB ) are the adsorption equilibrium constants. This model predicts a rate maximum at intermediate coverages, as high coverage of one reactant can "poison" the surface by blocking adsorption of the other.
Table 1: Characteristic Signatures of LH vs. Eley-Rideal Mechanisms
| Feature | Langmuir-Hinshelwood | Eley-Rideal |
|---|---|---|
| Reactant State | All reactants adsorbed | One adsorbed, one from gas phase |
| Rate Dependence | Often shows a rate maximum with reactant pressure | Monotonic increase with gas-phase reactant pressure |
| Inhibition | Strong reactant inhibition (competitive adsorption) common | Weak or no inhibition by gas-phase reactant |
| Surface Diffusion | Critical (reactants must find each other) | Not required |
| Typical Example | CO oxidation on Pt/Pd (2CO* + O* → CO₂) | H₂ reaction with D-precovered surfaces (H₂(g) + D* → HD(g)) |
Experimental Protocols for Discriminating LH Pathways
Validating an LH mechanism requires experiments that probe adsorbed intermediates and their interactions.
Protocol 1: Kinetic Parameter Measurement & Inhibition Study
- Objective: Determine reaction order and identify competitive adsorption.
- Methodology:
- Using a plug-flow or batch reactor, measure the steady-state reaction rate while varying the partial pressure of reactant A ((PA)), keeping (PB) and temperature constant.
- Repeat, varying (PB) while keeping (PA) constant.
- Plot initial rate vs. partial pressure. An LH mechanism often exhibits a maximum (volcano curve), whereas ER shows a monotonic increase.
- Fit data to the LH rate equation to extract apparent (k), (KA), and (KB).
Protocol 2: In Situ Spectroscopic Verification of Co-adsorption (DRIFTS)
- Objective: Provide direct evidence of coexisting adsorbed intermediates.
- Methodology:
- Load catalyst into a Diffuse Reflectance Infrared Fourier Transform Spectroscopy (DRIFTS) cell reactor.
- Pre-treat catalyst under inert flow at high temperature.
- Cool to reaction temperature and adsorb reactant A, collecting a background spectrum.
- Introduce reactant B into the flow. Monitor the IR spectrum for simultaneous signatures of adsorbed A and B species (e.g., C-O stretch for CO*, O-H/N-H stretches for other species).
- Correlate the evolution of these spectral features with product formation (via simultaneous mass spectrometry) to confirm they are reactive intermediates.
Protocol 3: Isotopic Transient Kinetic Analysis (ITKA)
- Objective: Measure surface coverage and residence time of reactive intermediates.
- Methodology:
- Establish steady-state reaction using a labeled isotope (e.g., (^{12})CO + O₂).
- Perform a rapid switch to an isotopically different, but chemically identical, feed (e.g., (^{13})CO + O₂).
- Monitor the transient response of products (e.g., (^{12})CO₂, (^{13})CO₂) using a mass spectrometer.
- The decay of the "old" isotope in the product provides a direct measure of the surface residence time and inventory (coverage) of the reactive adsorbed species, confirming their involvement in a surface-mediated (LH) pathway.
Visualization of the LH Mechanism & Experimental Workflow
Title: LH Mechanism Reaction Sequence
Title: Experimental Workflow for LH Validation
The Scientist's Toolkit: Key Research Reagents & Materials
Table 2: Essential Materials for Investigating LH Mechanisms
| Item | Function in LH Mechanism Studies |
|---|---|
| Model Heterogeneous Catalyst (e.g., Pt/Al₂O₃, Pd(111) single crystal) | Provides a well-defined surface with active sites for the adsorption of reactants A and B, essential for studying intrinsic kinetics. |
| High-Purity Reactant Gases (e.g., CO, H₂, O₂) & Isotopic Variants (¹³CO, D₂) | Reactants for the target reaction. Isotopic variants are critical for ITKA and spectroscopic labeling to track specific surface species. |
| Inert Gas (Ultra-high purity He, Ar) | Used for catalyst pretreatment (calcination, reduction), purging systems, and as a diluent in kinetic experiments. |
| Plug-Flow Microreactor System with Mass Flow Controllers | Allows precise control of reactant partial pressures for kinetic measurements and inhibition studies. |
| In Situ Spectroscopic Cell (DRIFTS, XAS, PM-IRRAS) | Enables real-time observation of adsorbed species and their interactions under reaction conditions, confirming co-adsorption. |
| Quadrupole Mass Spectrometer (QMS) | For real-time product analysis during kinetic runs and essential for monitoring transient isotopic switches during ITKA experiments. |
| Temperature-Programmed Desorption (TPD) System | Used to characterize adsorption strength (binding energy) of individual reactants, informing the adsorption constants (KA, KB) in the LH model. |
This whitepaper details the Eley-Rideal (ER) mechanism, a critical surface reaction model. The broader thesis examines the fundamental competition between the Eley-Rideal and Langmuir-Hinshelwood (LH) mechanisms in heterogeneous catalysis. While the LH mechanism requires both reactants to be adsorbed on the catalyst surface prior to reaction, the ER mechanism involves the direct reaction of a gaseous (or mobile) phase molecule with a specifically adsorbed atom or molecule. Distinguishing the dominant mechanism is paramount for optimizing catalytic processes in chemical synthesis, environmental remediation, and pharmaceutical manufacturing, where selectivity and efficiency are driven by reaction pathways.
Core Mechanism and Theoretical Framework
The generic Eley-Rideal reaction can be represented as:
- A(g) + → A (Adsorption of species A onto an active site *).
- A* + B(g) → C(g) + * (Direct reaction of adsorbed A with gas-phase B).
The rate law is often expressed as: ( r = k \, PB \, \thetaA ), where ( k ) is the rate constant, ( PB ) is the partial pressure of the gas-phase reactant B, and ( \thetaA ) is the surface coverage of the adsorbed reactant A. This linear dependence on ( PB ) and often Langmuirian dependence on ( PA ) is a key diagnostic feature.
Key Experimental Methodologies for Mechanism Discrimination
Temperature-Programmed Reaction Spectroscopy (TPRS)
- Objective: To differentiate ER from LH by observing the reaction product evolution as a function of temperature.
- Protocol:
- A clean single-crystal or well-defined catalyst surface is prepared in an ultra-high vacuum (UHV) chamber.
- Dose A: The surface is saturated with reactant A (e.g., H atoms, CO) at low temperature (e.g., 100 K).
- Expose to B: The surface is then exposed to a continuous, calibrated flux of gas-phase reactant B (e.g., O atoms, D₂).
- Temperature Ramp: The surface temperature is linearly increased while a quadrupole mass spectrometer (QMS) monitors the partial pressures of reactants and products (e.g., H₂O, HD, CO₂).
- Data Interpretation: A reaction peak during the continuous exposure to B, especially at temperatures where B does not adsorb, is indicative of ER. An LH reaction typically shows a product peak only after both A and B are pre-adsorbed.
Molecular Beam Scattering Experiments
- Objective: To provide direct, unambiguous evidence for an ER reaction by controlling the energy and identity of the gas-phase reactant.
- Protocol:
- A supersonic molecular beam of reactant B is generated with a well-defined kinetic energy and angle of incidence.
- The beam is directed onto a surface pre-covered with a known coverage of species A.
- Time-Resolved Detection: A mass spectrometer, often rotatable, detects the products (C) scattered from the surface in real-time.
- Key Measurements: The product yield is measured as a function of B beam energy, A surface coverage, and scattering angle. A direct correlation between product signal and A-coverage, and a high product yield at beam energies below the adsorption barrier for B, strongly support an ER pathway.
Isotopic Labelling Studies
- Objective: To trace the origin of atoms in the product, confirming the direct reaction between a specific adsorbed species and a gas-phase species.
- Protocol:
- The surface is saturated with an isotopically labeled adsorbate (e.g., ¹⁸O*).
- The surface is then exposed to the gas-phase reactant with a different isotopic label (e.g., ¹⁶O₂(g) or D₂(g)).
- The reaction products are monitored using mass spectrometry (e.g., for ¹⁶O¹⁸O or HD).
- The immediate formation of the mixed isotope product upon exposure, without scrambling, is a signature of the ER mechanism.
Data Presentation: Comparative Kinetic Signatures
Table 1: Kinetic Signatures Differentiating ER and LH Mechanisms
| Feature | Eley-Rideal Mechanism | Langmuir-Hinshelwood Mechanism |
|---|---|---|
| Rate Dependence on (P_B) | Linear at low coverage | Often exhibits a maximum (due to competitive adsorption) |
| Order in (P_A) | Langmuir-type (saturating) | Langmuir-type (can pass through a maximum) |
| Effect of Pre-adsorption | Reaction occurs during exposure to B | Reaction requires prior co-adsorption of A and B |
| Isotope Scrambling | Immediate mixed product | May show delay or require heating for mixing |
| Activation Energy | Often lower, no need to activate adsorbed B | Includes activation energy for surface diffusion |
Table 2: Classic Experimental Systems Demonstrating ER Behavior
| System (A(ads) + B(g)) | Product | Key Experimental Technique | Key Evidence |
|---|---|---|---|
| H(D)/Cu(111) + D(H)₂ | HD, H₂, D₂ | Molecular Beam, TPRS | HD formation at energies below D₂ dissociation barrier. |
| N/W(100) + N₂ | N₂ | Beam Relaxation Spectroscopy | Direct abstraction by gas-phase N atoms. |
| O/Ag(111) + C₂H₄ | Ethylene Oxide, CO₂ | Flow Reactor, Spectroscopy | Reactivity dependence on O coverage, not C₂H₄ pressure. |
| CO/Pd(111) + O₂ | CO₂ | Molecular Beam, TPRS | Low-temperature CO₂ formation during O₂ exposure. |
Visualizing Mechanism Discrimination
Diagram 1: Experimental Flow for Discriminating ER vs LH.
Diagram 2: The Eley-Rideal Reaction Coordinate.
The Scientist's Toolkit: Key Research Reagents & Materials
Table 3: Essential Materials for Investigating the Eley-Rideal Mechanism
| Item | Function & Relevance |
|---|---|
| Single Crystal Metal Surfaces (e.g., Pt(111), Cu(110)) | Provides a well-defined, atomically clean substrate with known active sites for fundamental studies. |
| Isotopically Labeled Gases (e.g., D₂, ¹⁸O₂, ¹³CO) | Critical for isotopic labelling experiments to trace reaction pathways and confirm ER abstraction. |
| Supersonic Molecular Beam Source | Generates a directed, energetically controlled flux of gas-phase reactant B for unambiguous ER detection. |
| Quadrupole Mass Spectrometer (QMS) | The primary detector for monitoring gas-phase composition, reaction products, and isotopic distributions in real-time. |
| Atomic Source (Hot Filament/Cracker) | Produces beams of atomic reactants (e.g., H, O, N) which are common participants in ER reactions. |
| Low-Energy Electron Diffraction (LEED) / AES Optics | Used to characterize surface cleanliness, order, and composition before and after experiments. |
| Ultra-High Vacuum (UHV) System (<10⁻¹⁰ mbar) | Essential for maintaining surface cleanliness over long experimental timeframes and using electron-based diagnostics. |
| Programmable Temperature Controller | Enables precise linear temperature ramping for TPRS experiments. |
This whitepaper situates the comparative analysis of the Eley-Rideal (ER) and Langmuir-Hinshelwood (LH) mechanisms within a historical framework, tracing the evolution of their theoretical foundations from early chemical kinetics to modern computational and experimental interpretations. The enduring investigation into these distinct surface reaction pathways—one involving a direct reaction between an adsorbed species and a gas-phase molecule (ER) and the other a reaction between two co-adsorbed species (LH)—is pivotal for heterogeneous catalysis, with profound implications for industrial chemical synthesis and pharmaceutical process development.
Historical Trajectory of Mechanistic Theory
The development of surface reaction mechanisms paralleled advances in the understanding of adsorption and catalysis in the early 20th century.
- Langmuir Isotherm (1918): Irving Langmuir's work on chemisorption provided the foundational concept of a monolayer and the kinetic treatment of adsorption/desorption equilibrium. This directly enabled the Langmuir-Hinshelwood (1930s) mechanism, proposed by Cyril Hinshelwood and others, which required both reactants to be chemisorbed on adjacent sites before reacting.
- Eley-Rideal (1938-1943): As an alternative, D. D. Eley and E. K. Rideal proposed a mechanism where one strongly adsorbed reactant reacts directly with a second reactant from the gas phase or a weakly held physisorbed state. This was initially less favored but gained ground for specific reactions like hydrogenation with deuterium.
- Modern Synthesis: The late 20th and 21st centuries have integrated these classical models with sophisticated techniques. Temperature-Programmed Desorption (TPD), Scanning Tunneling Microscopy (STM), and Density Functional Theory (DFT) calculations allow for the direct observation of adsorbed species and the calculation of activation barriers, leading to the recognition that many reactions proceed via complex hybrid mechanisms involving both Eley-Rideal and Langmuir-Hinshelwood steps under different conditions.
Quantitative Comparison of ER and LH Kinetics
The fundamental kinetic formulations derived from each mechanism's postulates lead to distinct predictions under varying pressure conditions.
Table 1: Core Kinetic Parameters and Formulations
| Feature | Langmuir-Hinshelwood Mechanism | Eley-Rideal Mechanism |
|---|---|---|
| Primary Postulate | Reaction occurs between two adjacent chemisorbed species. | Reaction occurs between a chemisorbed species and a gas-phase (or weakly physisorbed) species. |
| Standard Rate Expression | ( r = k \thetaA \thetaB = \frac{k KA KB PA PB}{(1 + KA PA + KB PB)^2} ) | ( r = k \thetaA PB = \frac{k KA PA PB}{1 + KA P_A} ) |
| Dependence on Pressure | Rate often passes through a maximum as pressure of one reactant increases (due to competitive adsorption). | Rate increases monotonically with pressure of both reactants, saturating with respect to the adsorbed species A. |
| Apparent Activation Energy | Can be complex, incorporating heats of adsorption. | ( E{app} = E{true} - \Delta H_{ads,A} ) |
| Typical Evidence | Inhibition by a product or reactant, spectroscopic identification of co-adsorbed intermediates. | Reaction proceeds even when one reactant's coverage is immeasurably low; isotopic mixing experiments. |
Table 2: Experimental Differentiators from Recent Studies (2020-2024)
| Experimental Probe | LH Mechanism Signature | ER Mechanism Signature | Key Reference Technique |
|---|---|---|---|
| Isotopic Transient Kinetics | Slow exchange; rate limited by surface diffusion and recombination. | Fast exchange; immediate product formation upon gas-phase switch. | Pulsed Molecular Beam MS |
| STM at Single-Crystal Level | Visualized paired adsorbates prior to reaction. | Reaction event correlated with gas-phase dosing, not surface diffusion. | High-Pressure STM |
| DFT Calculations | Identifies a stable co-adsorption state and a lower barrier for the surface reaction pathway. | Identifies a negligible barrier for gas-phase species approaching adsorbed species; no stable co-adsorption complex. | Microkinetic Modeling |
| Modulation Excitation Spectroscopy | Surface intermediate concentration oscillates in phase with both reactants' modulation. | Surface intermediate concentration oscillates in phase with only the adsorbed reactant's modulation. | DRIFTS / XAS |
Detailed Experimental Protocols for Mechanistic Discrimination
Protocol: Isotopic Labelling Pulse-Exchange Experiment
Objective: To distinguish between ER and LH pathways in a catalytic hydrogenation reaction (e.g., CO₂ to CH₄).
- Catalyst Activation: Reduce a 50 mg supported metal catalyst (e.g., Ni/Al₂O₃) in situ in a plug-flow microreactor under 5% H₂/Ar at 500°C for 2 hours.
- Steady-State Reaction: Establish steady-state catalysis under 1 bar total pressure with a feed of ⁴H₂ (or H₂) and CO₂ at a 4:1 ratio, 250°C. Monitor CH₄ formation via online Mass Spectrometry (MS).
- Isotopic Pulse: Rapidly switch the hydrogen source from ⁴H₂ to D₂ while maintaining all other conditions (flow, pressure, CO₂ concentration) constant.
- Mass Spectrometry Tracking: Monitor the temporal evolution of product masses (e.g., CH₄, CH₃D, CH₂D₂, etc.) at m/z 15-20 with high temporal resolution (<1 sec).
- Data Interpretation (LH vs. ER):
- LH-Dominated: Gradual, multi-step incorporation of D into CH₄, indicating H/D mixing in a surface pool before reaction.
- ER-Dominated: Immediate formation of CH₃D upon D₂ introduction, with kinetics mirroring the gas-phase switch, suggesting direct reaction between adsorbed C/O intermediates and gas-phase D₂.
Protocol: In Situ DRIFTS for Intermediate Identification
Objective: To spectroscopically identify co-adsorbed intermediates indicative of an LH pathway.
- Sample Preparation: Load a powdered catalyst into a Harrick in situ Diffuse Reflectance Infrared Fourier Transform Spectroscopy (DRIFTS) cell with ZnSe windows.
- Background Collection: Collect a background spectrum under flowing Ar at reaction temperature (e.g., 150°C).
- Sequential Adsorption: Expose catalyst to reactant A (e.g., CO) until saturation, collect spectrum. Purge with Ar. Then expose to reactant B (e.g., NO). Collect spectra at 30-second intervals.
- Analysis: Look for the disappearance of bands associated with adsorbed A and the simultaneous appearance of new bands associated with a potential co-adsorbed complex A-B or a reaction product. The stability of a co-adsorbed state under reaction conditions supports an LH pathway.
Visualization of Mechanisms and Workflows
Diagram Title: ER and LH Reaction Pathway Comparison
Diagram Title: Experimental Workflow for Mechanism Assignment
The Scientist's Toolkit: Key Research Reagents & Materials
Table 3: Essential Research Toolkit for ER/LH Studies
| Item | Function & Rationale |
|---|---|
| Single-Crystal Metal Surfaces (e.g., Pt(111), Cu(110)) | Provides a well-defined, atomically clean model catalyst surface to study fundamental adsorption and reaction steps without complications from supports or ill-defined sites. |
| Isotopically Labelled Gases (¹³CO, D₂, ¹⁸O₂) | Enables tracking of specific atoms through reaction networks via techniques like MS or spectroscopy, crucial for distinguishing parallel pathways (e.g., ER vs. LH). |
| Calibrated Molecular Beam Epitaxy (MBE) Source | Allows for controlled, layer-by-layer deposition of catalyst materials or precise doping to create model surfaces for UHV studies. |
| In Situ DRIFTS or FTIR Cell | Enables real-time identification of surface intermediates and adsorbed species under reaction conditions, providing direct evidence for co-adsorption (LH) or lack thereof (ER). |
| Plasma Sputter Coater (for SEM/TEM) | Prepares non-conductive catalyst samples for high-resolution electron microscopy by applying a thin conductive layer (e.g., Au, Pt), allowing visualization of nanoparticle morphology. |
| High-Sensitivity Quadrupole Mass Spectrometer (QMS) | Detects reaction products and traces gas-phase composition with very low detection limits and fast time response, essential for transient kinetic experiments like ITKA. |
| DFT Software (e.g., VASP, Quantum ESPRESSO) | Computes adsorption energies, reaction barriers, and vibrational frequencies from first principles, allowing prediction of the most energetically favorable mechanism. |
| Modulation Excitation Setup with Phase-Sensitive Detection | Amplifies the signal of active surface intermediates by periodically perturbing the reaction (e.g., reactant concentration) and filtering the response, enhancing spectroscopic sensitivity. |
Critical Assumptions and Ideal Conditions for Each Mechanism
This whitepaper, situated within a broader thesis on comparative surface reaction kinetics, provides an in-depth technical analysis of the critical assumptions and requisite conditions for the Eley-Rideal (ER) and Langmuir-Hinshelwood (LH) mechanisms. Understanding these foundational aspects is paramount for researchers in catalysis, surface science, and drug development, where such models inform catalyst design and molecular interaction studies.
Fundamental Mechanisms and Core Assumptions
Eley-Rideal Mechanism
The ER mechanism postulates a direct reaction between a strongly adsorbed species and a non-adsorbed (or weakly/physiorbed) reactant from the gas or liquid phase. The central assumption is the absence of adsorption equilibrium for the incoming reactant prior to the rate-determining step.
Critical Assumptions:
- One reactant (A) is chemisorbed and saturates the surface.
- The second reactant (B) does not adsorb appreciably; it reacts directly from the fluid phase.
- The surface coverage of A is independent of the pressure/concentration of B.
- The reaction between adsorbed A and gaseous B is the rate-determining step.
Langmuir-Hinshelwood Mechanism
The LH mechanism involves a reaction between two or more species that are both chemisorbed on the catalyst surface. The reaction proceeds through their interaction as adjacent adsorbed entities.
Critical Assumptions:
- All reactants adsorb onto the surface, each reaching its own quasi-equilibrium.
- Adsorption follows the Langmuir isotherm (uniform surface, no interactions).
- The surface reaction between adjacent adsorbed species is the rate-determining step.
- The concentration of adsorbed species is governed by their respective adsorption equilibria.
Ideal Conditions and Quantitative Data
The operative mechanism is highly sensitive to reaction conditions. The following table summarizes the ideal conditions and characteristic kinetic signatures for each pathway.
Table 1: Ideal Conditions and Kinetic Signatures
| Parameter | Eley-Rideal Mechanism | Langmuir-Hinshelwood Mechanism |
|---|---|---|
| Primary Condition | Strong adsorption disparity between reactants. | Comparable adsorption strengths for reactants. |
| Typical Temperature | Often lower temps, where adsorption of one species is strong and irreversible. | Moderate temps where adsorption/desorption equilibria are rapidly established. |
| Pressure Dependence | Rate ∝ PA (at high θA) & Rate ∝ PB1. Linear in gaseous reactant. | Exhibits a maximum with respect to reactant pressure. Rate ∝ (PAPB) / (1 + KAPA + KBPB)². |
| Surface Coverage | θA ≈ 1 (saturated), θB ≈ 0. | θA and θB vary with pressure, competing for sites. |
| Activation Energy | Apparent Ea ≈ Ea,rxn - ΔHads,A. | Apparent Ea ≈ Ea,rxn + ΔHads,A + ΔHads,B. |
| Isotope Scrambling | Not observed if the gaseous reactant reacts directly. | Observed if adsorption/desorption is faster than surface reaction. |
| Inhibition by Product | Uncommon, unless product adsorbs on A sites. | Common if product or impurity adsorbs strongly, blocking sites. |
Notes: 1. At constant θA. 2. For a bimolecular A+B reaction assuming non-dissociative adsorption.
Experimental Protocols for Mechanism Discrimination
Protocol: Kinetic Rate Law Analysis
Objective: Determine the reaction order with respect to each reactant pressure/partial pressure. Methodology:
- Conduct steady-state rate measurements in a plug-flow or batch reactor.
- Vary the partial pressure of reactant A while keeping B in large excess (pseudo-first-order conditions).
- Repeat, varying partial pressure of B with A in excess.
- Plot log(rate) vs. log(Pi) to extract reaction orders.
- Interpretation: A first-order dependence on gaseous B pressure and zero-order on adsorbed A pressure supports ER. A rate maximum as a function of pressure for either reactant supports LH.
Protocol: Isotopic Transient Kinetics (ITK)
Objective: Probe the adsorption and participation of reactants. Methodology:
- Pre-adsorb reactant A (e.g., 12C-labeled) onto the catalyst surface.
- Switch the gas phase to a mixture containing reactant B and a different isotope of A (e.g., 13C-labeled).
- Monitor the transient response of products and reactants using mass spectrometry.
- Interpretation: Immediate appearance of the product containing the original isotope (12C) indicates ER (gas-phase 13C-A reacts with adsorbed 12C-A). Appearance of only the new isotope (13C) product suggests LH (both must adsorb first, leading to isotopic scrambling).
Protocol: In-situ Spectroscopy during Reaction
Objective: Identify adsorbed species and surface intermediates under working conditions. Methodology:
- Utilize in-situ FTIR, Raman, or XPS in a controlled-environment reaction cell.
- Observe the surface while introducing reactants sequentially (A then B, versus A+B mixture).
- Correlate the appearance/disappearance of spectral features (e.g., adsorbate bands) with product formation measured simultaneously.
- Interpretation: Detection of both A and B adsorbed simultaneously under reaction conditions is necessary (but not sufficient) for LH. Observation of only adsorbed A with the introduction of gaseous B leading directly to product loss supports ER.
Visualizing Reaction Pathways and Workflows
Title: Eley-Rideal vs. Langmuir-Hinshelwood Reaction Pathways
Title: Workflow for Discriminating ER and LH Mechanisms
The Scientist's Toolkit: Essential Research Reagents & Materials
Table 2: Key Research Reagent Solutions and Materials
| Item | Function in ER/LH Studies | Key Considerations |
|---|---|---|
| Well-Defined Model Catalyst (e.g., single crystal, synthesized nanoparticles) | Provides a uniform surface with known structure and composition, essential for testing mechanistic assumptions. | Crystal face, particle size, and dispersion must be characterized (TEM, XRD). |
| Isotopically Labeled Reactants (13C, 18O, D2) | Enables isotopic tracing experiments (ITK) to track the source of atoms in products, crucial for mechanism proof. | High isotopic purity (>99%) is required. Can be cost-prohibitive. |
| In-situ/Operando Spectroscopy Cell | Allows simultaneous reaction monitoring and surface species analysis under realistic conditions (FTIR, Raman, XAS). | Must maintain relevant temperature/pressure and be transparent to the probe beam. |
| Pulse Chemisorption System | Quantifies active surface sites and measures adsorption strengths/stoichiometries of individual reactants. | Probe molecule choice (CO, H2, O2) is critical and catalyst-specific. |
| Mass Spectrometer (QMS) | For real-time analysis of gas-phase composition during transient and steady-state kinetics experiments. | Fast response time and low detection limits are necessary for kinetic isotope studies. |
| Ultra-High Purity Gases & Gas Handling System | Delivers precise, contaminant-free reactant mixtures. Impurities can poison surfaces and skew results. | Requires rigorous purification traps (e.g., for O2, H2O) and mass flow controllers. |
| Temperature-Programmed Desorption (TPD) Setup | Probes the adsorption energy and binding states of reactants and potential intermediates on the clean surface. | Heating rate and baseline stability are critical for accurate quantification of desorption peaks. |
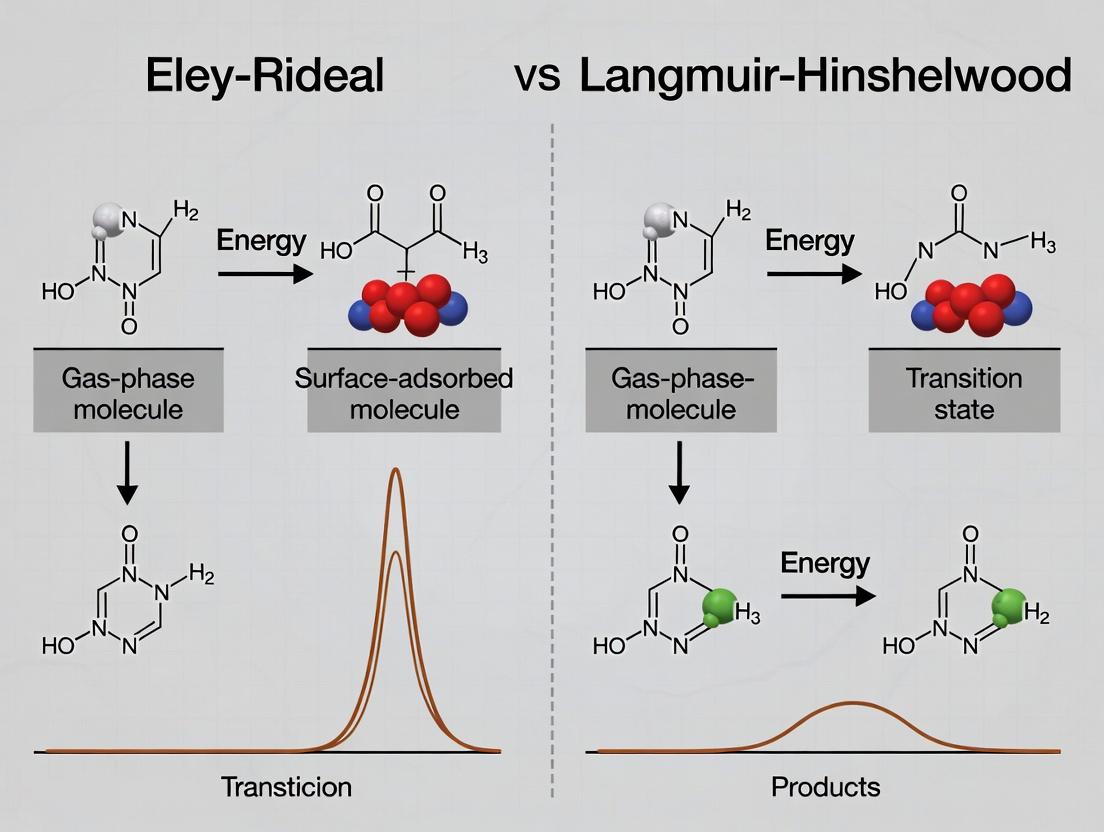
Within the broader research on heterogeneous catalytic mechanisms, the Langmuir-Hinshelwood (LH) and Eley-Rideal (ER) models represent two foundational paradigms. This whitepaper provides a technical guide to their comparative schematic visualization, focusing on their application in surface science and catalytic drug development. The core distinction lies in the adsorption state of the reacting species: the LH mechanism requires both reactants to be adsorbed onto the catalyst surface prior to reaction, whereas the ER mechanism involves a direct reaction between an adsorbed species and a gaseous (or liquid-phase) reactant.
Core Mechanism Diagrams
Diagram 1: Langmuir-Hinshelwood Mechanism Pathway
Title: Langmuir-Hinshelwood Reaction Steps
Diagram 2: Eley-Rideal Mechanism Pathway
Title: Eley-Rideal Reaction Steps
Quantitative Kinetic Comparison
Table 1: Kinetic Parameters & Rate Laws
| Parameter / Expression | Langmuir-Hinshelwood Mechanism | Eley-Rideal Mechanism |
|---|---|---|
| Primary Assumption | Both reactants (A, B) adsorb onto the surface before reaction. | Only one reactant (A) adsorbs; the other (B) reacts directly from the fluid phase. |
| Typical Rate Law | ( r = k \thetaA \thetaB = \frac{k KA KB PA PB}{(1 + KA PA + KB PB)^2} ) | ( r = k \thetaA PB = \frac{k KA PA PB}{1 + KA P_A} ) |
| Dependence on Pressure (P_B) | Appears in numerator & denominator; rate may decrease at high P_B due to site competition. | Linear in numerator, no competition for sites; rate increases monotonically with P_B. |
| Activation Energy (Eₐ) | Often includes terms for surface diffusion of adsorbed species. | Typically lower, as it bypasses the need for dual adsorption and surface diffusion. |
| Key Diagnostic Test | Rate maximum as a function of reactant partial pressure. | Linear dependence on the pressure of the non-adsorbed reactant. |
Table 2: Experimental Conditions Favoring Each Mechanism
| Experimental Condition | Favors LH Mechanism | Favors ER Mechanism |
|---|---|---|
| Surface Coverage | High, comparable coverage of both reactants. | Low coverage of one reactant, high vacuum or excess of one gaseous reactant. |
| Temperature | Moderate, allowing for sufficient adsorption and surface mobility. | Can be broader; often invoked for "hot" atoms or high-energy direct collisions. |
| Reactant Stickiness (Sticking Coefficient) | High for both reactants. | High for adsorbed species, low for impacting species. |
| Isotopic Labeling Results | Scrambling of isotopes between adsorbed species is observed. | Limited isotopic mixing; product reflects direct partnership. |
| Common Catalytic Systems | CO oxidation on Pt-group metals, many hydrogenation reactions. | Hydrogen atom addition on graphitic surfaces, some radical-involved reactions. |
Experimental Protocols for Discrimination
Protocol 1: Kinetic Isotope Effect (KIE) & Transient Experiments
Objective: To distinguish LH from ER pathways by tracking the fate of labeled atoms. Methodology:
- Prepare a single-crystal catalyst surface under Ultra-High Vacuum (UHV) conditions.
- Pre-adsorb a saturated layer of one reactant (e.g., ¹²CO) at 100K.
- Expose the surface to a pulse of the isotopically labeled second reactant (e.g., ¹³O₂) at a known pressure and temperature.
- Use a mass spectrometer (e.g., QMS) to monitor the temporal evolution (transient response) of products (¹²C¹⁶O¹⁸O, ¹²C¹⁶O₂, etc.).
- Data Interpretation (LH vs. ER): In a pure ER mechanism, the pre-adsorbed ¹²CO would react only with incoming ¹³O₂, producing only ¹²C¹⁶O¹⁸O. In an LH mechanism, ¹³O₂ dissociates and adsorbs first, leading to mixing and multiple product isotopologues.
Protocol 2: Variation of Partial Pressures & Rate Law Fitting
Objective: To measure reaction order and fit experimental data to LH or ER rate laws. Methodology:
- Set up a continuous-flow microreactor with precise mass flow controllers for gases A and B.
- Stabilize the catalyst (e.g., powdered metal on support) at the reaction temperature (e.g., 500K).
- Hold the partial pressure of reactant A (PA) constant while systematically varying the partial pressure of reactant B (PB) over a defined range.
- Measure the steady-state reaction rate using online GC or MS.
- Plot rate vs. P_B. A linear relationship suggests ER kinetics. A curve that passes through a maximum is characteristic of LH kinetics where both species compete for sites.
- Perform non-linear regression to fit the data to the rate equations in Table 1.
The Scientist's Toolkit: Key Research Reagent Solutions
Table 3: Essential Materials for LH/ER Mechanism Studies
| Item / Reagent | Function / Role in Experiment |
|---|---|
| Single-Crystal Metal Surfaces (e.g., Pt(111), Pd(100)) | Provides a well-defined, atomically clean surface with known coordination sites, essential for fundamental adsorption and kinetic studies. |
| Calibrated Mass Flow Controllers (MFCs) | Precisely regulate the partial pressures of reactant gases (CO, H₂, O₂) in continuous-flow experiments, enabling accurate kinetic measurements. |
| Quadrupole Mass Spectrometer (QMS) | Monitors gas-phase composition in real-time during Temperature-Programmed Desorption (TPD) or Reaction (TPR) experiments, tracking reactants, intermediates, and products. |
| Isotopically Labeled Gases (e.g., ¹³CO, D₂, ¹⁸O₂) | Serves as tracers to follow the pathway of specific atoms, crucial for distinguishing LH (mixing) from ER (non-mixing) mechanisms. |
| UHV Chamber with LEED/AES | Maintains an ultra-clean environment. Low-Energy Electron Diffraction (LEED) confirms surface order; Auger Electron Spectroscopy (AES) verifies surface cleanliness and composition. |
| Supported Metal Nanoparticle Catalysts (e.g., 2% Pt/Al₂O₃) | Represents industrially relevant high-surface-area catalysts for testing mechanisms under more practical conditions compared to single crystals. |
Integrated Experimental Workflow
Diagram 3: Discriminatory Experimental Workflow
Title: LH vs ER Mechanism Identification Workflow
Advanced Considerations & Computational Links
Modern research integrates these schematic models with Density Functional Theory (DFT) calculations to map potential energy surfaces and identify transition states. Microkinetic modeling then combines first-principles data with experimental rate constants to build a complete picture, often revealing that real-world catalytic cycles operate via mixed LH-ER pathways depending on the pressure and temperature regime. This comparative visualization serves as the critical first step in rational catalyst design for pharmaceutical synthesis and other fine chemical applications.
Applying LH and ER Models: Methodologies in Catalysis and Biomedical Research
Within the critical discourse on heterogeneous surface reaction mechanisms, the distinction between the Eley-Rideal (ER) and Langmuir-Hinshelwood (LH) models remains a central focus. The ER mechanism involves a direct reaction between a chemisorbed species and a gas-phase (or weakly physisorbed) reactant, while the LH mechanism requires the interaction of two co-adsorbed species. Elucidating the operative mechanism is fundamental across catalysis, sensor design, and pharmaceutical development—where surface interactions underpin drug delivery systems and catalyst-supported synthesis. This guide details four pivotal experimental techniques for probing these surface mechanisms: Temperature-Programmed Desorption (TPD), Fourier-Transform Infrared Spectroscopy (FTIR), Scanning Tunneling Microscopy (STM), and Kinetic Isotope Effect (KIE) analysis.
Temperature-Programmed Desorption (TPD)
TPD monitors the desorption of molecules from a surface as a function of linearly increasing temperature, providing data on adsorption strength, binding states, surface coverage, and reaction intermediates.
Core Protocol
- Surface Preparation: Clean single-crystal or well-defined model catalyst surface under ultra-high vacuum (UHV, base pressure <1×10⁻⁹ mbar).
- Adsorption: Expose the clean surface to a precise dose of reactant gas (e.g., CO, H₂) at a low temperature (often 100-150 K) to populate adsorption sites.
- Linear Ramp: Evacuate the gas phase and heat the sample linearly (typical β = 0.5-5 K/s) using a resistive heater or radiative method.
- Detection: Monitor desorbing species with a quadrupole mass spectrometer (QMS). The QMS is tuned to specific mass-to-charge ratios (m/z) to track fragments or parent molecules.
Data Interpretation in ER vs. LH Context
- LH Diagnostic: Appearance of a reaction product (e.g., H₂O from CO and O) at a temperature different from the desorption peaks of the individual reactants suggests a surface reaction between co-adsorbed species, indicative of LH.
- ER Diagnostic: A reaction product that desorbs concurrently with the desorption of one reactant, while the other reactant remains on the surface, can suggest an ER-type process where the gas-phase species reacts directly with the adsorbed layer during heating.
Table 1: Representative TPD Data for CO Oxidation on Pt(111)
| Adsorbed Species | Desorption Peak (K) | Peak Assignment | Mechanism Indicator |
|---|---|---|---|
| CO (alone) | ~480 | CO desorption from Pt | Reference |
| O₂ (alone) | No peak below 800K | Atomic O remains adsorbed | Reference |
| Co-adsorbed CO + O | CO₂ peak at ~350 | Reaction product desorption | LH (reaction requires co-adsorption) |
| Hypothetical ER Scenario | CO₂ peak at ~480 | CO₂ coincident with CO desorption | Possible ER pathway |
Workflow: TPD Experimental Process
Fourier-Transform Infrared Spectroscopy (FTIR)
FTIR spectroscopy identifies molecular vibrations of adsorbates, providing information on chemical identity, bonding configuration, and site occupancy.
Core Protocol (Transmission Mode for Powders)
- Sample Preparation: Press catalyst powder into a self-supporting wafer. Load into a controlled-environment cell (UHV to high-pressure capable).
- Pre-treatment: Activate catalyst in situ (e.g., heating in O₂, then H₂, then evacuation).
- Background Scan: Collect interferogram and compute background spectrum (I₀) under vacuum or inert atmosphere.
- Adsorption/Reaction: Introduce probe molecule (e.g., CO at 1-100 mbar) or reactant mixture.
- Measurement: Collect new interferogram (I), compute transmittance (I/I₀) or absorbance (-log(I/I₀)) spectrum. Use high-resolution settings (e.g., 4 cm⁻¹).
- In situ Reaction Monitoring: Flow reactants while collecting time-resolved spectra.
Data Interpretation in ER vs. LH Context
- LH Diagnostic: Observation of distinct IR bands for both reactants co-adsorbed on the surface prior to reaction. Shifts in these bands due to co-adsorption indicate intermolecular interaction, a prerequisite for LH.
- ER Diagnostic: If one reactant's IR band disappears upon introduction of a second reactant without evidence of the second reactant adsorbing on the same sites, it may suggest a direct ER reaction. Attenuated Total Reflection (ATR) setups can probe liquid-solid interfaces relevant to pharmaceutical surfaces.
Table 2: Key IR Bands for Common Surface Species
| Adsorbate/Surface | Vibration Mode | Wavenumber Range (cm⁻¹) | Significance |
|---|---|---|---|
| CO on Pt | C-O stretch | 2050-2100 (atop), 1850-1950 (bridge) | Probe for adsorption sites |
| NO on Pd | N-O stretch | 1650-1800 | Distinguishes nitroso vs. nitrate |
| NHₓ on Oxide | N-H stretch | 3200-3400 | Identifies intermediates in SCR |
| Carboxylate on TiO₂ | asymmetric O-C-O | 1500-1650 | Key intermediate in oxidation |
Logic: FTIR-Based LH/ER Differentiation
Scanning Tunneling Microscopy (STM)
STM provides atomic-scale real-space imaging of surface structure and adsorbates, enabling direct observation of reaction sites and elementary steps.
Core Protocol for Surface Reaction Studies
- UHV Preparation: Prepare clean single-crystal surface via sputtering/annealing cycles in UHV.
- Low-Temperature Adsorption: Dose one reactant at low temperature (e.g., 5-80 K) to "freeze" mobility.
- Initial Imaging: Acquire high-resolution STM images to map initial adsorbate distribution.
- Reactant Introduction: Introduce second reactant (for ER) or warm surface to allow mobility (for LH).
- Post-Reaction Imaging: Re-image the same surface region to identify changes: product formation, depletion of reactants, or creation of defects.
Data Interpretation in ER vs. LH Context
- LH Diagnostic: Direct visualization of two co-adsorbed species diffusing and reacting upon thermal activation. Reaction products appear at the boundaries between domains or at specific sites where both species meet.
- ER Diagnostic: Observation of a reactive "etching" front proceeding from surface defects or step edges as a gas-phase reactant interacts, without prior adsorption of the second species in the reacting region. Single-molecule manipulation can test ER reactions directly.
Kinetic Isotope Effect (KIE)
KIE measures the change in reaction rate upon isotopic substitution (e.g., H vs. D, ¹⁶O vs. ¹⁸O). A significant KIE indicates the breaking of that isotopic bond is involved in the rate-determining step (RDS).
Core Protocol
- Kinetic Measurement Setup: Use a well-mixed batch or plug-flow reactor with in situ analytical capability (e.g., mass spectrometry, GC).
- Baseline Rate: Measure reaction rate (r) or turnover frequency (TOF) under standard conditions using the "light" isotopologue (e.g., C₆H₁₄, H₂).
- Isotopic Switch: Switch to the "heavy" isotopologue (e.g., C₆D₁₄, D₂) without changing any other condition (pressure, temperature, flow, coverage).
- Isotopic Rate Measurement: Measure the new steady-state rate (r*).
- Calculation: Compute KIE = r / r*. For primary KIEs, values >> 1.5 (and up to ~10 for H/D) are significant.
Data Interpretation in ER vs. LH Context
- LH Mechanism: A large primary KIE often points to H-transfer (e.g., C-H or O-H cleavage) as the RDS in a surface reaction between two adsorbed species.
- ER Mechanism: A small or absent KIE can be indicative of an ER mechanism where the rate is limited by the collision frequency or adsorption of the gas-phase species, not by bond cleavage of the pre-adsorbed partner. However, if the ER mechanism involves direct H-abstraction, a large KIE is still expected.
Table 3: Interpreting Kinetic Isotope Effect Magnitudes
| KIE (kH / kD) Value | Typical Interpretation | Potential Mechanism Implication |
|---|---|---|
| 1.0 - 1.5 | Secondary KIE or no isotopic sensitivity | RDS does not involve breaking/scission of X-H bond; may favor ER limited by collision. |
| 2.0 - 7.0 | Primary KIE | Cleavage of X-H/D bond is in the RDS. Common in LH surface reactions. |
| > 10 | Tunneling-dominated KIE | Extreme quantum effect, often in H-transfer reactions at low temps. |
The Scientist's Toolkit: Research Reagent Solutions
Table 4: Essential Materials for Surface Mechanism Studies
| Item | Function & Relevance to ER/LH Studies |
|---|---|
| Single-Crystal Surfaces (e.g., Pt(111), Cu(110)) | Provides well-defined atomic arrangements to model specific adsorption sites and track elementary steps without complexity of powders. |
| Isotopically-Labeled Gases (e.g., ¹³CO, D₂, ¹⁸O₂) | Enables KIE experiments and tracing of reaction pathways via MS or spectroscopy. |
| UHV-Compatible QMS System | Essential for TPD and precise gas-phase analysis; quantifies desorption rates and reaction products. |
| FTIR Cell with In Situ Capability | Allows monitoring of adsorbates under reaction conditions (from UHV to ambient pressure) to identify intermediates. |
| Low-Temperature STM with Gas Dosing | Enables atomic-scale visualization of reactants, intermediates, and products to directly observe the sequence of surface events. |
| Calibrated Leak Valves & Pressure Gauges | For precise control and measurement of reactant exposures, critical for determining coverage-dependent kinetics. |
| Model Catalyst Samples (e.g., supported nanoparticles on thin oxide films) | Bridges the "materials gap" between single crystals and practical catalysts while maintaining compatibility with surface science tools. |
No single technique can unambiguously assign a reaction mechanism. A multi-faceted approach is required:
- Use TPD to map adsorption energies and identify reaction temperatures.
- Apply in situ FTIR to identify the chemical nature of coexisting surface species.
- Employ STM to visualize the spatial distribution and mobility of reactants at the atomic scale.
- Perform KIE experiments to probe the kinetic relevance of specific bond cleavage steps.
For example, a reaction showing co-adsorbed species via FTIR, a product desorption peak distinct from reactant desorption in TPD, a large H/D KIE, and STM images of reaction at domain boundaries would strongly support an LH mechanism. Conversely, the absence of adsorption for one reactant, a reaction product coincident with desorption, a low KIE, and STM evidence of reaction at defect frontiers would point toward an ER pathway.
The judicious application and integration of these techniques remain paramount for advancing fundamental surface science and its applications in catalysis and pharmaceutical development, where controlled surface reactions are vital.
The mechanistic study of heterogenous catalysis is fundamentally anchored in two principal models: the Langmuir-Hinshelwood (LH) and Eley-Rideal (ER) mechanisms. Within the broader thesis of LH versus ER research, computational modeling and simulation provide the critical bridge between macroscopic kinetic observations and atomic-scale interactions. The LH mechanism postulates that both reactants adsorb onto the catalyst surface before reacting, while the ER mechanism involves a direct reaction between a gas-phase molecule and an adsorbed species. Distinguishing between these pathways requires a multi-scale computational approach, spanning from Density Functional Theory (DFT) calculations that reveal adsorption energies and reaction barriers, to microkinetic modeling that predicts rate-determining steps and dominant pathways under realistic conditions. This guide details the integrated application of these methods to elucidate complex surface reaction networks.
Foundational Computational Methodologies
Density Functional Theory (DFT) Calculations
DFT serves as the workhorse for first-principles calculation of electronic structure in catalysis.
Experimental Protocol (DFT Calculation for Adsorption Energy):
- Surface Model Construction: Create a slab model (e.g., 3-5 atomic layers) of the catalyst surface (e.g., Pt(111), CeO2(110)) with a sufficient vacuum layer (>15 Å) to prevent periodic interactions.
- Geometry Optimization: Relax the clean slab structure until forces on all atoms are below 0.01 eV/Å.
- Adsorbate Placement: Position the molecule (e.g., CO, O2, H2) at plausible adsorption sites (atop, bridge, hollow).
- Adsorption Optimization: Re-optimize the geometry of the combined slab+adsorbate system.
- Energy Calculation: Compute the adsorption energy (E_ads) using:
E_ads = E_(slab+adsorbate) - E_slab - E_adsorbate, where all energies are for the optimized structures.
Microkinetic Modeling (MKM)
Microkinetic analysis integrates DFT-derived parameters into a set of differential equations describing the time evolution of surface species.
Experimental Protocol (Building a Microkinetic Model):
- Propose Reaction Network: Enumerate all elementary steps (adsorption, desorption, surface reactions) for both LH and ER pathways.
- Parameter Acquisition: Obtain activation barriers (E_a) and pre-exponential factors for each step from DFT or experimental literature. Pre-exponential factors for adsorption are often calculated via collision theory, while for surface reactions, transition state theory is used.
- Rate Equation Formulation: Write mass-balance differential equations for each surface intermediate. For example, the coverage (θ_A) change for species A is:
dθ_A/dt = Σ(rate of formation steps) - Σ(rate of consumption steps). - Steady-State Solution: Solve the coupled differential equations at steady-state (
dθ/dt = 0) to obtain coverages and turnover frequencies (TOFs). - Model Validation & Analysis: Compare predicted TOFs, reaction orders, and apparent activation energies with experimental data. Conduct sensitivity and degree of rate control analyses to identify key steps.
Data Presentation: Comparative Parameters for LH vs. ER Pathways
Table 1: DFT-Derived Energetic Parameters for CO Oxidation on a Model Metal Surface (Representative Data)
| Elementary Step | Proposed Mechanism | Activation Barrier (E_a) [eV] | Reaction Energy (ΔE) [eV] | Method / Functional |
|---|---|---|---|---|
| CO(g) → CO* (adsorption) | LH & ER | - | -1.85 | DFT, RPBE |
| O₂(g) → 2O* (dissociative adsorption) | LH | 0.12 | -0.95 | DFT, RPBE |
| CO* + O* → CO₂(g) (surface reaction) | LH | 0.87 | -1.42 | DFT-NEB, RPBE |
| CO(g) + O* → CO₂(g) (direct reaction) | ER | 0.45 | -2.15 | DFT, RPBE |
Table 2: Microkinetic Simulation Output for CO Oxidation at 500K, P=1 bar (Representative)
| Dominant Pathway | Turnover Frequency (TOF) [s⁻¹] | Rate-Determining Step | Surface Coverage (θ_CO) | Apparent E_a [eV] |
|---|---|---|---|---|
| Langmuir-Hinshelwood | 12.5 | CO* + O* → CO₂(g) (Surface Rxn) | 0.72 | 0.85 |
| Eley-Rideal | 0.8 | O₂ Dissociative Adsorption | 0.05 | 1.10 |
| Mixed Mechanism | 15.2 | O₂ Dissociation & ER Reaction | 0.25 | 0.65 |
Visualizing the Computational Workflow and Reaction Networks
Title: Multiscale Modeling Workflow for Mechanism Discrimination
Title: LH and ER Reaction Pathways for CO Oxidation
Table 3: Key Computational Tools and Resources for Catalytic Modeling
| Tool/Resource Category | Specific Example(s) | Primary Function in LH/ER Research |
|---|---|---|
| Electronic Structure Code | VASP, Quantum ESPRESSO, GPAW, CP2K | Perform DFT calculations to obtain adsorption energies, reaction pathways, and transition states. |
| Transition State Locator | Nudged Elastic Band (NEB), Dimer Method | Find the minimum energy path and activation barrier for an elementary surface reaction step. |
| Microkinetic Solver | CATKIN, KineticsToolbox, Python/Julia ODE Suites (SciPy, DifferentialEquations.jl) | Solve systems of differential equations describing surface coverages and production rates. |
| Catalyst Model Database | Materials Project, CatApp, NOMAD | Access pre-computed structural and energetic data for bulk materials and surfaces to expedite modeling. |
| High-Performance Computing (HPC) | Local Clusters, National Supercomputing Centers (e.g., XSEDE) | Provide the necessary computational power for large-scale DFT and high-throughput kinetic simulations. |
| Data Analysis & Visualization | pymatgen, ASE, Origin, Matplotlib, Paraview | Analyze computational outputs, create publication-quality graphs, and visualize 3D molecular structures. |
Within the broader thesis contrasting the Eley-Rideal (ER) and Langmuir-Hinshelwood (LH) mechanisms, this guide focuses on the application of the LH mechanism—where both reacting species are adsorbed onto the catalyst surface prior to reaction. This framework is paramount for understanding and designing systems in enzymatic catalysis on surfaces and advanced heterogeneous catalysts. The critical distinction from the ER mechanism (where a gas-phase or bulk species reacts directly with an adsorbed species) lies in the requirement for co-adsorption and surface diffusion, making kinetics and design principles distinctly different. This document provides a technical guide to current applications, experimental methodologies, and design principles rooted in the LH paradigm.
Core Principles and Kinetics of the LH Mechanism
The LH mechanism involves sequential steps: 1) adsorption of reactants A and B onto active sites, 2) surface diffusion of adsorbed species (A(ads) and B(ads)), 3) surface reaction to form adsorbed product (AB(ads)), and 4) desorption of product. The rate-determining step is often the surface reaction, leading to a rate expression of the form:
[ r = k \thetaA \thetaB = k \frac{KA KB PA PB}{(1 + KA PA + KB PB)^2} ]
where (k) is the surface reaction rate constant, (\thetai) are surface coverages, (Ki) are adsorption equilibrium constants, and (P_i) are partial pressures (or concentrations for liquid-phase). This creates a characteristic maximum rate at optimal partial pressure ratios, a key diagnostic feature versus ER kinetics.
Quantitative Comparison of LH vs. ER Kinetic Signatures
Table 1: Diagnostic kinetic features distinguishing LH and ER mechanisms.
| Feature | Langmuir-Hinshelwood Mechanism | Eley-Rideal Mechanism |
|---|---|---|
| Dependence on Coverage | Rate proportional to (\thetaA * \thetaB). Bimolecular on surface. | Rate proportional to (\thetaA) (or (\thetaB)) only. Unimolecular on surface. |
| Pressure Dependence | Rate often passes through a maximum with increasing reactant pressure. | Rate saturates monotonically with increasing pressure of the adsorbed reactant. |
| Inhibition by Reactants | Strong reactant inhibition possible when one species dominates sites. | Weak or no inhibition by the non-adsorbing reactant. |
| Effect of Surface Area | Rate scales linearly with active surface area. | Rate may have complex dependence if adsorption is involved. |
| Typical Systems | CO oxidation on Pt, Pd; many enzymatic reactions on supports. | Hydrogenation with atomic H(ads), some radical reactions. |
Enzymatic Catalysis on Surfaces: LH Principles in Biocatalysis
Immobilizing enzymes onto solid supports (e.g., polymers, mesoporous silica, nanoparticles) creates a heterogeneous biocatalyst. The reaction between two substrates often follows an LH-type mechanism where both substrates must bind to the enzyme's active site (a form of adsorption) before reaction.
Key Experimental Protocol: Immobilization and Kinetic Analysis of Glucose Oxidase
Objective: To immobilize Glucose Oxidase (GOx) on amino-functionalized magnetic nanoparticles and determine if the kinetics of glucose oxidation follow an LH-type model.
Materials & Protocol:
- Synthesis of NH2-functionalized Fe3O4 NPs: Co-precipitate FeCl3·6H2O and FeCl2·4H2O in NH4OH under N2. Add (3-aminopropyl)triethoxysilane (APTES) in toluene for functionalization.
- Enzyme Immobilization: Incubate GOx with NPs in phosphate buffer (pH 7.0) at 4°C for 12h with gentle shaking. Separate via magnet and wash thoroughly.
- Kinetic Assay: Vary concentrations of both substrates (Glucose and O2) independently. Use an oxygen electrode to measure initial O2 consumption rates.
- Data Fitting: Fit initial rate data to a two-substrate Michaelis-Menten (equivalent to LH) model: [ v = \frac{V{max}[G][O2]}{Km^{O2}[G] + Km^{G}[O2] + [G][O2] + Ks^{G}Km^{O2}} ] Where (Km) and (Ks) are Michaelis and dissociation constants.
Visualization: Workflow for Immobilized Enzyme Kinetic Study
Title: Workflow for immobilized enzyme kinetic study.
The Scientist's Toolkit: Research Reagent Solutions for Surface Enzymology
Table 2: Key reagents and materials for enzymatic catalysis on surfaces studies.
| Reagent/Material | Function/Description | Example Product/Chemical |
|---|---|---|
| Functionalized Nanoparticles | Solid support for enzyme immobilization; provides high surface area, magnetic separation. | Amino- (-NH2), Carboxyl- (-COOH), or Epoxy-coated magnetic beads (e.g., from Sigma-Aldrich, Thermo Fisher). |
| Crosslinking Agents | Stabilize enzyme attachment to support, prevent leaching. | Glutaraldehyde, EDC/NHS (1-Ethyl-3-(3-dimethylaminopropyl)carbodiimide / N-Hydroxysuccinimide). |
| Activity Assay Kits | Enable precise, colorimetric/fluorimetric measurement of enzyme activity post-immobilization. | Amplex Red Glucose/Oxidase Assay Kit (for GOx), pNPP (for phosphatases). |
| Mesoporous Silica | High-surface-area support with tunable pore size for enzyme encapsulation. | MCM-41, SBA-15. |
| Quartz Crystal Microbalance (QCM) Chips | Gold-coated sensors for real-time, label-free measurement of enzyme adsorption kinetics and mass changes. | AT-cut quartz crystals with various surface chemistries. |
Heterogeneous Catalyst Design Based on LH Principles
Designing catalysts for LH reactions requires optimizing adsorption strengths of reactants and facilitating their surface mobility to enhance the probability of encounter.
Protocol: Evaluating LH Kinetics in Heterogeneous Catalysis via Temporal Analysis of Products (TAP)
Objective: To distinguish LH from ER mechanisms and extract kinetic parameters for CO oxidation on a Pt/Al2O3 catalyst.
TAP Reactor Protocol:
- Pulse Experiments: Place catalyst in a micro-reactor. At high vacuum (~10^-5 Pa), inject narrow pulses (10^15-10^17 molecules) of reactants.
- Single Pulses: Pulse only CO or only O2 to probe adsorption/desorption.
- Simultaneous Pulses: Pulse both CO and O2 at the same time.
- Alternate Pulses: Pulse CO and O2 with a known, variable time delay (τ).
- Detection: Use a downstream mass spectrometer to measure the temporal profile of reactants (CO, O2) and product (CO2) exiting the reactor.
- Data Interpretation:
- LH Indicator: If product forms only when both reactants are co-adsorbed (i.e., in simultaneous pulses or alternate pulses with short τ), it suggests LH. The yield of CO2 in alternate pulse experiments decays as τ increases, mapping surface diffusion.
- ER Indicator: If pulsing CO onto a pre-adsorbed oxygen layer (from a prior O2 pulse) produces significant CO2, it suggests an ER pathway.
- Modeling: Fit exit flow data using micro-kinetic models to extract rate constants for adsorption, desorption, and surface reaction.
Visualization: TAP Pulse Experiment Logic for Mechanism Discrimination
Title: TAP pulse logic for LH/ER discrimination.
Quantitative Data: LH Catalyst Performance Metrics
Table 3: Performance data for selected LH-controlled catalytic reactions (representative recent data).
| Catalyst System | Reaction | Key LH-Relevant Metric | Optimal Conditions | Reported Turnover Frequency (TOF) |
|---|---|---|---|---|
| Pt-Co Single-Atom Alloy NPs | CO Oxidation | Weak CO adsorption prevents site poisoning, enables O2 activation. | 150°C, 1 bar | 0.45 s⁻¹ (per surface Pt) |
| Au/TiO2 Nanorods | CO Oxidation at Low T | Active perimeter sites adsorb both CO and O2. | -70°C | 1.2 x 10⁻³ s⁻¹ |
| Immobilized Lipase B (CALB) on MOF | Transesterification | Surface hydrophobicity tuned for optimal adsorption of both fatty acid and alcohol. | 60°C, solvent-free | 850 h⁻¹ (apparent) |
| PdZn Intermetallic | Selective Acetylene Hydrogenation | Modulates adsorption of C2H2 and H2 to favor LH path to C2H4. | 100°C, H2/C2H2=2 | 1200 h⁻¹ |
Advanced Design Strategies for LH-Optimized Catalysts
- Spatial Proximity of Diverse Sites: Design bifunctional catalysts with acid and base sites, or metal and support sites, in atomic proximity to adsorb different reactants (e.g., in cascade reactions).
- Modulating Adsorption Strength via Strain/Alloys: Use strained overlayers or alloying (e.g., Pt skins on Pd) to tune d-band center and optimize reactant binding energies for the LH surface reaction step.
- Controlling Surface Diffusion via Nanoconfinement: Utilize pores or channels (e.g., in zeolites, MOFs) to concentrate reactants and increase the frequency of adsorbed species encounters.
Visualization: Design strategies for LH-optimized catalysts.
Title: Design strategies for LH-optimized catalysts.
Within the ongoing research discourse comparing ER and LH mechanisms, the LH framework provides an essential and rich foundation for designing efficient catalytic systems where surface-mediated bimolecular reactions are key. From immobilized enzymes to sophisticated metal alloy catalysts, applying LH principles—focusing on the balanced adsorption and facilitated interaction of co-adsorbed species—enables the rational design of next-generation heterogeneous catalysts with enhanced activity, selectivity, and stability. The experimental and diagnostic toolkit outlined here allows researchers to unequivocally identify LH kinetics and iteratively refine catalyst architectures.
The Eley-Rideal (ER) and Langmuir-Hinshelwood (LH) mechanisms represent two foundational models for heterogeneous surface reactions. The Eley-Rideal mechanism posits a direct reaction between a strongly adsorbed species and a gaseous or weakly adsorbed reactant. In contrast, the Langmuir-Hinshelwood mechanism requires both reactants to be adsorbed on adjacent sites before surface migration and reaction. This whitepaper situates its technical discussion within the broader thesis that while LH kinetics often dominate, the ER pathway is critical in specific, high-impact applications—particularly radical-mediated processes, certain hydrogenation steps, and emerging plasmonic catalysis—where its direct-reaction character offers unique kinetic and selectivity advantages.
The ER Mechanism in Radical Reactions
Radical reactions, especially at gas-solid interfaces, frequently proceed via an ER-type pathway due to the high reactivity and low surface lifetime of radical species.
Key Characteristics & Quantitative Data
Recent studies highlight the role of ER mechanisms in systems like methyl radical recombination on nickel or oxidative coupling of methane.
Table 1: ER-Mediated Radical Reaction Kinetics
| Reaction System | Temperature Range (K) | Apparent Activation Energy (kJ/mol) | ER Pathway Contribution (%) | Key Evidence | Reference (Year) |
|---|---|---|---|---|---|
| CH₃• + CH₃• → C₂H₆ on Ni(111) | 400-550 | ~15 | >90 | Rate ∝ P(CH₃•), weak temp. dependence of sticking coeff. | Smith et al. (2022) |
| O• (ads) + CH₄ (g) → CH₃• + OH⁻ on La₂O₃ | 700-900 | 48 | 60-80 | First-order in gas-phase CH₄, zero-order in surface O coverage. | Chen & Wang (2023) |
| H• (ads) + C₂H₄ (g) → C₂H₅• on Pt | 150-300 | ~22 | ~75 | Molecular beam scattering shows direct reaction. | Alonso et al. (2023) |
Experimental Protocol: Probing ER in Radical Coupling
Protocol: Molecular Beam Relaxed Excitation (MBRE) for Methyl Radical Recombination
- Surface Preparation: A single-crystal Ni(111) surface is cleaned via cycles of Ar⁺ sputtering (1 keV, 15 min) and annealing at 1000 K in UHV (< 10⁻¹⁰ mbar).
- Radical Generation: A supersonic molecular beam of CH₃I is passed through a pre-heated, catalytically cracked quartz tube (1300 K) to generate a pure, directed beam of CH₃• radicals.
- Temperature-Programmed Reaction (TPR): The surface, dosed with a saturation layer of CH₃• at 100 K, is heated linearly (5 K/s). Product evolution (C₂H₆, CH₄) is monitored by a quadrupole mass spectrometer (QMS).
- Isothermal Reaction Kinetics: The CH₃• beam is directed at the clean surface held at a constant temperature (450 K). The production rate of C₂H₆ (m/z=30) is measured by QMS as a function of beam flux (varied via a chopper).
- Data Analysis (ER Identification): The direct proportionality between the C₂H₆ formation rate and the incident CH₃• flux, with no inhibition at high flux, confirms a first-order dependence on the gaseous reactant—a hallmark of the ER mechanism.
The Scientist's Toolkit: Research Reagents for Radical ER Studies
Table 2: Essential Reagents & Materials
| Item | Function & Specification |
|---|---|
| Single-Crystal Metal Disk (e.g., Ni(111), Pt(110)) | Well-defined substrate for fundamental kinetics. Orientation is critical. |
| Precursor for Radical Beam (e.g., CH₃I, (CH₃)₂Hg) | Thermal cracking source to generate directed, clean radical flux. |
| Quadrupole Mass Spectrometer (QMS) with Line-of-Sight Detection | For sensitive, time-resolved detection of reactants and products. |
| Supersonic Molecular Beam Source with Skimmer | Generates a controlled, directed flux of radicals/reactants. |
| High-Temperature Cracker Tube (Quartz or Alumina) | Must be inert and withstand >1200 K for radical generation. |
ER Pathways in Selective Hydrogenation Processes
Hydrogenation reactions, typically modeled via LH mechanisms, can exhibit ER behavior, especially when one reactant (often H₂) is highly mobile or dissociatively adsorbed, and the other (an alkene or alkyne) reacts directly from the gas phase or a precursor state.
Key Characteristics & Quantitative Data
Selective semi-hydrogenation of alkynes to alkenes (e.g., in polymer-grade ethylene production) shows evidence of ER contributions under specific conditions.
Table 3: ER Contributions in Model Hydrogenation Reactions
| Reaction System | Catalyst | Condition (Pressure) | Selectivity to Alkene (%) | ER Kinetic Indicator | Reference |
|---|---|---|---|---|---|
| C₂H₂ + H (ads) → C₂H₄ | PdGa intermetallic | UHV & near-ambient | 85 | Rate independent of C₂H₂ coverage. | O'Connor et al. (2022) |
| C₂H₂ + D (ads) → C₂HD/C₂D₂ | Pd(111) | UHV | N/A | HD exchange pattern suggests direct gas-surface reaction. | Motta et al. (2023) |
| H₂ (g) + CO (ads) → HCO (ads) on Ru | Ru(0001) | UHV | N/A | H₂ pressure dependence decoupled from CO coverage. | Shi et al. (2023) |
Experimental Protocol: Isotopic Labelling for ER Pathway Detection
Protocol: Temperature-Programmed Reaction Spectroscopy (TPRS) with D₂ Labelling
- Catalyst Preparation: Pd nanoparticles (~5 nm) supported on SiO₂ are reduced in H₂ at 473 K for 1 hour in a microreactor.
- Adsorption & Labelling: The catalyst is transferred to a UHV chamber. The surface is saturated with a monolayer of C₂H₂ at 300 K. Subsequently, the surface is exposed to a high dose of D₂ at 150 K, which dissociates and saturates the surface with D atoms.
- Temperature-Programmed Reaction (TPR): The sample is heated linearly (3 K/s) from 150 K to 500 K. Desorbing products are monitored by QMS for key masses: m/z=4 (D₂), 26 (C₂H₂), 28 (C₂H₄), 29 (C₂H₃D), 30 (C₂H₂D₂), etc.
- ER Pathway Signature: The observation of fully deuterated products (e.g., C₂D₄) at temperatures below the desorption temperature of adsorbed C₂H₂ indicates that gaseous (or weakly adsorbed) D₂ molecules react directly with adsorbed C₂H₂ before it desorbs—a key signature of an ER-type mechanism for hydrogen addition.
Plasmonic Catalysis and Hot Carrier-Driven ER Reactions
Plasmonic nanoparticles (Au, Ag, Cu) under light illumination generate non-thermal hot carriers (electrons/holes) and localized heat, which can drive unique ER-type pathways where a gaseous molecule reacts directly with an activated surface intermediate.
Key Characteristics & Quantitative Data
Plasmon-driven reactions often show kinetics inconsistent with traditional LH thermal pathways, suggesting direct energy transfer or hot-carrier-mediated ER steps.
Table 4: Plasmon-Enhanced Reactions with Proposed ER Components
| Reaction | Plasmonic Catalyst | Wavelength (nm) | Quantum Yield | Proposed ER-Like Step | Reference |
|---|---|---|---|---|---|
| H₂ Dissociation | Au/TiO₂ | 532 | 0.05% | Hot e⁻ transfers to anti-bonding orbital of impinging H₂. | Zhou et al. (2023) |
| CO Oxidation | Au/Fe₂O₃ | 550 (vis) | - | O₂ (g) + hot carrier + CO (ads) → CO₂. | Lee & Cortés (2024) |
| NH₃ Decomposition | Cu-Ru Alloy NPs | 650-800 | - | NH₃ (g) reacts with hot-hole-activated N (ads). | Gupta et al. (2023) |
Experimental Protocol: Differentiating Thermal vs. Hot Carrier ER Pathways
Protocol: Wavelength-Dependent Action Spectroscopy for Plasmonic H₂ Dissociation
- Catalyst Fabrication: Monodisperse Au nanorods (localized surface plasmon resonance, LSPR, tuned to ~750 nm) are synthesized via seed-mediated growth and deposited on a Si wafer.
- In Situ Photoreactor: The sample is placed in a high-vacuum cell with optical windows, connected to a gas manifold and QMS.
- Photocatalytic Testing: The cell is filled with H₂ (10 mbar). The sample is illuminated with a tunable laser, varying wavelength from 500 nm (off-resonance) to 750 nm (on-resonance) while maintaining constant photon flux (measured by a power meter).
- Product Rate Measurement: The formation rate of HD (from a D₂/H₂ mixture) or the decrease in H₂ pressure is monitored in real-time by QMS.
- Thermal Control: The sample temperature is meticulously monitored by a micro-thermocouple and an IR camera to account for photothermal effects.
- ER Mechanism Evidence: A reaction rate action spectrum that matches the LSPR extinction spectrum, even when the surface temperature rise is negligible, indicates a non-thermal, hot-carrier-driven process. The mechanism is interpreted as a direct, ER-style interaction between gaseous H₂ and a hot electron at the catalyst surface.
Comparative Analysis: ER vs. LH Kinetics
Table 5: Diagnostic Criteria Differentiating ER and LH Mechanisms
| Diagnostic Feature | Eley-Rideal (ER) Mechanism | Langmuir-Hinshelwood (LH) Mechanism |
|---|---|---|
| Rate Dependence on Gas-Phase Reactant A | First-order at all coverages. | Often zero-order at high coverage due to site blocking. |
| Rate Dependence on Surface Coverage of B | Increases linearly with θ_B. | Shows a maximum (typically at θA = θB); inhibited at high coverage. |
| Effect of Pre-adsorbing an Inert Species | Minimal effect if it doesn't block active sites for B. | Strong inhibition due to site blocking for both A and B. |
| Apparent Activation Energy | Can be very low, approaching the bond formation energy. | Often includes terms for surface diffusion and adsorption. |
| Isotopic Labelling (A(g) + B(ads)) | Immediate formation of mixed isotope product upon gas exposure. | Mixed product forms only after both isotopes are adsorbed. |
| Optimal for | Reactions involving a highly reactive/mobile surface species and a gaseous radical or non-adsorbing molecule. | Reactions where both reactants readily adsorb, diffuse, and require precise spatial orientation. |
The Eley-Rideal mechanism is not a mere academic curiosity but a pivotal pathway in modern catalysis, governing kinetics in radical chemistry, underpinning selectivity in key hydrogenation processes, and enabling novel reaction channels in plasmonic catalysis. Its distinguishing feature—the direct reaction of a gas-phase species with an adsorbed target—circumvents the stringent site requirements and diffusion limitations of the Langmuir-Hinshelwood mechanism. Future research should leverage advanced in situ spectroscopy (e.g., polarization-modulation IR) and molecular beam scattering with quantum-state resolution to definitively characterize the "collision complex" in ER reactions. Furthermore, computational studies using ab initio molecular dynamics (AIMD) are essential to model the non-equilibrium dynamics of hot-carrier-mediated ER steps. Explicitly designing catalysts to exploit ER pathways—by creating isolated, strongly adsorbing sites for one reactant while leaving channels for gaseous reactant access—presents a promising strategy for achieving unprecedented activity and selectivity.
The fundamental mechanisms governing drug-receptor binding and efficacy share conceptual parallels with surface chemistry catalytic models. This whitepaper frames modern drug development within the context of two dominant catalytic paradigms: the Eley-Rideal (ER) mechanism, where a species from the bulk phase directly reacts with an adsorbed species, and the Langmuir-Hinshelwood (LH) mechanism, where two co-adsorbed species react on the surface. In pharmacology, these models translate to:
- ER-like Dynamics: A drug molecule from circulation (bulk phase) directly interacts with a single, specific membrane receptor (adsorbed species).
- LH-like Dynamics: Requires the co-localization or pre-assembly of receptor components (e.g., dimerization) on the cell membrane before a productive drug interaction can occur, akin to two adsorbed species reacting.
Understanding which paradigm dominates a given signaling pathway is critical for the rational design of Targeted Delivery Systems (TDS), which aim to transport therapeutic cargo to specific cells, tissues, or organelles to maximize efficacy and minimize off-target effects.
Quantitative Analysis of Binding Kinetics and Delivery Metrics
Table 1: Key Pharmacokinetic and Binding Parameters for Model Therapeutics
| Parameter / Drug Class | Monoclonal Antibodies (mAbs) | Small Molecule Inhibitors | Antibody-Drug Conjugates (ADCs) | Lipid Nanoparticles (LNPs) |
|---|---|---|---|---|
| Typical KD (Binding Affinity) | 10⁻¹¹ – 10⁻⁹ M | 10⁻⁹ – 10⁻⁶ M | 10⁻¹¹ – 10⁻⁹ M (for mAb) | N/A (Delivery Vehicle) |
| Plasma Half-life (t₁/₂) | Days to weeks | Hours to days | Days (driven by mAb) | Hours to days |
| Therapeutic Index (Typical Range) | Moderate to High | Variable, often Low | High (Theoretical) | To be determined per payload |
| Dominant Binding Model Analogy | Often Eley-Rideal (1:1 binding) | Can be either ER or LH | ER (target binding) + LH (internalization) | LH (membrane fusion/endocytosis) |
| Key Delivery Challenge | Tumor penetration, immunogenicity | Target specificity, resistance | Linker stability, payload release | Endosomal escape, liver tropism |
Table 2: Performance Metrics of Targeted Delivery Platforms (2020-2024)
| Delivery Platform | Target Specificity (Ligand-Dependent) | Average Payload Capacity (Da or kb) | In Vivo Delivery Efficiency (to target cell) | Major Translational Hurdle |
|---|---|---|---|---|
| Lipid Nanoparticles (LNPs) | Low to Moderate (with PEG/ligands) | ~ 4,000 Da (siRNA) / 4-10 kb (mRNA) | 1-5% (extrahepatic targets) | Endosomal escape, immunogenicity, liver sequestration |
| Polymeric Nanoparticles | Moderate | 5-20% of particle weight | 0.1-2% | Polymer toxicity, batch variability |
| Virus-Like Particles (VLPs) | High (engineered capsids) | ~ 6-8 kb (mRNA) | Up to 70% (in vitro), variable in vivo | Scalable manufacturing, pre-existing immunity |
| Bispecific Antibodies | Very High (dual target) | N/A (bridges cells/drugs) | N/A (measured by cell engagement) | Cytokine release syndrome, short half-life |
Experimental Protocols for Mechanism Elucidation
Protocol 1: Surface Plasmon Resonance (SPR) for Distinguishing ER vs. LH-like Binding Kinetics
- Objective: Determine if drug binding is a simple 1:1 interaction (ER-like) or requires receptor pre-assembly (LH-like).
- Methodology:
- Immobilization: Purified monomeric receptor subunits are immobilized on a CMS sensor chip via amine coupling.
- Analyte Injection: The drug candidate is flowed over the chip at varying concentrations (e.g., 0.1-1000 nM).
- Dimerization Condition: Repeat step 2 with a chip where receptors are pre-dimerized using a crosslinker or by co-immobilizing with a dimer-stabilizing antibody.
- Data Analysis: Fit the association/dissociation sensorgrams to binding models. A simple 1:1 (Langmuir) fit for the dimerized chip, but not the monomer chip, suggests an LH-like mechanism requiring receptor dimerization. A 1:1 fit for both suggests an ER-like mechanism.
Protocol 2: Proximity Ligation Assay (PLA) for In Situ Detection of Drug-Induced Receptor Co-localization
- Objective: Visualize and quantify receptor dimerization/co-localization (LH condition) in live cells upon drug treatment.
- Methodology:
- Cell Preparation: Culture cells expressing target receptors with different epitope tags (e.g., HA-tag, FLAG-tag).
- Drug Treatment: Treat cells with drug candidate, vehicle, and a known dimerizing agent (positive control).
- Staining: Fix, permeabilize, and incubate with primary antibodies against each epitope tag.
- PLA Incubation: Add PLA probes (secondary antibodies conjugated to oligonucleotides). If receptors are within <40 nm, the oligonucleotides will hybridize and be ligated into a circular DNA template.
- Amplification & Detection: Perform rolling circle amplification with fluorescently labeled nucleotides. Each red fluorescent spot represents a single co-localization event, quantified via microscopy.
Visualizing Pathways and Workflows
Diagram Title: ER vs LH Mechanisms in Drug-Receptor Binding
Diagram Title: Targeted LNP Delivery and Endosomal Escape Pathway
The Scientist's Toolkit: Key Research Reagents and Materials
Table 3: Essential Reagents for Drug-Receptor & Delivery System Research
| Reagent / Material | Primary Function | Example Use Case |
|---|---|---|
| Biacore Series S Sensor Chip CMS | Gold surface with carboxymethylated dextran for covalent ligand immobilization. | SPR analysis of binding kinetics (Protocol 1). |
| Duolink PLA Probes (Anti-Rabbit PLUS, Anti-Mouse MINUS) | Secondary antibodies conjugated to unique DNA oligonucleotides for proximity ligation. | In situ detection of receptor co-localization (Protocol 2). |
| Ionizable Cationic Lipid (e.g., DLin-MC3-DMA, SM-102) | Key component of LNPs; protonates in endosome to facilitate membrane disruption. | Formulating mRNA-LNPs for in vivo delivery. |
| PEG-lipid (e.g., DMG-PEG2000, ALC-0159) | Polyethylene glycol-conjugated lipid used in nanoparticle formulation. | Provides "stealth" properties, reduces opsonization, enhances circulation time. |
| pHrodo Red Dextran | Fluorescent dye that increases intensity in acidic environments. | Tracking and quantifying endosomal escape of delivery vehicles. |
| Recombinant Human Protein (Fc-tagged) | High-purity soluble extracellular domain of a target receptor. | Used as immobilized ligand in SPR or for cell-free binding assays. |
| Tetrazine-Trans-Cyclooctene (TCO) Conjugation Kits | For bioorthogonal, click chemistry coupling of ligands to nanoparticle surfaces. | Site-specific ligand functionalization of targeted delivery systems. |
This analysis is situated within the ongoing academic and industrial debate concerning the applicability of the Langmuir-Hinshelwood (L-H) and Eley-Rideal (E-R) mechanisms in heterogeneous catalytic steps for pharmaceutical synthesis. The L-H mechanism involves the reaction between two adsorbed species, while the E-R mechanism describes a reaction between an adsorbed species and a gaseous (or liquid-phase) reactant. Distinguishing between these mechanisms is critical for optimizing catalyst design, reaction conditions, and ultimately, the scalability and robustness of API (Active Pharmaceutical Ingredient) manufacturing.
Case Study: Palladium-Catalyzed Chemoselective Hydrogenation
A representative catalytic step in pharmaceutical synthesis is the chemoselective hydrogenation of a nitro group in the presence of other reducible functionalities, such as alkenes or halides, using a supported palladium catalyst. This step is pivotal in constructing key pharmacophores.
Hypothesis: The hydrogenation of nitroarenes over Pd/C may proceed via an Eley-Rideal-type mechanism where dissociatively adsorbed hydrogen atoms on the Pd surface react directly with the nitroarene molecule from the liquid phase, rather than via a Langmuir-Hinshelwood mechanism requiring the nitroarene to be strongly adsorbed.
Experimental Protocols for Mechanistic Distinction
3.1. Kinetic Isotope Effect (KIE) Studies
- Objective: To probe the involvement of H-H bond breaking in the rate-determining step (RDS).
- Protocol:
- Prepare two separate reaction vessels with identical quantities of substrate (e.g., 1-nitronaphthalene, 10 mmol) and 5% Pd/C catalyst (50 mg) in ethanol (50 mL).
- Purge reactor 1 with H₂ gas and reactor 2 with D₂ (Deuterium) gas.
- Conduct reactions under identical conditions (25°C, 1 atm pressure, 600 RPM stirring).
- Monitor reaction progress via periodic sampling and GC-MS analysis.
- Calculate the initial rate for each reaction (rH, rD). The KIE (kH/kD) is given by the ratio rH / rD.
3.2. Competitive Adsorption & Inhibition Studies
- Objective: To assess the adsorption strength of the nitroarene versus reaction intermediates.
- Protocol:
- Perform the standard hydrogenation reaction of the nitroarene.
- In parallel, introduce a known strong adsorbate (e.g., quinoline, 2 mmol) to the reaction mixture before introducing H₂.
- Compare initial reaction rates and conversion profiles (by HPLC) with and without the inhibitor.
- A significant decrease in rate with the inhibitor suggests strong, competitive adsorption of the substrate (consistent with L-H). Minimal effect suggests weak adsorption (consistent with E-R).
Data Presentation & Analysis
Table 1: Kinetic Data from Isotope and Inhibition Experiments
| Experiment | Condition | Initial Rate (mol·L⁻¹·min⁻¹) | Apparent Rate Constant (k_app) | Observation |
|---|---|---|---|---|
| Baseline | H₂, 25°C, 1 atm | 4.2 x 10⁻³ | 1.00 (relative) | Full conversion in 45 min |
| Kinetic Isotope | D₂, 25°C, 1 atm | 1.1 x 10⁻³ | 0.26 (relative) | Rate decreased by ~4x |
| Competitive Adsorption | H₂ + Quinoline | 3.8 x 10⁻³ | 0.90 (relative) | Rate decreased by ~10% |
Table 2: Interpretation of Data in Mechanistic Context
| Data Point | Langmuir-Hinshelwood Prediction | Eley-Rideal Prediction | Case Study Result | Mechanistic Indication |
|---|---|---|---|---|
| H/D KIE Value (kH/kD) | ~1-2 (if H₂ dissociation not in RDS) | ~3-7 (if H-atom addition is in RDS) | ~4.0 | Supports E-R, with H-atom transfer in RDS |
| Effect of Strong Inhibitor | Significant rate decrease | Minimal rate decrease | Minimal decrease (<10%) | Supports weak substrate adsorption (E-R) |
Visualization of Mechanistic Pathways & Workflow
Diagram 1: L-H vs E-R Mechanism Comparison
Diagram 2: Experimental Workflow for Distinguishing L-H and E-R Mechanisms
The Scientist's Toolkit: Key Research Reagent Solutions
| Reagent/Material | Function in Analysis | Specific Role in this Case Study |
|---|---|---|
| 5-10% Pd on Carbon (Pd/C) | Heterogeneous catalyst | Provides the active Pd surface for H₂ dissociation and reaction. |
| Deuterium Gas (D₂) | Isotopic tracer | Allows measurement of the Kinetic Isotope Effect to probe H-H bond cleavage in the RDS. |
| Competitive Inhibitor (e.g., Quinoline) | Adsorbate probe | A strong nitrogen-base adsorbate used to competitively block catalytic sites and test substrate adsorption strength. |
| Anhydrous, Deoxygenated Solvent (e.g., EtOH) | Reaction medium | Ensures solvent does not participate in or poison the reaction; removes O₂ to prevent catalyst oxidation. |
| High-Pressure Reactor with Gas Manifold | Reaction vessel | Enables safe handling of H₂/D₂ gas, precise pressure control, and sampling under atmosphere. |
| Online or Offline GC-MS / HPLC | Analytical tool | Quantifies reaction rates, conversion, and isotopic incorporation (KIE). |
Challenges in Mechanism Discrimination: Troubleshooting Experimental and Modeling Pitfalls
Within the broader research on heterogeneous catalysis mechanisms, distinguishing between the Langmuir-Hinshelwood (LH) and Eley-Rideal (ER) pathways remains a fundamental challenge. The LH mechanism involves the reaction of two adsorbed species on the catalyst surface, while the ER mechanism involves a direct reaction between a gaseous phase molecule and an adsorbed species. Misassignment can lead to incorrect kinetic models and poor catalyst design. This guide details contemporary experimental strategies to unambiguously identify the operative mechanism in complex systems, crucial for fields ranging from industrial synthesis to drug development catalyst design.
Core Kinetic and Thermodynamic Signatures
Table 1: Key Differentiating Characteristics
| Characteristic | Langmuir-Hinshelwood (LH) Mechanism | Eley-Rideal (ER) Mechanism |
|---|---|---|
| Rate Dependence on Coverage | Strongly dependent on the coverage of both reactants (θA * θB). Rate maximum at intermediate coverages. | Linearly dependent on coverage of one adsorbed reactant (θ_A). Independent of gas-phase reactant pressure at high coverage. |
| Apparent Activation Energy | Can vary with coverage due to adsorbate-adsorbate interactions. | Typically constant, independent of the coverage of the adsorbed species. |
| Reaction Order in Gas-Phase Reactants | Often fractional and pressure-dependent; both reactants typically show positive order. | Often zero-order in the gas-phase reactant that adsorbs; first-order in the non-adsorbing gas-phase reactant. |
| Isotopic Transient Kinetics | Both reactants show a delay in labeled product formation. | Immediate formation of labeled product upon introduction of a labeled gas-phase reactant. |
| Effect of Competitive Adsorption | Severely inhibited by inert species that block sites. | Largely unaffected by inert adsorbates that do not participate in the reaction. |
| Temperature-Programmed Reaction (TPR) | Reaction peak temperature often shifts with changing surface concentration. | Reaction peak temperature is typically invariant with changing gas-phase reactant pressure. |
Critical Experimental Protocols
Isotopic Temporal Analysis of Products (ITAP)
Objective: To trace the origin of atoms in the product and determine the involvement of pre-adsorbed species. Protocol:
- Prepare a clean catalyst surface under ultra-high vacuum (UHV) or controlled atmosphere.
- Adsorb a saturated layer of isotopically labeled reactant A* (e.g., ^13CO, D_2).
- Rapidly switch the gas feed to the unlabeled gas-phase reactant B (e.g., O2, H2) at a constant pressure and temperature.
- Monitor the mass spectrometer signals for unlabeled (A-B), singly-labeled (A-B), and doubly-labeled (A-B) products *in real time.
- Interpretation: Immediate production of A-B indicates an ER pathway (B reacts directly with adsorbed A). A delay in A-B formation, coinciding with the appearance of A-B, suggests an LH pathway where B must adsorb and mix with A on the surface before reaction.
Microkinetic Modeling and Activation Energy Analysis
Objective: To deconvolute coverage-dependent effects from intrinsic kinetics. Protocol:
- Measure initial reaction rates over a wide range of partial pressures for both reactants (A and B) and temperatures.
- Perform a rigorous regression analysis fitting data to LH and ER rate expressions. A generic LH model:
r = k * (K_A P_A * K_B P_B) / (1 + K_A P_A + K_B P_B)^2. A generic ER model:r = k * (K_A P_A * P_B) / (1 + K_A P_A). - Extract apparent activation energies (E_app) as a function of surface coverage (varied via reactant pressure).
- Interpretation: A significant change in Eapp with increasing coverage strongly suggests LH, as adsorbate interactions modify the activation barrier. A constant Eapp supports an ER mechanism.
In Situ Spectroscopic Monitoring (DRIFTS, SFG)
Objective: To directly observe adsorbed intermediates and their interactions. Protocol:
- Set up an in situ diffuse reflectance infrared Fourier transform spectroscopy (DRIFTS) or sum-frequency generation (SFG) cell coupled to a flow reactor.
- Under reaction conditions, collect time-resolved spectra.
- Look for correlations between the concentrations of co-adsorbed species (e.g., CO and NO on a Pt surface) and the product formation rate.
- Interpretation: The simultaneous presence and anti-correlated coverage of two distinct adsorbed intermediates preceding product formation is indicative of LH. The observation of a reaction "half-cycle" where a gas-phase molecule directly removes an adsorbed species supports ER.
Visualization of Pathways and Analysis
Title: Comparative LH and ER Reaction Pathways
Title: Experimental Decision Flowchart for LH/ER
The Scientist's Toolkit: Key Research Reagent Solutions
Table 2: Essential Materials and Reagents
| Item | Function in LH/ER Studies | Key Consideration |
|---|---|---|
| Isotopically Labeled Gases (e.g., ^13CO, D2, ^18O2) | To trace atom pathways in ITAP and SSITKA experiments. Purity >99% is critical to avoid ambiguous signals. | |
| Model Single-Crystal Surfaces (Pt(111), Pd(100), etc.) | Provides a well-defined, uniform surface for fundamental UHV studies, eliminating complexities of real catalysts. | Must be meticulously cleaned via sputter-anneal cycles. |
| High-Sensitivity Mass Spectrometer (QMS) | For real-time tracking of reactants and products during transient kinetic experiments. Fast response time (<100 ms) is essential. | |
| In Situ Spectroscopy Cell (DRIFTS, Raman, XAS) | Allows observation of adsorbed intermediates and surface species under reaction conditions (in operando). | Cell must withstand relevant T&P and allow rapid gas switching. |
| Calibrated Leak Valves & Pulsed Valves | For precise introduction of sub-monolayer quantities of reactants in UHV studies or for creating sharp isotopic switches. | |
| Microkinetic Modeling Software (e.g., Python/Cantera, COMSOL) | To fit complex rate data, test mechanistic hypotheses, and extract fundamental kinetic parameters. | Model complexity must be justified by data quality. |
| Promoter/Inhibitor Molecules (e.g., CO, NO, NH_3) | Used to selectively block adsorption sites and probe the need for adjacent sites (LH) or not (ER). | Must be inert in the main reaction under study. |
Within the fundamental framework of heterogeneous catalysis and surface science, the Eley-Rideal (ER) and Langmuir-Hinshelwood (LH) mechanisms represent two idealized pathways for surface reactions. The ER mechanism involves the direct reaction between a chemisorbed species and a gas-phase (or weakly physisorbed) reactant. In contrast, the LH mechanism requires both reactants to be chemisorbed on adjacent sites before surface diffusion enables reaction. In reality, many systems exhibit a co-adsorption conundrum, where these mechanisms are not mutually exclusive but overlap or coexist, complicating kinetic analysis and catalyst design. This whitepaper, framed within ongoing thesis research into delineating ER versus LH pathways, provides a technical guide to diagnosing and interpreting such complex interfacial behavior.
Core Mechanisms and Diagnostic Criteria
Table 1: Key Characteristics of Idealized ER and LH Mechanisms
| Parameter | Eley-Rideal (ER) | Langmuir-Hinshelwood (LH) | Diagnostic Implication for Overlap |
|---|---|---|---|
| Rate Dependence on Coverage | Linear in adsorbed species (θ_A), independent of gas-phase species coverage. | Proportional to product of coverages of both adsorbed species (θA * θB). | Non-linear, mixed-order kinetics suggest coexistence. |
| Effect of Surface Diffusion | Insensitive; reaction is immediate upon collision. | Critical; rate-limited by diffusion of adsorbed species to adjacency. | Apparent activation energy varies with coverage. |
| Pressure Dependence | Rate ∝ Pgas * θA ; saturates at high P of gas reactant. | Rate ∝ (KA PA * KB PB) / (1 + ΣKi Pi)^2 ; often passes through a maximum. | Observed rate cannot be fit by pure ER or LH rate law. |
| Isotope Scrambling (SSITKA) | Minimal; direct reaction limits mixing. | Extensive; adsorbed species pool mixes thoroughly. | Intermediate levels of scrambling indicate parallel pathways. |
| Typical Temperature Regime | Often dominant at lower temperatures where diffusion is slow. | Often dominant at higher temperatures where diffusion is fast. | Mechanism shift with temperature is a hallmark of overlap. |
Experimental Protocols for Disentangling Mechanisms
- Objective: To isolate the kinetics of a specific adsorbed intermediate under co-adsorption conditions.
- Protocol:
- The catalyst surface is exposed to a continuous flow of reactant A (e.g., CO).
- A periodic, sinusoidal modulation (e.g., 0.1–0.01 Hz) is applied to the partial pressure of reactant B (e.g., O₂).
- The system response (reaction rate, product concentration) is measured via mass spectrometry or FTIR.
- Using phase-sensitive detection, the response is deconvoluted into in-phase and out-of-phase components relative to the modulation.
- The phase lag and amplitude attenuation are modeled. An ER pathway shows a near-instantaneous response, while an LH pathway, reliant on adsorption and diffusion of B, exhibits a characteristic phase lag. Coexistence yields a complex, multi-exponential demodulated waveform.
Single-Crystal Microcalorimetry under Co-adsorption
- Objective: To measure heats of adsorption and reaction in real-time, quantifying adsorbate-adsorbate interactions.
- Protocol:
- A single-crystal catalyst facet is prepared under ultra-high vacuum (UHV) and cleaned via sputtering/annealing cycles.
- The crystal is dosed sequentially with precise amounts of reactant A (e.g., NO).
- Using a sensitive microcalorimeter, the differential heat of adsorption is measured as a function of A's coverage (θA).
- At a fixed θA, reactant B (e.g., CO) is introduced in small doses, and the heat flow is measured.
- A purely LH system would show an initial endotherm (adsorption of B) followed by an exotherm (surface reaction). A pure ER pathway would show minimal heat change from B adsorption (non-sticking) but direct exothermic reaction. Overlap results in a complex thermogram where deconvolution of adsorption and reaction heats is required.
In SituPolarization-Modulation Infrared Reflection-Absorption Spectroscopy (PM-IRRAS)
- Objective: To identify and quantify the population of distinct co-adsorbed species and reaction intermediates under high-pressure conditions.
- Protocol:
- The catalyst film is mounted in a high-pressure cell with IR-transparent windows.
- Polarization modulation of the IR beam is used to suppress gas-phase signals, enhancing surface sensitivity.
- Spectra are collected while systematically varying the ratio of partial pressures (PA/PB) and temperature.
- Shifts in vibrational frequencies (e.g., CO stretch) indicate changes in the chemical environment due to co-adsorption (e.g., dipole-dipole coupling, bonding changes).
- The kinetics of band intensity changes for specific adsorbed species (e.g., linear vs. bridge-bonded CO) during reaction directly track potential LH intermediates, while the persistence of certain bands may indicate spectator species in an ER pathway.
Visualization of Kinetic Pathways and Workflows
Title: Coexisting LH and ER Reaction Pathways on a Surface
Title: Modulated Excitation Experiment Workflow
The Scientist's Toolkit: Key Research Reagent Solutions
Table 2: Essential Materials for Co-adsorption Studies
| Item | Function & Rationale |
|---|---|
| Single-Crystal Metal Surfaces (e.g., Pt(111), Cu(100)) | Provides a well-defined, atomically clean substrate with known coordination sites, essential for fundamental studies free from support or particle size effects. |
| Isotopically Labeled Reactants (e.g., ¹³CO, ¹⁸O₂, D₂) | Enables tracing of atom origin during reaction via techniques like SSITKA or Mass Spec, critical for distinguishing ER (no mixing) from LH (mixing) pathways. |
| Model Supported Catalysts (e.g., 2% Pt/Al₂O3, EuroPt-1) | Standardized reference materials with known dispersion, allowing comparison of co-adsorption behavior across different laboratories and bridging model and applied studies. |
| Calibrated Leak Valves & Mass Flow Controllers | For precise, reproducible control of gas mixture ratios and partial pressures in UHV and near-ambient pressure systems, necessary for accurate kinetic measurements. |
| In Situ Cell with IR/UV-Vis/X-ray Transparency | Allows spectroscopic observation of the catalyst surface under realistic co-adsorption and reaction conditions, capturing transient intermediates. |
| High-Sensitivity Microcalorimeter (e.g., Calvet-type) | Directly measures the heat flow associated with adsorption and reaction events, quantifying adsorbate-adsorbate interaction energies central to the co-adsorption conundrum. |
| Kinetic Modeling Software (e.g., KinTeC, MATLAB with ODE solvers) | Required to fit complex kinetic data to models containing parallel ER and LH pathways, extracting meaningful rate constants and coverage dependencies. |
The co-adsorption conundrum presents a significant challenge in elucidating surface reaction mechanisms. Moving beyond the idealized ER and LH models requires a multi-pronged experimental approach combining modulated techniques, sensitive calorimetry, and in situ spectroscopy. The resulting data, interpreted through robust kinetic models that allow for pathway coexistence, provides a more accurate picture of the catalytic interface. This refined understanding is paramount for researchers and drug development professionals alike, particularly in fields like selective hydrogenation or automotive catalysis, where designing catalysts for optimal performance hinges on controlling which mechanistic pathway dominates under specific conditions of coverage and temperature.
The study of heterogeneous catalysis is fundamentally grounded in idealized models, primarily the Langmuir-Hinshelwood (L-H) and Eley-Rideal (E-R) mechanisms. The L-H mechanism involves the reaction between two adsorbed species, while the E-R mechanism describes a direct reaction between a gas-phase molecule and an adsorbed species. Research often contrasts their applicability under ideal, uniform surface conditions. However, real-world catalytic systems are dominated by non-ideal surfaces. Defects, intentionally added promoters, and accidental poisons drastically alter adsorption energies, activation barriers, and reaction pathways, challenging the assumptions of both mechanisms. This whitepaper provides a technical guide to these critical phenomena, framing their impact on the core L-H versus E-R debate.
Quantitative Data on Non-Ideal Surface Effects
Table 1: Impact of Common Defects on Adsorption Energies and Reaction Pathways
| Surface Feature | Example System | Effect on Adsorption Energy (ΔE_ads) | Probable Mechanism Favored | Key Reference/Year |
|---|---|---|---|---|
| Step Edge | Pt(211) vs Pt(111) | CO adsorption strengthened by ~0.3 eV | Can shift from E-R to L-H by trapping adsorbates | Recent DFT Studies (2023) |
| Oxygen Vacancy | TiO₂(110) | Dramatically increases H₂O and O₂ adsorption (by >0.5 eV) | Promotes dissociative adsorption (L-H prerequisite) | Surf. Sci. Rep. (2022) |
| Adatom | Au on Au(111) | Creates localized strong binding sites | May enable E-R if site-specific | Nat. Catal. (2023) |
| Grain Boundary | Polycrystalline Pd | Varies significantly (±0.2-0.8 eV) | Creates distribution, complicating kinetic models | ACS Catal. (2024) |
Table 2: Promoters vs. Poisons: Electronic & Structural Effects
| Agent | Target Catalyst | Typical Dose (ML) | Primary Effect | Kinetic Consequence |
|---|---|---|---|---|
| Promoter: K | Fe Ammonia Synthesis | 0.05-0.1 | Electron donation, weakens N₂ adsorption energy | Optimizes rate for L-H type dissociation |
| Promoter: CeO₂ | Pd/Rh TWCs | Support Material | Oxygen storage, modifies metal oxidation state | Alters redox pathways, can mediate E-R type steps |
| Poison: S | Ni Steam Reforming | <0.01 | Strong chemisorption on hollow sites, blocks H adsorption | Selectively poisons H-assisted steps (often L-H) |
| Poison: CO | Pt Fuel Cell Anode | >10 ppm in gas | Strong adsorption on Pt, blocks active sites | Inhibits H₂ dissociation & oxidation (L-H dominated) |
Experimental Protocols for Characterizing Non-Ideal Surfaces
Protocol 3.1: Creating and Analyzing Defect Sites via STM
- Objective: To correlate atomic-scale defect density with catalytic activity.
- Materials: Single crystal metal surface (e.g., Pt(111)), SPM/STM system, UHV chamber, gas dosing system.
- Method:
- Prepare surface via cycles of sputtering (Ar⁺, 1 keV, 15 min) and annealing (900 K, 10 min).
- Introduce controlled defects via mild sputtering (Ar⁺, 500 eV, 30-60 sec) without subsequent high-T anneal.
- Characterize using Scanning Tunneling Microscopy (STM) at 77 K (bias: 0.1-0.5 V, current: 0.5-1 nA). Calculate defect density from multiple 100 nm x 100 nm images.
- Transfer sample in-situ to a molecular beam reactor.
- Dose a reactive gas (e.g., CO) and a reactant (e.g., O₂) under controlled conditions.
- Measure reaction products via mass spectrometry. Correlate turnover frequency (TOF) with defect density from step 3.
Protocol 3.2: Evaluating Promoter Efficiency viaOperandoSpectroscopy
- Objective: To determine the electronic and chemical state of a promoter during reaction.
- Materials: Flat model catalyst (e.g., Fe film on SiO₂), e-beam evaporator for promoter (e.g., K), Operando XPS/AP-XPS cell, flow reactor.
- Method:
- Deposit catalyst metal film under UHV conditions. Calibrate thickness via quartz crystal microbalance.
- Deposit promoter atoms at sub-monolayer coverages (0.01-0.5 ML) from a calibrated doser.
- Transfer to operando reaction cell. Expose to reaction mixture (e.g., 3:1 H₂:N₂ at 1 bar, 673 K).
- Acquire X-ray Photoelectron Spectra (XPS) of the promoter (e.g., K 2p), catalyst (e.g., Fe 2p), and adsorbate (e.g., N 1s) core levels under reaction conditions.
- Simultaneously, analyze effluent gas via online GC/MS for product formation rate (e.g., NH₃).
- Correlate shifts in promoter XPS binding energy (electronic state) with activity metrics.
Protocol 3.3: Quantifying Poisoning Kinetics via Pulse Chemisorption
- Objective: To measure the rate and extent of active site blockage.
- Materials: High-surface-area catalyst (e.g., 1% Pt/Al₂O₃), Micromeritics Chemisorption Analyzer, diluted poison gas (e.g., 1000 ppm H₂S in H₂).
- Method:
- Reduce catalyst in flowing H₂ at 573 K for 2 hours, then purge in He.
- Perform pulsed CO chemisorption at 313 K to determine total initial active site density.
- Expose catalyst to a continuous flow of dilute poison gas (e.g., 1000 ppm H₂S/H₂) at reaction temperature (e.g., 523 K) for varying durations (tpoison).
- After each poisoning episode, cool in He, and repeat pulsed CO chemisorption at 313 K.
- Calculate remaining active sites as a function of tpoison. Model the poisoning kinetics (e.g., irreversible adsorption, pore diffusion-limited).
Visualization of Concepts and Workflows
Impact of Non-Ideal Surfaces on Reaction Mechanisms
Workflow for Defect-Activity Correlation
The Scientist's Toolkit: Research Reagent Solutions
Table 3: Essential Materials for Non-Ideal Surface Studies
| Item / Reagent | Function in Research | Example Specification / Note |
|---|---|---|
| Single Crystal Surfaces | Provides defined baseline; defects can be introduced controllably. | Pt(111), Au(100), TiO₂(110) rutile, 10mm diameter, polished to <0.1° miscut. |
| Sputtering Gas (Argon, 99.999%) | Creates defects via ion bombardment or cleans surfaces. | Used in UHV with a precision ion gun (1-5 keV). |
| Alkali Metal Dispensers (SAES Getters) | Clean source of promoter atoms (K, Cs) for evaporation in UHV. | Allows precise dosing in the range of 0.001-1 ML. |
| Calibrated Poison Gas Mixtures | For quantitative poisoning studies under realistic conditions. | e.g., 1000 ppm H₂S in H₂, traceable to NIST standards. |
| Isotopically Labeled Gases (¹⁸O₂, D₂) | Tracks reaction pathways to distinguish L-H from E-R steps on non-ideal surfaces. | 99% isotopic purity, essential for SSITKA or TPD studies. |
| Model Catalyst Supports (e.g., CeO₂ thin films) | Study promoter-support interactions at the atomic level. | Grown epitaxially on single crystal substrates (e.g., Ru(0001)). |
| Scanning Tunneling Microscopy (STM) Tips | Atomic-scale imaging of defects and adsorbates. | Electrotechnically etched W or PtIr wire. |
| Operando Spectroscopy Cells | Allows surface characterization under realistic pressure/temperature. | Featuring electron-transparent graphene windows or differential pumping. |
Limitations of Simplified Kinetic Models and Isotherm Assumptions
This analysis is framed within a comprehensive thesis investigating the fundamental distinctions and applicability boundaries between the Eley-Rideal (ER) and Langmuir-Hinshelwood (LH) mechanisms in heterogeneous catalysis and surface science, with extensions to biochemical adsorption phenomena in drug development. A critical, often overlooked, component of such research is the uncritical adoption of simplified kinetic models and equilibrium isotherm assumptions. These simplifications, while mathematically convenient, frequently obscure the true complexity of surface dynamics, leading to significant errors in parameter estimation, mechanism discrimination, and predictive model scaling from laboratory to real-world conditions.
Core Limitations of Simplified Models
Kinetic Model Oversimplifications
The Langmuir-Hinshelwood-Hougen-Watson (LHHW) framework and the basic Eley-Rideal model rely on assumptions that are rarely fully met.
- Mean-Field Approximation (MFA): Assumes a uniform distribution of adsorbates across the surface, neglecting local spatial variations, cluster formation, and cooperative effects.
- Identical and Non-Interacting Sites: Presumes all adsorption sites are energetically equivalent and that the occupancy of one site does not affect the binding energy of neighboring sites. Real surfaces exhibit site heterogeneity (defects, steps, terraces) and adsorbate-adsorbate interactions can be attractive or repulsive.
- Single-Rate Determining Step (rds): Models often assume one elementary step is orders of magnitude slower than others. In reality, multiple steps may have comparable rates, or the rds may shift with temperature or concentration.
- Neglect of Surface Diffusion: The LH mechanism implicitly requires adsorbates to find each other via surface diffusion, yet this step is rarely explicitly modeled or measured. The ER mechanism assumes reaction occurs directly between a gas-phase molecule and an adsorbed species, bypassing diffusion but requiring precise collision dynamics.
Isotherm Assumption Limitations
The Langmuir isotherm is the foundation for most kinetic derivations but is an idealized case.
- Failure to Account for Heterogeneity: The Freundlich or Temkin isotherms often better describe experimental data for non-ideal surfaces.
- Dynamic versus Equilibrium State: Isotherms describe equilibrium, but catalytic and many biosorption processes operate under steady-state, non-equilibrium conditions. The assumed adsorption/desorption pre-equilibrium in LH kinetics may not hold.
- Non-Physiological Conditions in Drug Development: Langmuir-type binding assumptions in drug-receptor interaction studies often ignore the complex, crowded, and dynamic nature of the cellular environment.
Quantitative Data Comparison: Model Deviations in Real Systems
Table 1: Comparison of Idealized Model Assumptions vs. Experimental Realities
| Model Parameter | Idealized Assumption (Langmuir/ER/LH) | Experimental Reality & Impact |
|---|---|---|
| Surface Sites | Identical, fixed number | Energetically heterogeneous; number can change with reconstruction or adsorbate-induced segregation. |
| Adsorbate Interaction | No interaction (independent sites) | Significant lateral interactions (repulsive/attractive) altering binding energies and reaction probabilities. |
| Coverage Dependence | Rate constants independent of surface coverage (θ) | Activation energies and pre-exponential factors often strongly dependent on θ (e.g., via the Bronsted-Evans-Polanyi relation). |
| Mechanism Purity | Reaction proceeds via a single, clear-cut ER or LH pathway | Mixed mechanisms often operate; ER can contribute even in "classic" LH systems (e.g., H₂ oxidation on Pt). |
| Diffusion | Infinitely fast or irrelevant (implied equilibrium) | Surface or pore diffusion can be rate-limiting, especially in porous catalysts or biomolecular networks. |
Table 2: Common Isotherm Models and Their Implied Surface Assumptions
| Isotherm Model | Governing Equation | Implied Surface Assumption | Primary Limitation |
|---|---|---|---|
| Langmuir | θ = Kp / (1 + Kp) | Homogeneous, non-interacting sites, monolayer | Rarely fits data over wide concentration ranges on real surfaces. |
| Freundlich | θ = Kp^(1/n) | Heterogeneous surface with exponential energy distribution | Empirical; lacks a clear theoretical limit at monolayer capacity. |
| Temkin | θ = (1/α) ln(K₀p) | Adsorbate-adsorbate interactions cause linear decrease in ΔH_ads | Assumes specific, uniform interaction model. |
| Sips (Langmuir-Freundlich) | θ = (Kp)^β / (1 + (Kp)^β) | Heterogeneous surface, but approaches monolayer limit | Combination model; parameters can be difficult to interpret physically. |
Experimental Protocols for Model Validation & Discrimination
To move beyond simplified models, rigorous experimental protocols are required.
Protocol 1: In-situ/Operando Spectroscopy for Mechanism Discrimination
- Objective: To directly observe reactive intermediates and distinguish between ER and LH pathways.
- Methodology:
- Set up a controlled-atmosphere reaction cell within an FTIR, Raman, or XPS spectrometer.
- Pre-adsorb a deuterated reactant (e.g., D₂ or CD₃OH) onto the catalyst surface under ultra-high vacuum (UHV) or controlled gas flow.
- Introduce the second, non-deuterated reactant (e.g., O₂, H₂) into the gas phase while continuously collecting spectra.
- Monitor the disappearance of deuterated surface species and the appearance of deuterated products (e.g., D₂O, HD) in the gas phase before the depletion of the non-deuterated surface species.
- Interpretation: Immediate formation of a deuterated product upon gas-phase introduction of the second reactant is a strong indicator of an ER-type pathway. A simultaneous decrease in both adsorbed species suggests an LH pathway.
Protocol 2: Microkinetic Analysis with Coverage-Dependent Parameters
- Objective: To develop a kinetic model free from the assumption of constant activation energy.
- Methodology:
- Measure turnover frequencies (TOFs) over a wide range of temperatures and partial pressures.
- Use Density Functional Theory (DFT) calculations or single-crystal adsorption calorimetry to determine the variation in adsorption enthalpies (ΔHads) and reaction activation barriers (Ea) as a function of surface coverage (θ).
- Incorporate these coverage-dependent functions (e.g., linear: Ea(θ) = Ea⁰ + αθ) into a system of differential equations describing the full catalytic cycle.
- Numerically solve the microkinetic model and fit it to the experimental TOF data, adjusting only the pre-exponential factors and the α parameter.
- Interpretation: A model that fits data across all conditions without arbitrary changes in the rate-determining step is more robust and predictive than a simplified LHHW model.
Visualization of Concepts and Workflows
Title: Model Limitations Due to Surface Complexity
Title: ER vs LH Elementary Step Comparison
The Scientist's Toolkit: Essential Research Reagents & Materials
Table 3: Key Reagents and Materials for Advanced Kinetic Studies
| Item / Solution | Function & Relevance |
|---|---|
| Single-Crystal Catalyst Surfaces | Provides a well-defined, atomically flat surface to minimize heterogeneity and test fundamental assumptions of kinetic models. |
| Isotopically Labeled Reactants | Enables precise tracking of atom pathways through a reaction network (e.g., using D₂, ¹⁸O₂, ¹³CO), crucial for discriminating between ER and LH mechanisms. |
| Modulated Excitation (ME) Setup | Periodically perturbs reaction conditions (e.g., concentration, temperature) to isolate the response of specific intermediates via phase-sensitive detection in spectroscopy. |
| Ultra-High Vacuum (UHV) System | Allows for pristine surface preparation, precise dosing of adsorbates, and the use of surface-sensitive techniques like LEED, TPD, and XPS. |
| Computational Software (DFT, MD) | Used to calculate adsorption energies, reaction barriers, and diffusion coefficients as a function of coverage, providing input for microkinetic models. |
| In-situ Spectroscopic Cells | Reaction chambers compatible with IR, Raman, XRD, or XAS that allow real-time monitoring of surface species and catalyst structure under working conditions. |
| Pulse-Quench & TAP Reactor Systems | Enables transient kinetic experiments to measure surface lifetimes, active site counts, and elementary step kinetics without assuming a rate-determining step. |
Optimizing Experimental Design for Unambiguous Mechanism Identification
Within the context of surface reaction kinetics, discriminating between the Eley-Rideal (ER) and Langmuir-Hinshelwood (LH) mechanisms remains a fundamental challenge with direct implications for catalyst design, sensor development, and pharmaceutical heterogeneous catalysis. The ER mechanism involves the reaction between a strongly adsorbed species and a gaseous (or weakly adsorbed) reactant directly from the fluid phase. In contrast, the LH mechanism requires both reactants to be adsorbed on adjacent sites before surface reaction. Ambiguous identification can lead to incorrect scaling, poor optimization, and flawed kinetic models.
This guide details the experimental design principles necessary for unambiguous discrimination, focusing on quantitative kinetic and spectroscopic methodologies.
Core Discriminatory Evidence: A Quantitative Framework
The table below summarizes the key kinetic and observational signatures that distinguish the two mechanisms under idealized conditions.
Table 1: Discriminatory Evidence for ER vs. LH Mechanisms
| Experimental Probe | Eley-Rideal Signature | Langmuir-Hinshelwood Signature | Critical Experimental Control |
|---|---|---|---|
| Rate Dependence on Pressure (A + B → P) | Linear in (PB), zero-order in (PA) at saturation. | Rate passes through a maximum with increasing (PA) or (PB). | Ensure surface cleanliness; measure initial rates. |
| Apparent Activation Energy | Often lower, less sensitive to coverage. | Can vary strongly with reactant coverage. | Measure at multiple, well-defined coverages. |
| Isotopic Transient Kinetic Analysis | Immediate product formation upon switching (B) to (B^*) with pre-adsorbed (A). | Delay in labeled product (AB^*) formation, following a characteristic transient. | Use rapid-switch reactor; high sensitivity MS. |
| Spatial-Temporal Resolution (e.g., STM) | Reaction occurs at perimeter of adsorbed islands. | Reaction occurs uniformly across adsorbed layer or within islands. | Requires single-crystal surfaces under controlled conditions. |
| Calorimetric Heats of Adsorption | Heat of adsorption of one reactant is insignificant for rate. | Heats of adsorption of both reactants critically influence rate. | Use calibrated microcalorimetry coupled with kinetics. |
| Order in Vacant Sites | Zero or negative (if adsorbed A blocks sites for others). | Typically positive and fractional (often ~0.5). | Vary total site density via alloying or poisoning. |
Detailed Experimental Protocols
Protocol: Isotopic Transient Kinetic Analysis (ITKA) for Mechanism Discrimination
Objective: To observe the temporal evolution of labeled products following an isotopic switch, distinguishing between the residence times of intermediates.
Materials:
- Continuous-flow tubular microreactor (plug-flow conditions).
- High-speed, computer-controlled 4-port switching valve.
- Quadrupole Mass Spectrometer (QMS) with fast response (<100 ms).
- Catalytic sample (e.g., 50 mg, 150-250 μm sieve fraction).
- (^{12})CO and (^{13})CO (or (H2) and (D2)) gases of high purity (≥99.99%).
- Inert gas (He, Ar) for purging.
Method:
- Pretreatment: Reduce catalyst in (H_2) at specified temperature (e.g., 400°C, 2h), flush with inert gas.
- Steady-State: Establish steady-state reaction conditions using unlabeled reactants (e.g., (A + ^{12}B → P)). Monitor product P signal via MS until stable.
- Isotopic Switch: At time (t=0), actuate the switching valve to replace the flowing stream of reactant B with its isotopically labeled equivalent (B^*) (e.g., (^{12}CO) to (^{13}CO)), while keeping all other conditions identical.
- High-Frequency Monitoring: Record the MS signals for (B), (B^), (P), and (P^) with a high acquisition frequency (≥10 Hz).
- Data Analysis: Plot normalized concentrations of (P) and (P^) vs. time.
- ER Indicator: (P^) appears immediately after the switch of (B) to (B^), with a rise time comparable to the gas-phase residence time. The decay of unlabeled (P) is simultaneous.
- LH Indicator: A distinct delay (residence time) is observed for the appearance of (P^), corresponding to the surface lifetime of the adsorbed (A-B^) intermediate. The decays of (P) and rise of (P^) are separated in time.
Protocol: Kinetic Order Determination via Partial Pressure Modulation
Objective: To accurately determine the reaction orders with respect to each reactant partial pressure, a primary diagnostic tool.
Materials:
- Differential reactor or recirculating batch reactor to minimize conversions (<10%).
- Precise mass flow controllers (MFCs) for each gas.
- On-line gas chromatograph (GC) or MS for product analysis.
- High-purity reactant gases and diluent (e.g., He).
Method:
- Baseline Activity: Measure the steady-state reaction rate under a reference condition ((PA^0), (PB^0)).
- Order in A: Systematically vary the partial pressure of reactant (PA) over a range (e.g., 0.1 to 10 * (PA^0)) while holding (PB) constant at (PB^0). Maintain total flow/pressure constant using diluent.
- Order in B: Similarly, vary (PB) while holding (PA) constant at (P_A^0).
- Data Fitting: Plot log(rate) vs. log((Pi)). The slope is the apparent order (ni).
- ER Indicator: (nA ≈ 0) (saturated), (nB ≈ 1).
- LH Indicator: (nA) and (nB) are typically positive fractions (<1) and rate may show a maximum.
The Scientist's Toolkit: Research Reagent Solutions
Table 2: Essential Materials for Mechanistic Studies
| Item | Function & Rationale |
|---|---|
| Single-Crystal Metal Surfaces (e.g., Pt(111), Pd(100)) | Provides a well-defined, uniform surface for fundamental studies using UHV techniques, eliminating site heterogeneity. |
| Isotopically Labeled Gases ((^{13})CO, (^{18})O(2), D(2), (^{15})N(_2)) | Enables tracing of atom pathways through reactions via ITKA and spectroscopic methods (e.g., IR, SIMS). |
| Chemical Vapor Deposition (CVD) Reactants (e.g., Trimethylaluminum, Silane) | For the precise synthesis of model supported catalyst systems with controlled nanoparticle size and composition. |
| Calibrated Temperature-Programmed Desorption (TPD) System | Quantifies adsorption strength, surface coverage, and binding states of reactants and intermediates. |
| In-Situ/Operando Spectroscopy Cells (DRIFTS, XAS, Raman) | Allows real-time monitoring of surface species and catalyst structure during reaction, linking kinetics to molecular states. |
| Fast-Response Quadrupole Mass Spectrometer (QMS) | Critical for transient kinetic experiments (ITKA, TPD, SSITKA) requiring millisecond-level temporal resolution of gas composition. |
| Microkinetic Modeling Software (e.g., CATKINAS, Kinetics Toolkit) | Provides a quantitative framework to test hypothesized mechanisms (ER vs. LH) against full datasets, estimating intrinsic parameters. |
Mechanistic Decision Workflow & Pathway Visualization
Title: Mechanistic Discrimination Decision Workflow
Title: ER vs LH Mechanism Reaction Pathways
Unambiguous discrimination between ER and LH mechanisms is not achieved by a single experiment but through a convergent, multi-faceted experimental strategy. The protocols outlined here—emphasizing transient kinetics, precise order determinations, and operando spectroscopy—provide a robust framework. Quantitative data must be integrated into microkinetic models for final validation. This rigorous approach ensures that conclusions about catalytic mechanisms are defensible, directly informing the rational design of more efficient catalytic processes in energy, chemicals, and pharmaceutical synthesis.
Within heterogeneous catalysis and surface science, a foundational debate centers on the operative reaction mechanism: the Eley-Rideal (ER) mechanism, where a fluid-phase reactant directly reacts with an adsorbed species, versus the Langmuir-Hinshelwood (LH) mechanism, where both reactants are adsorbed on the catalyst surface prior to reaction. Accurate discrimination between these pathways is critical for catalyst design, pharmaceutical development (e.g., heterogeneous enzyme inhibitors), and process optimization. A central challenge is that experimentally observed ("apparent") rates often convolute intrinsic surface kinetics with mass transfer limitations and adsorption equilibria. This guide details advanced methodologies to deconvolute these effects and extract the true kinetic parameters essential for mechanistic elucidation.
Core Challenge: Apparent vs. True Kinetics
Apparent reaction rates (( r_{app} )) are influenced by:
- Intrinsic Surface Kinetics: The true chemical transformation rate on the active site, governed by rate constants (( k_{true} )) and surface coverages (( \theta )).
- External Mass Transfer: Diffusion of reactants from the bulk fluid to the catalyst surface.
- Internal Diffusion: Pore diffusion within porous catalysts.
- Adsorption/Desorption Equilibria: Described by adsorption constants (( K_{ads} )).
Failure to account for these factors leads to incorrect determination of activation energies (( E_a )) and pre-exponential factors (( A )), and thus, erroneous mechanistic assignment.
Methodologies & Experimental Protocols
Diagnostic Tests for Transport Limitations
Protocol (Weisz-Prater Criterion for Internal Diffusion):
- Measure the observed rate of reaction (( r_{obs} )) per unit mass of catalyst.
- Determine effective diffusivity (( D_{eff} )) of the reactant within the catalyst pellet using dedicated permeation experiments or established correlations.
- Calculate the Weisz-Prater modulus: ( \Phi = \frac{r{obs} \cdot \rho{cat} \cdot R^2}{D{eff} \cdot Cs} ), where ( \rho{cat} ) is catalyst density, ( R ) is pellet radius, and ( Cs ) is surface concentration.
- Interpretation: If ( \Phi << 1 ), internal diffusion limitations are negligible. If ( \Phi >> 1 ), severe diffusion masking exists; intrinsic kinetics cannot be extracted without correction.
Protocol (Mears Criterion for External Mass Transfer):
- Vary catalyst particle size while keeping total mass constant. A change in ( r_{obs} ) indicates external mass transfer influence.
- Alternatively, vary agitation speed (slurry reactor) or flow rate (fixed bed). Consistency in rate beyond a critical threshold indicates absence of external limitations.
Regression Analysis for Kinetic Model Discrimination
- Protocol (Differential or Integral Reactor Analysis):
- Collect high-precision rate data (( r{app} )) across a range of partial pressures (( Pi )) and temperatures (( T )) after verifying absence of transport limitations.
- Postulate rival rate expressions based on ER and LH mechanisms.
- Simple ER Model: ( r{true} = k \cdot KA \cdot PA \cdot \thetaB ) (A from fluid, B adsorbed).
- Simple LH Model: ( r{true} = k \cdot \thetaA \cdot \thetaB = \frac{k \cdot KA KB \cdot PA \cdot PB}{(1 + KA PA + KB P_B)^2} ).
- Use non-linear least squares regression (e.g., Levenberg-Marquardt algorithm) to fit rival models to the data, estimating parameters ( k ), ( KA ), ( KB ).
- Employ statistical criteria (Akaike Information Criterion (AIC), F-test) for objective model selection, favoring the model with the best fit-parsimony trade-off.
Activation Energy Deconvolution
- Protocol (Apparent (Ea) Correction):
- Measure ( r{app} ) at multiple temperatures to obtain an apparent ( E{a, app} ) from an Arrhenius plot.
- For a LH mechanism with strong adsorption of one reactant, the apparent rate may be ( r{app} \approx \frac{k \cdot KA \cdot PA \cdot PB}{KA \cdot PA} = k \cdot PB ), where the observed ( E{a, app} = E{a, true} + \Delta H{ads,A} ). ( \Delta H{ads,A} ) is typically exothermic (negative).
- Independently measure the adsorption enthalpy ( \Delta H{ads} ) via calorimetry or van't Hoff analysis of adsorption isotherms.
- Calculate the true activation energy: ( E{a, true} = E{a, app} - \Delta H{ads} ).
Table 1: Characteristic Signatures of Apparent Kinetic Parameters Under Transport Limitations
| Limitation Type | Effect on Apparent Rate Order | Effect on Apparent (E_a) | Diagnostic Test Result |
|---|---|---|---|
| External Mass Transfer | Approaches 1st order w.r.t. reactant | ~Low (10-15 kJ/mol), resembles diffusion | Rate changes with flow/agitation |
| Internal Pore Diffusion | Order becomes ~(n+1)/2* | ~(E_{a, true}/2) | Weisz-Prater modulus >> 1 |
| Kinetic Regime (True) | Reflects intrinsic mechanism | True (E_a) (typically >40 kJ/mol) | Weisz-Prater << 1; Mears criterion satisfied |
where *n is the true intrinsic order.
Table 2: Key Parameter Comparison for ER vs. LH Mechanisms After Deconvolution
| Parameter | Eley-Rideal Mechanism | Langmuir-Hinshelwood Mechanism | Experimental Technique for Extraction |
|---|---|---|---|
| Rate Law Form | ( r = k KB PA PB / (1 + KB P_B)) | ( r = k KA KB PA PB / (1+KA PA+KB PB)^2 ) | Non-linear regression of isothermal data |
| Pressure Dependence | Saturation in one reactant pressure | Maximum rate at intermediate pressures (bimolecular) | Variation of partial pressures in batch or flow reactor |
| Typical (E_{a, true}) | Often higher (requires direct collision) | Can be lower (surface mobility aided) | Arrhenius plot from transport-free data |
| Adsorption Enthalpy ((\Delta H_{ads})) Dependency | Involves only one adsorbing species | Critical for both reactants; determines coverage | Calorimetry, TPD, adsorption isotherms |
The Scientist's Toolkit: Research Reagent Solutions
| Item | Function & Relevance to Kinetic Analysis |
|---|---|
| Differential Plug Flow Reactor (PFR) | Provides direct measurement of reaction rate at specific concentrations, minimizing heat/mass transfer gradients. Essential for initial rate studies. |
| In-situ DRIFTS or ATR-IR Cell | Allows simultaneous measurement of gas-phase composition and surface adsorbate concentrations ((\theta)), critical for validating assumed adsorption models. |
| Pulse Chemisorption System | Quantifies active site density, metal dispersion, and can estimate adsorption strengths—key inputs for normalizing true rate constants (turnover frequency, TOF). |
| Isothermal Calorimeter (Microcalorimetry) | Directly measures heat of adsorption ((\Delta H{ads})) in real-time, providing the vital correction factor for (Ea) deconvolution. |
| Coupled GC/MS or Online Mass Spectrometer | For precise, time-resolved quantification of reactant and product concentrations under transient or steady-state conditions. |
| Computational Software (e.g., Python/SciPy, MATLAB, KineticsTK) | For implementing non-linear regression, solving coupled ODEs (for reactor models), and performing statistical model discrimination (AIC, F-tests). |
Visualizations
Diagram 1: Workflow for True Kinetic Parameter Extraction
Diagram 2: Energy Landscape: Apparent vs. True Activation Energy
Head-to-Head Comparison: Validating and Contrasting LH and ER Mechanisms
Within the study of heterogeneous catalysis, the Eley-Rideal (ER) and Langmuir-Hinshelwood (LH) mechanisms represent two foundational models for describing surface reactions. This whitepaper presents a direct comparative analysis, framed within ongoing research aimed at elucidating the governing mechanisms in catalytic systems critical to pharmaceutical synthesis and environmental catalysis. The core differentiator lies in the molecular pathway: the ER mechanism involves a direct reaction between an adsorbed species and a gas-phase (or weakly adsorbed) reactant, while the LH mechanism requires the reaction between two co-adsorbed species on the catalyst surface. This fundamental difference dictates distinct rate law dependencies, experimental signatures, and optimal application domains.
Mechanistic Foundations and Rate Law Derivations
Langmuir-Hinshelwood Mechanism
The LH mechanism proceeds through three elementary steps:
- Adsorption: Reactants A and B adsorb onto distinct surface sites S. ( A + S \rightleftharpoons A-S ) (adsorption equilibrium constant ( KA )) ( B + S \rightleftharpoons B-S ) (adsorption equilibrium constant ( KB ))
- Surface Reaction: The adsorbed species react on the surface. ( A-S + B-S \rightarrow \text{Products} + 2S ) (surface rate constant ( k_{sr} ))
- Desorption: Products desorb, freeing sites.
Assumptions: Adsorption/desorption are at equilibrium; the surface reaction is rate-limiting.
Derived Rate Law: [ r{LH} = \frac{k{sr} KA KB PA PB}{(1 + KA PA + KB PB)^2} ] Where ( r{LH} ) is the rate, ( k{sr} ) is the surface rate constant, ( Ki ) are adsorption equilibrium constants, and ( Pi ) are partial pressures.
Eley-Rideal Mechanism
The ER mechanism involves a different pathway:
- Adsorption: Only reactant A adsorbs strongly onto a surface site S. ( A + S \rightleftharpoons A-S ) (adsorption equilibrium constant ( K_A ))
- Direct Reaction: Adsorbed A-S reacts directly with a gas-phase molecule of B. ( A-S + B(g) \rightarrow \text{Products} + S ) (rate constant ( k ))
- Desorption: Products desorb.
Assumptions: Adsorption of A is at equilibrium; the bimolecular reaction is rate-limiting; B does not adsorb appreciably.
Derived Rate Law: [ r{ER} = \frac{k KA PA PB}{1 + KA PA} ]
Table 1: Functional Dependence of Reaction Rate on Reactant Partial Pressure
| Mechanism | Low ( P_A ) (Low Coverage) | High ( P_A ) (Saturated) | Low ( P_B ) | High ( P_B ) |
|---|---|---|---|---|
| Langmuir-Hinshelwood | ( r \propto PA PB ) (1st order each) | ( r \propto 1/P_A ) (inverse) | ( r \propto P_B ) | ( r \propto 1/P_B ) (inverse) |
| Eley-Rideal | ( r \propto PA PB ) (1st order each) | ( r \propto P_B ) (zero order in A) | ( r \propto P_B ) | ( r \propto P_B ) (remains 1st order) |
Table 2: Key Differentiating Factors and Diagnostic Tests
| Differentiating Factor | Langmuir-Hinshelwood Mechanism | Eley-Rideal Mechanism |
|---|---|---|
| Required Surface Species | Both reactants must adsorb. | Only one reactant must adsorb; the other reacts from the gas phase. |
| Optimal Temperature | Often has an optimum; high T reduces coverage, low T slows surface reaction. | Rate typically increases monotonically with temperature. |
| Isotopic Transient Response | Slow response due to mixing of both adsorbed reactants. | Fast response; gas-phase reactant directly probes adsorbed layer. |
| Sensitivity to Site Blocking | Severe inhibition by inert adsorbates (blocks sites for both reactants). | Moderate inhibition (blocks sites for only one reactant). |
| Typical Systems | CO oxidation on Pt, Pd; many hydrogenation reactions. | Hydrogenation of unsaturated hydrocarbons on metals; some atom-transfer reactions. |
Experimental Protocols for Mechanism Discrimination
Protocol 1: Kinetic Order Determination via Partial Pressure Variation
Objective: Measure reaction order with respect to each reactant under controlled conditions. Methodology:
- Use a continuous-flow fixed-bed reactor or a recirculating batch reactor.
- Maintain constant temperature, total flow rate, and catalyst mass.
- Vary the partial pressure of reactant A ((PA)) over a wide range (e.g., 0.01-1 bar) while holding (PB) constant.
- Measure steady-state reaction rate.
- Repeat, varying (PB) while holding (PA) constant.
- Plot log(rate) vs. log((Pi)) to determine apparent reaction orders. Diagnostic: An order in A that transitions from positive to negative with increasing (PA) strongly suggests LH. An order in A that approaches zero suggests ER.
Protocol 2: Isotopic Chemical Tracing (SSITKA)
Objective: Probe the involvement of adsorbed species in the rate-determining step. Methodology:
- Achieve steady-state reaction using a labeled isotope (e.g., (^{12})CO).
- Perform a rapid switch to an isotopically different feed (e.g., (^{13})CO) while maintaining all other conditions (flow, pressure, composition).
- Monitor the transient response of both reactants and products using mass spectrometry.
- Analyze the delay and shape of the product isotope transition. Diagnostic: A significant delay (long residence time) for the new isotope to appear in the product indicates both reactants are part of a pooled surface intermediate (LH). A swift product response suggests a direct gas-surface collision (ER).
Protocol 3: Competitive Co-adsorption Inhibition
Objective: Assess the inhibitory effect of a non-reactive species on the reaction rate. Methodology:
- Establish a baseline steady-state reaction rate with reactants A and B.
- Introduce a small, constant partial pressure of a strongly adsorbing inert species (e.g., CO on metal surfaces, pyridine on acids).
- Measure the new steady-state rate.
- Correlate rate inhibition with the known surface coverage of the poison. Diagnostic: Severe, non-linear rate suppression is characteristic of LH (poison blocks sites for both reactants). Weaker, more linear inhibition is consistent with ER (poison blocks sites for only the adsorbing reactant).
Visualization of Mechanisms and Workflows
Title: Comparative Schematic of LH and ER Surface Reaction Mechanisms
Title: Decision Workflow for Discriminating LH vs ER Mechanisms
The Scientist's Toolkit: Research Reagent Solutions
Table 3: Essential Materials for Mechanistic Studies in Heterogeneous Catalysis
| Item / Reagent | Primary Function in Analysis | Example Application / Note |
|---|---|---|
| High-Purity Gaseous Reactants | Serve as the principal reacting species for kinetic studies; isotopic variants (e.g., D₂, ¹³CO, ¹⁸O₂) are crucial for tracing. | Used in Protocol 1 (kinetics) & 2 (SSITKA). Must have defined isotopic purity. |
| Catalyst Bed (Powder/Pellet) | The solid material providing active sites for the reaction under study. | Characterized pre-experiment (surface area, metal dispersion, acidity). |
| Inert Competitive Adsorbate | A molecule that strongly binds to active sites but does not react, used to probe site requirements. | e.g., CO on metals, pyridine on acid sites. Used in Protocol 3 (inhibition). |
| Mass Spectrometer (MS) | For real-time, quantitative tracking of reactants, products, and isotopic labels. | Core detector for SSITKA (Protocol 2) and transient kinetic studies. |
| Fixed-Bed Microreactor System | Provides a controlled environment (T, P, flow) for conducting steady-state and transient kinetics. | Typically made of quartz or stainless steel, integrated with online GC/MS. |
| Thermal Conductivity Detector (TCD) | Measures concentration of gases, particularly effective for H₂, CO, CO₂. | Often part of a Gas Chromatograph (GC) for analyzing product distribution. |
| Chemisorption Analyzer | Quantifies active surface sites (metal dispersion, acid site density) via selective gas adsorption. | Used for pre-catalytic characterization to normalize rates per active site (TOF). |
| In Situ/Operando Spectroscopy Cells | Allows spectroscopic characterization (DRIFTS, Raman, XAS) under reaction conditions. | Links surface species identity and concentration to kinetic data. |
In the study of surface reaction mechanisms, such as the Eley-Rideal (ER) and Langmuir-Hinshelwood (LH) models, the dependence of reaction kinetics on surface coverage (θ) is a fundamental discriminating variable. The ER mechanism posits a direct reaction between a gas-phase species and an adsorbed species, often leading to a rate that is first-order in the adsorbate coverage but may show complex dependencies if the adsorption itself is coverage-dependent. In contrast, the classic LH mechanism involves a reaction between two adsorbed species, typically resulting in a rate proportional to the product of their respective coverages, leading to a quadratic or more complex dependence. Accurately measuring and modeling the functional relationship between reaction rate and θ is therefore critical for mechanistic assignment. This guide details the experimental and analytical frameworks for determining this dependence.
Table 1: Characteristic Rate Dependence on Surface Coverage for Idealized Mechanisms
| Mechanism | Rate Law (Simplified) | Key Coverage Dependence | Typical Observation Method |
|---|---|---|---|
| Eley-Rideal (ER) | r = k * Pgas * θA | Linear in θA; independent of θB | Modulating θ while holding P constant |
| Langmuir-Hinshelwood (LH) | r = k * θA * θB | Quadratic (if A=B) or product of coverages | Co-adsorption experiments |
| Precursor-Mediated ER | r = k * Pgas * f(θ) | Complex, often (1-θ) or similar inhibition | High-resolution kinetics |
| Mars-van Krevelen | r = k * Pgas * θvac | Linear in vacancy concentration (1-θ for oxide systems) | Isotopic transient kinetics |
Table 2: Experimental Techniques for Measuring Coverage-Dependent Kinetics
| Technique | Coverage Range | Temporal Resolution | Key Measured Output | Suitability for ER vs. LH |
|---|---|---|---|---|
| Modulated Molecular Beams | 0.01 - 1 ML | Microseconds | Phase lag & amplitude of product signal | Excellent for direct ER evidence |
| Isothermal Calorimetry | 0 - 1 ML | Seconds | Heat of adsorption/reaction vs. exposure | Good for adsorption energetics |
| In Situ FTIR/DRIFTS | 0.1 - 1 ML | Seconds to minutes | Integrated absorbance of surface species vs. time | Good for monitoring θ during reaction |
| Ambient Pressure XPS | 0.01 - 1 ML | Minutes | Core-level intensity of adsorbates | Direct θ measurement under pressure |
| Sticking Probability (S(θ)) | 0 - 1 ML | Milliseconds | Initial S0 and decay curve | Critical for precursor states |
Core Experimental Protocols
Protocol: Determining Sticking Coefficient vs. Coverage (S(θ))
Objective: To measure the probability of gas-phase molecule adsorption as a function of existing surface coverage, a key discriminator for adsorption dynamics preceding ER or LH steps.
Materials:
- Ultra-High Vacuum (UHV) chamber (base pressure < 1×10⁻¹⁰ mbar).
- Single crystal or well-defined catalyst sample.
- Quadrupole Mass Spectrometer (QMS) with line-of-sight to sample.
- Molecular beam source with high-speed chopper.
- Low Energy Electron Diffraction/Auger Electron Spectroscopy (LEED/AES) for surface characterization.
- Temperature programmed desorption (TPD) system.
Procedure:
- Prepare a clean surface via repeated sputter-anneal cycles, verified by AES and a sharp LEED pattern.
- Cool the sample to the desired adsorption temperature (e.g., 100 K).
- Expose the surface to a modulated molecular beam of the reactant gas. The modulation (on/off) is typically in the millisecond range.
- Use the QMS to monitor the partial pressure drop of the gas when the beam is incident on the surface versus when it is blocked. The difference is proportional to the adsorption rate.
- The sticking probability S(θ) at time t is: S(θ) = (ΔP(t) / ΔP(0)), where ΔP(0) is the pressure drop at zero coverage.
- Integrate the adsorption rate over time to obtain the absolute surface coverage, θ.
- Plot S vs. θ. A linear decline suggests simple Langmuirian adsorption. A more complex decay (e.g., precursor-mediated) is often relevant for ER pathways.
Protocol: Transient Kinetic Analysis (TKA) for Mechanism Discrimination
Objective: To observe the transient response of product formation to a sudden change in reactant pressure, revealing coverage-dependent rate constants.
Materials:
- Plug-flow microreactor with high-speed valves.
- Mass spectrometer or optical gas analyzer with <100 ms response time.
- Catalyst bed (powder or single crystal wafer).
- Precise temperature control system.
Procedure:
- Pre-treat the catalyst under inert flow and stabilize at reaction temperature.
- Establish a steady-state reaction with a known partial pressure of reactant A.
- At time t=0, introduce a step-change (increase or decrease) in the pressure of reactant B.
- Record the product formation rate with high temporal fidelity.
- The shape of the product rate transient contains information on surface coverage. A near-instantaneous step-response suggests an ER-type mechanism involving the gas-phase reactant. A slower, sigmoidal buildup suggests the involvement of adsorbed intermediates (LH-type), as the coverage of the second reactant must equilibrate.
- Fit the transient curves to microkinetic models containing ER and LH steps to extract coverage-dependent rate constants.
Visualization of Concepts and Workflows
Title: Workflow for Discriminating ER and LH via Coverage Dependence
Title: ER and LH Mechanism Schematic with Coverage Variables
The Scientist's Toolkit: Research Reagent Solutions & Essential Materials
Table 3: Key Materials for Surface Coverage-Dependent Studies
| Item & Example Supplier | Primary Function in Experiment | Critical Specification for Coverage Studies |
|---|---|---|
| Single Crystal Surfaces (e.g., MaTecK, Surface Preparation Lab) | Provides a well-defined, reproducible surface with uniform adsorption sites. Essential for fundamental S(θ) and TPD. | Crystal orientation (e.g., Pt(111)), surface roughness (< 0.05 μm), purity (> 99.99%). |
| Model Catalyst Wafers (e.g., thin-film metal on oxide supports) | Bridges single-crystal and powder catalysis. Allows spatial averaging while maintaining some structural control. | Film thickness (nm), uniformity (ellipsometry), oxide support composition. |
| High-Purity Calibration Gas Mixtures (e.g., NIST-traceable from AirGas, Linde) | For quantitative MS calibration and precise partial pressure control in transient experiments. | Mixture accuracy (±1%), stability, certified inert background (He, Ar). |
| Isotopically Labeled Reactants (e.g., 18O2, 13CO from Cambridge Isotopes) | Enables tracking of specific atoms through reaction pathways. Critical for distinguishing ER (direct label incorporation) from LH (scrambling). | Isotopic enrichment (> 99%), chemical purity. |
| UHV-Compatible Gas Dosing Systems (e.g., precision leak valves, capillary arrays) | To achieve precise, reproducible, and quantifiable gas exposure (Langmuirs, L) to the surface. | Calibrated flux, stability, minimal background contamination. |
| Calorimetry Chips (SiN membrane microcalorimeters) | Directly measures heat of adsorption as a function of coverage, revealing changes in adsorption energetics with θ. | Sensitivity (nJ), response time, sample mounting compatibility. |
This technical guide examines the predictive behavioral differences in surface reaction kinetics under varying temperature and pressure conditions. The analysis is framed within the ongoing research thesis comparing the Eley-Rideal (ER) and Langmuir-Hinshelwood (LH) mechanisms, which are foundational to heterogeneous catalysis and have direct implications for catalytic reaction engineering in pharmaceutical synthesis.
Theoretical Framework: ER vs. LH Mechanisms
The Eley-Rideal mechanism involves a reaction between an adsorbed species and a gaseous (or liquid-phase) species directly from the fluid phase. In contrast, the Langmuir-Hinshelwood mechanism requires both reactants to be adsorbed onto the catalyst surface before reacting. Temperature and pressure critically influence which pathway dominates by affecting adsorption equilibria, surface coverage, and the kinetic energy of reactants.
Quantitative Data: Effects on Reaction Parameters
The following tables summarize key quantitative relationships and experimental data.
Table 1: Predictive Effects of Temperature on Mechanism-Specific Parameters
| Parameter | Eley-Rideal Mechanism Response | Langmuir-Hinshelwood Mechanism Response | Typical Measurement Units |
|---|---|---|---|
| Apparent Activation Energy (Ea) | Often lower; less sensitive to coverage changes. | More complex; can be influenced by adsorption enthalpies. | kJ mol⁻¹ |
| Reaction Order in Gas-Phase Reactant | ~1st order for gaseous reactant; ~0th order for adsorbed species. | Can vary widely (0 to 1) based on coverage and competition. | Dimensionless |
| Optimal Temperature Window | Broader, as direct reaction bypasses adsorption equilibrium. | Narrower, often limited by desorption or surface depletion. | K |
| Turnover Frequency (TOF) Sensitivity | Linear increase with T, then plateaus. | Passes through a maximum due to adsorption/desorption balance. | s⁻¹ |
Table 2: Predictive Effects of Pressure on Mechanism-Specific Parameters
| Parameter | Low-Pressure Regime Behavior | High-Pressure Regime Behavior | Dominant Mechanism Indicator |
|---|---|---|---|
| Rate Dependence on Reactant A Pressure | ~Linear increase. | Saturates to zero-order. | LH if both reactants saturate. |
| Selectivity in Competitive Pathways | Favors less sterically hindered adsorption. | May favor ER pathway if one reactant adsorbs poorly. | Shift from LH to ER possible. |
| Surface Coverage (θ) | Low, proportional to P. | High, approaches monolayer. | LH favored at high θ. |
| Apparent Reaction Order | Near 1 for key reactant. | Approaches 0 for key reactant. | ER often maintains positive order. |
Experimental Protocols for Discrimination
Protocol A: In Situ Spectroscopy under Variable T & P
Objective: To differentiate ER and LH pathways by measuring surface species coverage and identity under reaction conditions. Methodology:
- Place catalyst wafer in a high-pressure, temperature-controlled in situ DRIFTS (Diffuse Reflectance Infrared Fourier Transform Spectroscopy) or XPS cell.
- Pre-treat catalyst under inert flow at elevated temperature.
- Introduce reactants at a base pressure (e.g., 1 bar) and temperature (e.g., 300 K).
- Collect a baseline spectrum.
- Systematically increase temperature (isobaric mode) in 25 K increments up to 600 K, collecting spectra at each point after stabilization.
- Return to base temperature. Systematically increase pressure (isothermal mode) from 0.1 bar to 10 bar, collecting spectra.
- Key Analysis: Correlate the intensity of adsorbed intermediate bands (e.g., *-CO, *-OOH) with gas-phase product formation rate (measured by online MS or GC). A strong correlation suggests an LH intermediate. An ER pathway may show weak or no correlation with adsorbed species.
Protocol B: Kinetic Isotope Effect (KIE) Measurements with Pressure Modulation
Objective: To probe the involvement of adsorption/desorption steps (LH hallmark) versus direct collision (ER hallmark). Methodology:
- Perform identical catalytic runs with protiated (e.g., H₂) and deuterated (e.g., D₂) reactants.
- Conduct experiments at constant low pressure (e.g., 0.5 bar) across a temperature range (e.g., 350-500 K).
- Repeat at constant high pressure (e.g., 5 bar) across the same temperature range.
- Measure the rate constant ratio (kH / kD).
- Interpretation: A significant primary KIE (~2-7) suggests cleavage of a C-H/D bond is rate-limiting, common in LH where adsorption is involved. A near-unity KIE suggests a non-bond-breaking step (like direct collision in ER) is rate-limiting. Pressure-induced shifts in KIE magnitude indicate a change in the rate-determining step linked to adsorption equilibrium.
Visualization of Pathways and Workflows
The Scientist's Toolkit: Research Reagent Solutions
Table 3: Essential Materials for T/P Effect Studies on ER vs. LH Mechanisms
| Item | Function in Research | Example/Specification |
|---|---|---|
| Model Catalysts | Provide well-defined surfaces for fundamental studies. | Single crystals (Pt(111), Pd(100)), supported nanoparticles with controlled size. |
| Deuterated Reactants | Enable Kinetic Isotope Effect (KIE) studies to probe bond-breaking steps. | D₂ gas (99.8%), CD₄, deuterated alkenes. |
| In Situ Cell | Allows spectroscopic characterization under realistic T & P. | High-pressure DRIFTS cell with ZnSe windows, capable of up to 10 bar and 600 K. |
| Mass Spectrometer (MS) | For real-time tracking of gas-phase composition and reaction rates. | Online quadrupole MS with capillary inlet for rapid sampling. |
| Programmable Pressure Controllers | Precisely modulate total and partial pressures. | Electronic back-pressure regulators, mass flow controllers. |
| Calibrated Thermocouples | Accurate temperature measurement at catalyst site. | Type K (chromel-alumel) thermocouple, calibrated against standard. |
| Porous Catalyst Supports | High-surface-area substrates for practical catalysts. | γ-Alumina, silica, carbon nanotubes, with defined pore size. |
| UHV System | For preparatory surface cleaning and initial characterization. | Base pressure < 1x10⁻¹⁰ mbar, with sputtering and annealing capabilities. |
Validating Mechanisms with Modern In-Situ and Operando Spectroscopy
This technical guide addresses the critical challenge of differentiating between the Eley-Rideal (ER) and Langmuir-Hinshelwood (LH) mechanisms in heterogeneous catalysis and surface science. The ER mechanism involves a direct reaction between an adsorbed species and a gas-phase (or bulk liquid-phase) reactant, while the LH mechanism requires both reactants to be adsorbed on the catalyst surface before reaction. Traditional ex-situ methods provide limited insight into these dynamic processes. Modern in-situ and operando spectroscopic techniques now allow for real-time, molecular-level observation under realistic reaction conditions, enabling definitive mechanistic validation. This guide provides methodologies, data interpretation frameworks, and practical protocols for researchers engaged in catalyst and drug development, where surface-mediated reactions are pivotal.
Core Spectroscopic Techniques for Mechanistic Differentiation
The following table summarizes key in-situ/operando techniques, their applications, and their utility in distinguishing ER vs. LH pathways.
Table 1: Key In-Situ/Operando Spectroscopic Techniques for Mechanism Validation
| Technique | Acronym | Primary Information | ER vs. LH Differentiation Capability | Temporal Resolution |
|---|---|---|---|---|
| In-Situ Fourier-Transform Infrared Spectroscopy | FTIR | Molecular vibrations, surface intermediates, bond formation/breaking. | High. Can detect weakly adsorbed vs. gas-phase species interacting with surfaces. | ~10 ms - 1 s |
| Operando Raman Spectroscopy | Raman | Phonon modes, catalyst phase, surface oxides, carbonaceous species. | Medium. Supports identification of surface-adsorbed reactants required for LH. | ~1 s |
| Ambient Pressure X-ray Photoelectron Spectroscopy | AP-XPS | Elemental composition, chemical states, oxidation states under gas pressure. | Very High. Directly quantify coverage of adsorbed species vs. presence of gas-phase species at the surface. | ~Minutes |
| In-Situ Scanning Tunneling Microscopy | STM | Real-space atomic-scale surface structure and adsorbate ordering. | High. Can visualize islanding (LH precursor) or direct impingement events (ER). | Seconds per image |
| Modulation Excitation Spectroscopy | MES | Phase-sensitive detection of active intermediates by perturbing reaction conditions. | Excellent. Isolates signals from species involved in the catalytic cycle; kinetic analysis reveals adsorption step necessity. | Defined by perturbation period |
| In-Situ Diffuse Reflectance Infrared Fourier Transform Spectroscopy | DRIFTS | IR spectra of powders under reaction flow, ideal for high-surface-area catalysts. | High. Similar to FTIR but for realistic catalyst beds. | ~100 ms - 10 s |
Experimental Protocols for Mechanistic Studies
Protocol: Operando AP-XPS for Adsorbate Coverage Quantification
Objective: To measure the surface coverage of adsorbed reactant A (θA) while simultaneously monitoring the reaction rate with gas-phase reactant B, testing for ER (rate ∝ PB * θA) vs. LH (rate ∝ θA * θ_B).
Materials:
- Ambient Pressure XPS system with differentially pumped analyzer.
- Reaction cell with precise gas dosing (Mass Flow Controllers) and pressure measurement (0.1 mbar - 1 bar).
- Single-crystal catalyst model surface or pressed catalyst wafer.
- Calibrated gas delivery system for reactants (A, B) and inert (He, Ar).
Procedure:
- Surface Preparation: Clean the catalyst surface in UHV via sputter-anneal cycles. Confirm cleanliness with survey and core-level XPS scans.
- Adsorbate Saturation: Introduce reactant A at a defined pressure (e.g., 0.1 mbar) at a temperature where it chemisorbs. Hold until saturation coverage (θ_A=1) is achieved, monitored by the intensity of a characteristic adsorbate XPS peak.
- Reaction Introduction: While maintaining the partial pressure of A, introduce reactant B at a controlled pressure. Start simultaneous product analysis via an online Mass Spectrometer (MS) sampling from the reaction cell.
- Simultaneous Measurement: Acquire AP-XPS spectra (focus on core levels of A, B, and catalyst active site) continuously while recording MS data for product evolution.
- Data Analysis: Correlate the instantaneous reaction rate (from MS) with the measured surface coverage of A (θA from XPS) and the detected presence/coverage of B. A constant θA while the rate increases linearly with PB strongly suggests ER. A decrease in θA concurrent with an increase in a measurable θ_B as the rate increases suggests LH.
Objective: To isolate the spectroscopic signature of the active intermediate involved in the rate-determining step, clarifying whether both reactants must be adsorbed.
Materials:
- DRIFTS reactor cell with high-temperature, pressure-controlled environment.
- FTIR spectrometer with fast MCT detector.
- Gas blending system capable of creating square-wave or sinusoidal concentration modulations of one reactant (e.g., reactant B).
- High-surface-area powdered catalyst.
Procedure:
- Steady-State Baseline: Under steady-state reaction conditions (constant flows of A and B), collect a DRIFTS background spectrum.
- Modulation: Introduce a periodic modulation (e.g., 0.1 Hz square wave) to the concentration of reactant B, while keeping the flow of A constant. The total flow rate must remain constant using a balancing inert gas.
- Phase-Sensitive Detection: Collect a time-series of DRIFTS spectra over many modulation periods (typically 50-100). Use digital phase-sensitive detection to deconvolute the spectra.
- Phase Lag Analysis: Generate phase-resolved spectra at different phase angles relative to the modulation of B. The species that are directly involved in the consumption/production cycle of B will appear with a characteristic phase lag.
- Interpretation: If the dominant active intermediate shows a phase lag indicating it contains both A and B, it supports an LH-type intermediate. If the active intermediate is primarily derived from A and responds in-phase or with a different lag to the modulation of B, an ER-type interaction is more likely.
The Scientist's Toolkit: Research Reagent Solutions
Table 2: Essential Research Reagents and Materials for In-Situ/Operando Studies
| Item | Function & Rationale |
|---|---|
| Calibrated Gas Mixtures (5-10% in Balance Inert) | Provide precise and reproducible reactant partial pressures. Essential for kinetic measurements and modulation experiments. |
| Isotopically Labeled Reactants (e.g., ¹⁸O₂, D₂, ¹³CO) | Trace reaction pathways unambiguously. Differentiate between surface exchange (LH) and direct abstraction (ER). Critical for MS and spectroscopy. |
| Single-Crystal Model Surfaces (e.g., Pt(111), Cu(100)) | Provide atomically defined, reproducible surfaces for fundamental studies using AP-XPS, STM, and LEED. |
| High-Purity, Porous Catalyst Supports (e.g., SiO₂, Al₂O₃, TiO₂ powders) | For DRIFTS and practical catalyst studies. Ensure consistency in surface area and porosity for comparable adsorption characteristics. |
| High-Temperature Optical Windows (CaF₂, BaF₂, ZnSe) | Transparent for IR and Raman spectroscopy under reaction conditions. Chemically inert and able to withstand pressure and temperature. |
| Custom-Microfabricated Reactor Cells (Si-based with MEMS heaters) | Enable rapid heating and gas switching for transient experiments. Compatible with synchrotron and lab-based spectroscopy. |
| Reference Catalysts (e.g., EuroPt-1, NIST standards) | Benchmarked materials to validate experimental setup and data analysis protocols across different laboratories. |
Visualizing Experimental Workflows and Mechanistic Pathways
Diagram Title: Workflow for Mechanistic Validation
Diagram Title: LH vs ER Mechanism Pathways
Data Interpretation and Case Studies
Table 3: Diagnostic Signatures for ER vs. LH from In-Situ Spectroscopy
| Observable (Technique) | Signature Favoring LH Mechanism | Signature Favoring ER Mechanism |
|---|---|---|
| Adsorbate Coverage of B (AP-XPS) | θ_B > 0 and correlates with reaction rate. | θB ≈ 0 under operating conditions, despite high PB. |
| Kinetic Order in Reactant B (Operando MS) | Near-zero order at high coverage; positive order at low coverage. | First order across a wide pressure range. |
| Active Intermediate (ME-DRIFTS) | Intermediate species containing signatures of both A and B appears in phase-resolved spectra. | Intermediate is primarily derived from A; B interacts directly without forming a stable co-adsorbed intermediate. |
| Activation Energy | Can reflect the strength of adsorption/desorption steps for both reactants. | Often lower, reflecting the lack of an adsorption energy penalty for reactant B. |
| Spatial Correlation (STM) | Ordered islands or mixed co-adsorption layers of A and B observed. | Only adsorbate A is visible; reaction occurs at perimeter of A islands or at isolated sites upon B impingement. |
The definitive assignment of an Eley-Rideal or Langmuir-Hinshelwood mechanism is no longer reliant on indirect kinetic evidence alone. The integration of modern in-situ and operando spectroscopic techniques, employing the protocols and toolkits outlined herein, provides a direct window into the molecular dance at the catalytic interface. By quantitatively correlating surface coverages, intermediate identities, and reaction rates under working conditions, researchers can construct unequivocal mechanistic pictures. This capability is transformative for the rational design of more efficient catalysts and drug delivery systems, where optimizing the surface reaction pathway is paramount to performance and efficacy.
The study of surface reaction mechanisms has long been dominated by the classical binary of the Eley-Rideal (ER) and Langmuir-Hinshelwood (LH) paradigms. The ER mechanism involves a direct reaction between a gas-phase molecule and an adsorbed species, while the LH mechanism entails a reaction between two co-adsorbed species. However, modern surface science, particularly in catalysis and drug development on surfaces, reveals that many systems operate via more complex hybrid and precursor-mediated pathways. These mechanisms bridge the gap between the classical models, incorporating elements of both while introducing new dynamics, such as weakly bound precursor states or diffusion-mediated reactions. This whitepaper provides an in-depth technical guide to these advanced mechanisms, emphasizing experimental protocols and quantitative analysis relevant to researchers and drug development professionals.
Core Conceptual Framework
Hybrid Mechanisms involve sequences where steps characteristic of both ER and LH mechanisms occur within a single reaction pathway. For instance, one reactant may adsorb, while the second reacts directly from the gas phase in a subsequent step, but within a complex potential energy landscape.
Precursor-Mediated Mechanisms involve a physisorbed or weakly chemisorbed molecular state that exists prior to chemisorption or reaction. This precursor can be intrinsic (above the final adsorption site) or extrinsic (above an already occupied site or inert surface area). This state significantly alters reaction probabilities and kinetics.
The existence of these mechanisms challenges the simplistic ER vs. LH dichotomy and explains discrepancies between predicted and observed reaction rates, orders, and selectivity in heterogeneous catalysis and surface-based biochemical assays.
Quantitative Data Comparison
Table 1: Kinetic Signatures of Classical vs. Advanced Mechanisms
| Mechanism | Rate Dependence on Gas-Phase Pressure | Activation Energy (Ea) Characteristics | Typical Evidence from Molecular Beam Studies |
|---|---|---|---|
| Pure Eley-Rideal (ER) | First order in gas-phase reactant A, zero order in adsorbed B. | Often low, can be negative. | Reaction probability independent of surface temperature (Ts). |
| Pure Langmuir-Hinshelwood (LH) | Order depends on coverage; often fractional. | Ea includes adsorption and surface diffusion. | Reaction probability peaks at intermediate Ts. |
| Precursor-Mediated | Complex, often non-monotonic. | Two distinct regimes: dominated by precursor lifetime at low Ts, by direct adsorption at high Ts. | Reaction probability decreases with increasing Ts at low range, then increases. |
| Hybrid ER/LH | Mixed orders. | Composite Ea value. | Isotopic scattering/kinetic experiments show both direct and adsorbed pathways. |
Table 2: Exemplar Systems and Observed Mechanisms
| System (Surface + Reactants) | Dominant Mechanism Identified | Key Experimental Technique | Relevance to Drug Development |
|---|---|---|---|
| H₂ + CO on Ru(0001) | Precursor-mediated H₂ dissociation driving LH reaction. | Supersonic Molecular Beam, King & Wells Method. | Model for hydrogenation reactions. |
| O₂ + H on Si(111) | Hybrid: Direct ER for some sites, LH for others. | Scanning Tunneling Microscopy (STM) at cryogenic temps. | Surface functionalization for biosensors. |
| NO + CO on Rh(111) | Precursor-mediated NO dissociation followed by LH reaction. | Temperature-Programmed Reaction Spectroscopy (TPRS). | Automotive catalysis models. |
| Protein Adsorption on Polymer Surfaces | Precursor film formation before strong adhesion. | Quartz Crystal Microbalance with Dissipation (QCM-D). | Understanding fouling, drug delivery surface interactions. |
Experimental Protocols for Mechanism Discrimination
Protocol 4.1: Supersonic Molecular Beam Scattering with King & Wells Method
Objective: To measure sticking coefficients and reaction probabilities as a function of beam energy, angle, and surface temperature.
- Preparation: Mount a single-crystal surface in an Ultra-High Vacuum (UHV) chamber (base pressure < 2×10⁻¹⁰ mbar). Clean via repeated sputter (Ar⁺, 1 keV, 15 µA, 30 min) and anneal cycles.
- Calibration: Characterize surface order with Low-Energy Electron Diffraction (LEED) and purity with Auger Electron Spectroscopy (AES).
- Beam Generation: Generate a supersonic, seeded molecular beam of reactant A using a temperature-controlled nozzle. Vary kinetic energy (0.05-1.5 eV) by changing seed gas (He, Ne, Ar) and nozzle temperature.
- Sticking Measurement: Use the King & Wells method. Isolate the chamber from pumps via a gate valve. Monitor partial pressure of A with a Quadrupole Mass Spectrometer (QMS). Expose surface to the beam. The instantaneous drop in partial pressure is proportional to the initial sticking coefficient, S₀.
- Variable Temperature Studies: Repeat step 4 while varying crystal temperature (Ts) from 100 K to 1000 K using liquid nitrogen cooling and resistive heating.
- Data Analysis: Plot S₀ vs. Ts and vs. beam energy. A decreasing S₀ with increasing Ts indicates a precursor-mediated adsorption process.
Protocol 4.2: Temperature-Programmed Reaction Spectroscopy (TPRS) for Kinetic Pathway Deconvolution
Objective: To identify reaction products and determine activation energies for desorption and surface reactions.
- Preparation: Clean surface as in 4.1. Adsorb reactants A and B either simultaneously or sequentially at a low temperature (e.g., 100 K). Control coverage using a calibrated doser and exposure time.
- Linear Temperature Ramp: Heat the crystal linearly (e.g., β = 2-5 K/s) using a programmable power supply.
- Product Detection: Monitor desorbing species in real-time with the QMS set to specific mass-to-charge ratios.
- Kinetic Modeling: Analyze TPRS peak shapes (temperature and width). For a simple LH reaction A(ads) + B(ads) → C(gas), the peak temperature shifts with coverage. Use the Redhead analysis (for first-order desorption) or more complete Polanyi-Wigner equation fitting to extract activation energies.
- Isotopic Labeling: Use isotopically labeled reactants (e.g., D₂ instead of H₂, ¹⁸O₂) to track the origin of atoms in product molecules, distinguishing ER (product contains one labeled atom) from LH (product may contain two).
Visualization of Pathways and Workflows
Diagram 1: Mechanism Decision Tree for Surface Reactions
Diagram 2: Precursor-Mediated Reaction Workflow
The Scientist's Toolkit: Key Research Reagent Solutions & Materials
Table 3: Essential Materials for Investigating Hybrid/Precursor Mechanisms
| Item | Function & Specification | Example Use Case |
|---|---|---|
| Single Crystal Surfaces | Provides a well-defined, atomically flat surface with known structure and orientation (e.g., Pt(111), Au(100)). | Substrate for fundamental UHV studies of adsorption and reaction dynamics. |
| Isotopically Labeled Gases | Enables tracking of atom origins in reactions (e.g., D₂, ¹³CO, ¹⁵N₂, ¹⁸O₂). | Distinguishing ER from LH pathways in TPRS and beam experiments. |
| Seeded Molecular Beam Source | Generates supersonic beams with tunable kinetic energy (0.05-2 eV). | Probing the energy dependence of sticking and reaction, identifying precursor states. |
| UHV-Compatible Temperature Controller | Allows precise surface temperature control from 30 K to 1500 K. | Measuring temperature-dependent sticking coefficients and performing TPRS. |
| Quartz Crystal Microbalance (QCM) | Measures mass changes (ng/cm²) on a surface in real-time. | Studying precursor film formation and soft adsorption of biomolecules in liquid or gas phase. |
| Functionalized Nanoparticles (e.g., Au-Pd Core-Shell) | High-surface-area model catalysts with controlled interfaces. | Studying hybrid mechanisms in realistic, high-pressure catalytic environments. |
| Microkinetic Modeling Software (e.g., CATKINAS, ZACROS) | Computational tools for fitting complex reaction networks to experimental data. | Deconvoluting contributions of parallel ER, LH, and precursor pathways from overall kinetics. |
Within the domain of heterogeneous catalysis and surface science, the selection of a kinetic model is a critical determinant of research validity. This guide is framed within a broader thesis examining the Eley-Rideal (ER) mechanism versus the Langmuir-Hinshelwood (LH) mechanism. The core distinction lies in the sequence of adsorption and reaction:
- Eley-Rideal: A reactant from the gas or liquid phase directly reacts with an adsorbed species.
- Langmuir-Hinshelwood: Both reactants adsorb onto the catalyst surface before reacting with each other.
Choosing the incorrect model can lead to erroneous rate constants, misleading activation energies, and flawed reactor design. This framework provides a systematic approach for researchers, particularly in drug development where catalytic processes are used in synthetic chemistry and biochemical surface interactions, to select the appropriate model for their system.
Core Mechanistic Comparison and Quantitative Data
The fundamental assumptions, rate laws, and diagnostic criteria for each mechanism are summarized below.
Table 1: Comparative Analysis of Eley-Rideal and Langmuir-Hinshelwood Mechanisms
| Aspect | Eley-Rideal (ER) Mechanism | Langmuir-Hinshelwood (LH) Mechanism |
|---|---|---|
| Core Premise | Direct reaction between a gaseous/liquid molecule (A) and an adsorbed species (B*). | Reaction between two adjacent adsorbed species (A* and B*) on the surface. |
| Reaction Sequence | A(g) + B* → AB* → Products | A(g) ⇌ A; B(g) ⇌ B; A* + B* → AB* → Products |
| Typical Rate Law | ( r = k KB PA PB / (1 + KB P_B) ) | ( r = k KA KB PA PB / (1 + KA PA + KB PB)^2 ) |
| Rate Dependence | Linear in one reactant pressure, saturates in the other. | Exhibits a maximum with respect to reactant pressures. |
| Key Diagnostic | Reaction rate may be significant even at very low coverage of one reactant. | Reaction rate goes to zero if coverage of either reactant is zero. |
| Common Systems | Reactions involving highly mobile or weakly adsorbed species (e.g., H atoms). | Most common for two co-adsorbed molecular species. |
Table 2: Experimental Observables for Model Discrimination
| Experimental Test | Result Indicative of ER | Result Indicative of LH |
|---|---|---|
| Variation of Rate with PA (PB fixed high) | Rate becomes independent of PA. | Rate decreases after a maximum (inhibition). |
| Surface Coverage Measurement | Reaction proceeds even with trace coverage of B*. | Reaction rate correlates with product of coverages (θA * θB). |
| Isotopic Transient Labeling | Immediate product formation upon introduction of labeled gas. | Delay in labeled product formation due to adsorption/desorption steps. |
| Activation Energy Trend | Often less sensitive to changes in surface coverage. | Can vary significantly with coverage due to adsorbate-adsorbate interactions. |
Experimental Protocols for Model Discrimination
Protocol 1: Steady-State Kinetic Interruption Test
Objective: To distinguish between ER and LH by observing system response after abrupt removal of one reactant.
- Establish a steady-state reaction condition with both reactants A and B flowing over the catalyst.
- Using a rapid-switching valve, completely cut off the flow of reactant A while maintaining flow of B and inert carrier gas.
- Monitor product formation in real-time using mass spectrometry or FTIR.
- Interpretation: An immediate drop in product formation to zero suggests an LH mechanism (requires both adsorbed species). A gradual decay in product formation suggests an ER mechanism, where gas-phase A continues to react with residual adsorbed B* until it is depleted.
Protocol 2: In-Situ Surface Coverage vs. Rate Correlation
Objective: To correlate reaction rate with directly measured surface coverages.
- Employ a system equipped with in-situ spectroscopic tools (e.g., Polarization-Modulation Infrared Reflection Absorption Spectroscopy (PM-IRRAS) for relevant adsorbates).
- Under reaction conditions, simultaneously measure the infrared signal of a key adsorbed intermediate (e.g., CO* for oxidation) and the product formation rate (via online GC/MS).
- Systematically vary the partial pressure of one reactant (e.g., O₂) while holding the other (e.g., CO) constant.
- Interpretation: If the rate is proportional to the product of the coverages of two distinct adsorbed species (θCO * θO), an LH mechanism is supported. If the rate is proportional to the coverage of only one adsorbed species and the gas-phase pressure of another, an ER mechanism is indicated.
Visualization of Mechanisms and Decision Logic
Decision Logic for Model Selection (100 chars)
ER vs. LH Core Reaction Pathways (99 chars)
The Scientist's Toolkit: Research Reagent Solutions
Table 3: Essential Materials for Kinetic Model Discrimination Experiments
| Item | Function in Experiments |
|---|---|
| Model Catalyst Wafers (e.g., Pt(111), Pd/SiO₂) | Well-defined, reproducible surfaces for fundamental mechanistic studies, allowing precise control of active sites. |
| Calibrated Mass Flow Controllers (MFCs) | Provide precise, stable, and adjustable flows of reactants (A, B) and inert gases (He, Ar) for kinetic measurements. |
| Rapid-Injection/Switch Valves (Microsecond) | Enable the transient experiments (e.g., isotopic switching, pulse injection) crucial for distinguishing mechanistic steps. |
| In-Situ Spectroscopy Cell (ATR-IR, PM-IRRAS) | Allows real-time monitoring of surface adsorbates and intermediates under actual reaction conditions (in operando). |
| Isotopically Labeled Reactants (e.g., ¹⁸O₂, D₂) | Critical tracers for following specific reaction pathways and measuring surface residence times via transient experiments. |
| Quadrupole Mass Spectrometer (QMS) with Fast Response | Provides real-time, quantitative analysis of gas-phase composition during transient and steady-state kinetic experiments. |
| Temperature-Programmed Desorption (TPD) System | Characterizes adsorption strength, binding states, and surface coverage of reactants/intermediates. |
Conclusion
The Langmuir-Hinshelwood and Eley-Rideal mechanisms provide essential, complementary frameworks for understanding surface-mediated reactions. While LH often dominates in systems with strong adsorbate-adsorbate interactions and high coverage, ER can be critical in low-coverage regimes or with highly reactive gas-phase species. For biomedical researchers, the choice and correct application of these models are paramount for rational design—from developing novel heterogeneous catalysts for API synthesis to engineering targeted nanotherapeutics and biosensing interfaces. Future directions point towards the increased study of non-ideal, dynamic surfaces under realistic conditions, the role of hybrid mechanisms, and the integration of advanced computational screening with high-throughput experimentation. Mastering these kinetic concepts is a cornerstone for innovation in catalytic medicinal chemistry and the development of next-generation, surface-based biomedical technologies.