Precision Contact Lens Development: How AFM Measures Surface Modulus for Enhanced Comfort and Drug Delivery
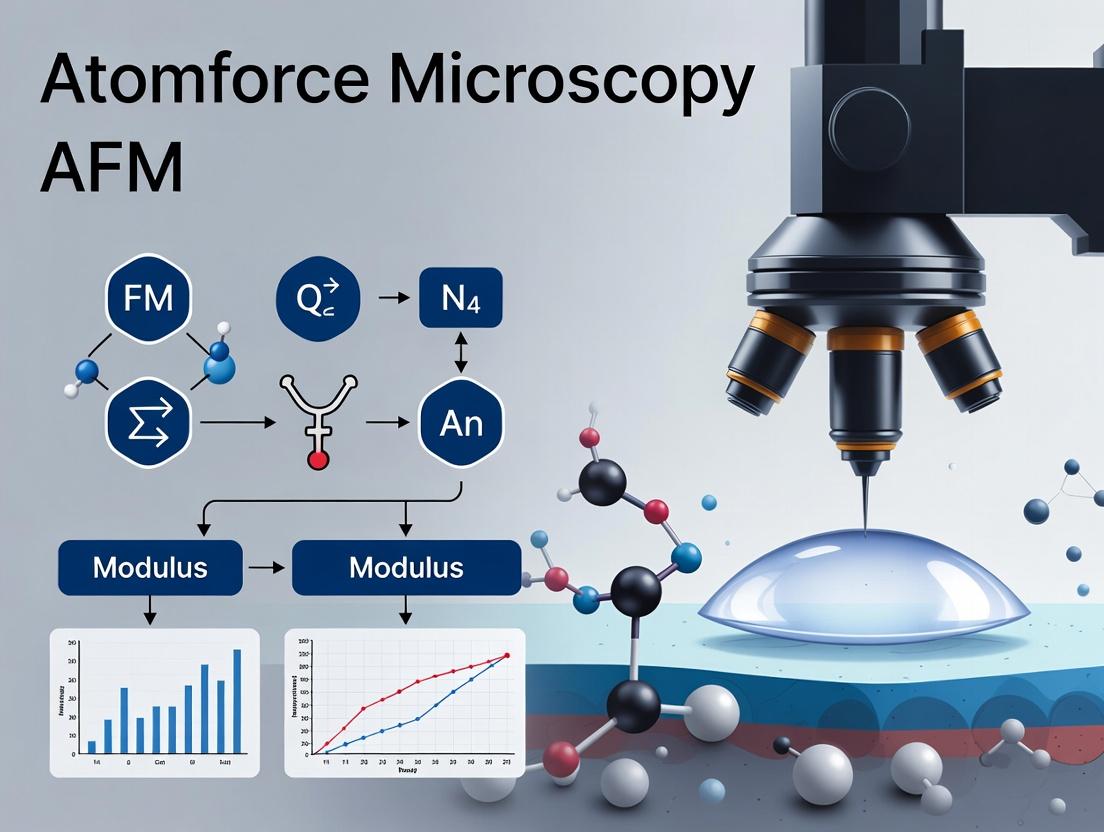
This article provides researchers and development professionals with a comprehensive guide to Atomic Force Microscopy (AFM) for characterizing the surface mechanical properties of contact lenses.
Precision Contact Lens Development: How AFM Measures Surface Modulus for Enhanced Comfort and Drug Delivery
Abstract
This article provides researchers and development professionals with a comprehensive guide to Atomic Force Microscopy (AFM) for characterizing the surface mechanical properties of contact lenses. We explore the fundamental principles linking surface modulus to critical lens performance factors, including comfort, oxygen permeability, and drug-eluting efficiency. A detailed methodological framework covers sample preparation, measurement modes, and data analysis. We address common troubleshooting challenges and optimization strategies for reliable nanomechanical mapping. Finally, we validate AFM's role by comparing it with other techniques and discussing its indispensable contribution to advancing next-generation, high-performance ophthalmic biomaterials.
Why Surface Modulus Matters: The Critical Role of Nanomechanics in Contact Lens Performance
Within the broader thesis on Atomic Force Microscopy (AFM) for contact lens research, defining and measuring the Surface Modulus is paramount. It is the localized elastic response of the outermost material layer, distinct from the bulk modulus, governing critical interactions at the biological interface. For contact lenses, this parameter directly influences corneal epithelial cell adhesion, protein deposition, lens comfort, and overall biocompatibility. This application note details the protocols for precise nanomechanical mapping of contact lens surfaces using AFM.
Key Concepts & Quantitative Data
Surface modulus, often reported as Reduced Young's Modulus (Er) or Elastic Modulus (E), is derived from force-distance spectroscopy. The following table summarizes typical modulus ranges for various contact lens materials.
Table 1: Representative Surface Modulus of Contact Lens Materials
| Material Class | Example Polymers | Typical Surface Modulus (MPa) Range | Key Characteristics |
|---|---|---|---|
| Silicone Hydrogels | Lotrafilcon A, Senofilcon A | 0.5 - 2.5 | High oxygen permeability, modulus varies with hydration. |
| Conventional Hydrogels | Etafilcon A, Polymacon | 0.3 - 1.5 | High water content, generally softer. |
| Rigid Gas Permeable (RGP) | Fluorosilicone Acrylate | 500 - 2000 | High modulus, requires adaptation. |
Table 2: AFM Probe Parameters for Modulus Measurement
| Probe Type | Cantilever Spring Constant (k) Range | Tip Radius (Nominal) | Typical Use Case |
|---|---|---|---|
| Silicon Nitride (DNP) | 0.06 - 0.12 N/m | 20 nm | Soft hydrogels in fluid. |
| Diamond-Coated Silicon | 1 - 5 N/m | < 50 nm | Stiffer RGP materials. |
| Colloidal Probe | 0.1 - 5 N/m | 1-5 µm | Macro-scale surface averaging. |
Experimental Protocols
Protocol 1: Sample Preparation & Hydration
- Lens Conditioning: Using sterile tweezers, place the as-received contact lens in 10 mL of fresh phosphate-buffered saline (PBS) for 24 hours at room temperature to achieve equilibrium hydration.
- Immobilization: For spherical lenses, place the lens on a custom-made, slightly smaller concave polydimethylsiloxane (PDMS) holder filled with PBS. For flat analysis, a 5 mm diameter section may be microtomed and glued to a glass slide using a cyanoacrylate adhesive, ensuring the surface of interest is facing up.
- Mounting: Secure the sample holder onto the AFM magnetic steel puck. Ensure the lens surface is fully submerged under PBS during all measurements to prevent dehydration.
Protocol 2: AFM Calibration & Force Spectroscopy
- Thermal Tune: Perform the thermal noise method in fluid to calibrate the exact spring constant (k) of the cantilever.
- Deflection Sensitivity: Obtain the inverse optical lever sensitivity (InvOLS) by engaging on a clean, rigid sapphire surface in PBS.
- Force Curve Acquisition:
- Set trigger threshold to 1-10 nN.
- Set approach/retract velocity to 0.5 - 1 µm/s to minimize hydrodynamic effects.
- Acquire a grid of force curves (e.g., 64x64 points) over a selected scan area (e.g., 10x10 µm²).
- Maintain a minimum of 500 data points per curve.
Protocol 3: Data Analysis with Sneddon's Model
- Baseline & Contact Point: Subtract the baseline slope and identify the contact point for each force curve.
- Model Fitting: Fit the extend curve's contact portion using the appropriate contact mechanics model. For a conical tip (pyramidal geometry), the Sneddon model is applied:
- F = (2/π) * (E/(1-ν²)) * tan(α) * δ² where F is force, E is Young's Modulus, ν is Poisson's ratio (assumed ~0.5 for hydrated polymers), α is the half-opening angle of the tip, and δ is the indentation depth.
- Map Generation: Calculate the modulus for each force curve to construct a 2D spatial modulus map (Young's Modulus, E).
The Scientist's Toolkit: Research Reagent Solutions
| Item | Function in Experiment |
|---|---|
| Phosphate-Buffered Saline (PBS), pH 7.4 | Maintains physiological ionic strength and lens hydration during measurement. |
| Calibrated AFM Cantilevers (e.g., Bruker DNP-S10) | Silicon nitride probes with low spring constant for soft material indentation in fluid. |
| Custom PDMS Sample Holders | Provides a stable, conformal base to immobilize curved contact lenses without strain. |
| Sapphire Reference Disc | An ultra-rigid, atomically smooth surface for calibrating deflection sensitivity. |
| Atomic Force Microscope with Liquid Cell | Enables high-resolution force mapping in a fully hydrated environment. |
| NanoScope Analysis or Gwyddion Software | For processing raw force-volume data and fitting mechanical models. |
Visualization: Experimental Workflow
Title: AFM Surface Modulus Measurement Workflow
Title: From Force Curve to Modulus Map
The Link Between Modulus, On-Eye Comfort, and Epithelial Interaction
Within the broader thesis on Atomic Force Microscopy (AFM) for contact lens surface modulus measurement, this application note establishes the critical link between the elastic modulus of a contact lens material, its interaction with the corneal epithelium, and the resultant subjective sensation of on-eye comfort. The mechanical properties of the lens surface, quantified by AFM, are a primary determinant of biological interaction, influencing friction, epithelial cell health, and ultimately, patient tolerance.
Table 1: Modulus Ranges and Associated Comfort Parameters for Common Lens Materials
| Material Class | Typical Modulus (MPa) - AFM Nanoindentation | Coefficient of Friction (vs. epithelial mimic) | Relative Comfort Score (1-10) from Clinical Studies | Key Epithelial Response Marker (IL-8 Release) |
|---|---|---|---|---|
| Conventional Hydrogel (e.g., pHEMA) | 0.5 - 1.2 | 0.25 - 0.40 | 6.2 ± 1.5 | High (100% Baseline) |
| Silicone Hydrogel (1st Gen) | 0.7 - 1.5 | 0.30 - 0.50 | 6.8 ± 1.3 | Moderate-High (85%) |
| Silicone Hydrogel (2nd Gen+) | 0.4 - 0.8 | 0.15 - 0.28 | 8.5 ± 1.1 | Low-Moderate (45%) |
| Water Gradient Lens Surface | 0.1 - 0.3 (surface) | 0.05 - 0.15 | 9.1 ± 0.8 | Very Low (15%) |
Table 2: AFM-Derived Modulus Correlation with Cellular Outcomes In Vitro
| AFM Modulus (kPa) | Epithelial Cell Viability (%) | Apoptosis Marker (Caspase-3) Expression | F-Actin Stress Fiber Formation |
|---|---|---|---|
| 50 - 100 | 98 ± 2 | Negligible | Minimal |
| 200 - 500 | 85 ± 5 | Low | Moderate |
| 800 - 1200 | 65 ± 8 | High | Extensive |
| > 1500 | 40 ± 10 | Very High | Severe Cytoskeletal Disruption |
Detailed Experimental Protocols
Protocol 3.1: AFM Nanoindentation for Surface Modulus Mapping
Objective: To spatially map the reduced elastic modulus (Er) of a contact lens surface in a hydrated state. Materials: Atomic Force Microscope with fluid cell, soft colloidal probe (e.g., 5μm silica sphere, k ≈ 0.1 N/m), phosphate-buffered saline (PBS), contact lens samples (hydrated for 24h in PBS). Procedure:
- Probe Calibration: Perform thermal tune in air to determine the precise spring constant (k) of the cantilever.
- Sample Mounting: Secure the fully hydrated lens on a glass slide using a custom fluid cell holder. Ensure the area of interest is fully submerged in PBS.
- Approach & Engagement: Approach the probe to the surface in fluid at a controlled speed of 1 μm/s. Set a trigger force of 0.5 nN.
- Force Curve Acquisition: Program a 5x5 μm grid (25 points). At each point, acquire a force-distance curve with the following parameters: extend/retract speed = 1 μm/s, Z-range = 500 nm, data points = 512.
- Data Analysis: Fit the retract portion of each force curve using the Hertzian contact model for a spherical indenter. Calculate Er for each point. Generate a 2D modulus map and report average ± SD. Critical Note: Use at least 3 lenses per material type, with 3 maps per lens.
Protocol 3.2:In VitroFriction Coefficient Measurement Using a Corneal Epithelial Mimic
Objective: To quantify the coefficient of friction between the lens material and a layer of corneal epithelial cells. Materials: AFM with lateral force module (or tribometer), live human corneal epithelial (HCE) cell layer cultured on a rigid substrate, hydrated lens sample, cell culture medium (37°C). Procedure:
- Cell Layer Preparation: Culture HCE cells to confluency on a 35mm dish. Use cells at passage 3-5.
- Lens Mounting: Fix the hydrated lens onto a flat, rigid cylindrical mount using cyanoacrylate glue, ensuring the test surface is exposed.
- System Setup: Mount the cell culture dish on the AFM/tribometer stage with temperature control (37°C). Mount the lens probe on the force sensor.
- Friction Loop Acquisition: Apply a constant normal load of 10 nN (AFM) or 0.1 mN (tribometer). Scan the lens probe laterally across the cell layer for a distance of 10 μm at 5 μm/s. Record both normal (FN) and lateral (FL) forces.
- Calculation: The coefficient of friction (μ) is calculated from the slope of FL vs. FN plot over at least 10 scans. μ = (FL / FN).
Protocol 3.3: Assessment of Epithelial Cell Inflammatory Response
Objective: To measure interleukin-8 (IL-8) release from HCE cells after direct interaction with lens materials of varying modulus. Materials: 12-well Transwell inserts, HCE cells, test lens materials (6mm discs, sterilized), ELISA kit for human IL-8, cell culture incubator. Procedure:
- Co-culture Setup: Seed HCE cells in the lower chamber of a 12-well plate (2x10^5 cells/well). Place sterilized lens discs in Transwell inserts and lower them into the wells, ensuring no direct contact with cells but allowing free exchange of secreted factors.
- Incubation: Culture for 24 hours at 37°C, 5% CO2.
- Sample Collection: Remove the inserts. Centrifuge the conditioned medium from the lower chamber at 1000xg for 10 min to remove debris. Collect supernatant.
- ELISA Analysis: Perform IL-8 ELISA on the supernatant according to the manufacturer's protocol. Normalize IL-8 concentration to total cellular protein from corresponding wells (via BCA assay).
- Correlation: Plot normalized IL-8 release (pg/μg protein) against the AFM-measured modulus of the corresponding lens disc.
Diagrams
Diagram 1: Mechanotransduction Pathway Linking Modulus to Inflammation
Diagram 2: AFM Workflow for Modulus-Comfort Correlation
The Scientist's Toolkit: Research Reagent Solutions
Table 3: Essential Materials for Modulus-Epithelial Interaction Research
| Item Name | Function & Application | Critical Notes |
|---|---|---|
| Soft Colloidal AFM Probe (e.g., 5μm SiO₂ sphere) | Enables accurate Hertzian modeling for modulus measurement on soft, hydrated materials. | Ensure spring constant is <0.5 N/m; calibrate for each experiment. |
| Hydrated AFM Fluid Cell | Maintains lens and biological samples in a physiologically relevant aqueous environment during scanning. | Must be chemically inert; use with degassed PBS to avoid bubble artifacts. |
| Human Corneal Epithelial (HCE) Cell Line (e.g., HCEC, ATCC CRL-11135) | Standardized in vitro model for assessing epithelial health, friction, and inflammatory response. | Use low passage numbers; validate barrier function for friction studies. |
| IL-8 (CXCL8) ELISA Kit | Quantifies the primary inflammatory cytokine released by epithelial cells in response to mechanical stress. | Choose high-sensitivity kit; always normalize to total protein content. |
| Live-Cell Staining Dyes (e.g., Phalloidin-FITC, DAPI, Annexin V-FITC) | For visualizing cytoskeletal (F-actin) changes, nuclei, and apoptosis in response to lens modulus. | Perform staining post-interaction under fixation or in live-cell chambers. |
| Artificial Tear Solution | Provides a physiologically relevant lubricating fluid for friction testing, mimicking the ocular environment. | Use a standardized formula (e.g., containing mucins, lipids, salts) for consistency. |
| Tribometer with Bio-Cell | Alternative to AFM for macroscale friction measurement under controlled temperature and humidity. | Ideal for longer-duration sliding tests to simulate wear. |
Within the broader thesis investigating Atomic Force Microscopy (AFM) for contact lens surface modulus measurement, this document details the critical interplay between surface mechanical properties, oxygen transmissibility, and tear film stability. The central hypothesis posits that the nanoscale modulus of a contact lens material, as characterized by AFM, directly influences its surface wettability and protein/lipid deposition. This, in turn, modulates both oxygen permeability (Dk) and the kinetics of tear film rupture, impacting clinical comfort and ocular health. These application notes provide protocols to quantify these relationships.
Core Quantitative Data
Table 1: Key Material Properties of Common Contact Lens Polymers
| Material (USAN) | Water Content (%) | Oxygen Permeability (Dk, barrers) | Typical Surface Modulus (AFM, MPa)* | Key Tear Film Stability Metric (Pre-lens TBUT, sec) |
|---|---|---|---|---|
| HEMA | 38 | 9 | 0.8 - 1.2 | 5 - 10 |
| Silicone Hydrogel (Lotrafilcon B) | 33 | 110 | 0.7 - 1.0 | 8 - 15 |
| Silicone Hydrogel (Senofilcon A) | 38 | 103 | 0.5 - 0.8 | 10 - 18 |
| PMMA | <1 | 0 | 1500 - 2000 | <5 |
| *Data synthesized from recent literature and ISO standards. AFM modulus is highly dependent on hydration state and measurement technique. |
Table 2: Impact of Surface Deposits on Functional Properties
| Deposit Type | Measured Increase in Surface Modulus (AFM) | Reduction in Effective Dk (%) | Reduction in Pre-lens TBUT (%) |
|---|---|---|---|
| Lysozyme | 15-25% | 5-10% | 20-30% |
| Lipid-Mucin Complex | 30-50% | 15-25% | 40-60% |
| Denatured Protein Layer | 50-100% | 20-35% | 50-70% |
Experimental Protocols
Protocol 1: Correlative AFM Nanoindentation and Oxygen Permeability Measurement
Objective: To correlate the local surface elastic modulus of a contact lens material with its bulk oxygen transmissibility (Dk/t).
Materials:
- Hydrated contact lens sample
- Atomic Force Microscope with fluid cell
- Spherical colloidal probe (radius 5-10 µm) or standard silicon nitride tip
- Oxygen Permeometer (e.g., polarographic or coulometric system)
- Phosphate Buffered Saline (PBS), pH 7.4
Procedure:
- Sample Preparation: Hydrate lens in PBS for ≥24 hours. For AFM, secure a ~5x5 mm section onto a glass slide using a minimal amount of cyanoacrylate adhesive at the very edges, ensuring the central measurement zone is fully hydrated and unobstructed.
- AFM Nanoindentation: a. Mount the sample in the fluid cell, immerse in PBS. b. Calibrate the AFM cantilever sensitivity and spring constant. c. Perform force-distance spectroscopy over a 10x10 grid on a 50x50 µm area. Apply a minimum force of 1 nN and a maximum force of 10 nN to avoid plastic deformation. d. Use the Hertzian contact model (for spherical probe) or Sneddon model (for pyramidal tip) to calculate the reduced elastic modulus (Er) at each point. e. Calculate the mean and standard deviation of the surface modulus from the grid.
- Oxygen Permeability: a. Following AFM, equilibrate a separate, intact lens in PBS. b. Mount the lens in the permeometer cell according to ISO 18369-4:2017. c. Measure the oxygen flux (Dk) at 35±0.5°C. Calculate the oxygen transmissibility (Dk/t) by dividing by the central lens thickness.
- Data Correlation: Plot the mean surface modulus (y-axis) against the measured Dk/t (x-axis) for different lens materials.
Protocol 2: In Vitro Tear Film Break-Up Time (TFBUT) Simulation
Objective: To assess the stability of an artificial tear film on a lens surface with characterized modulus.
Materials:
- AFM-characterized lens samples
- In vitro TFBUT apparatus (temperature-controlled chamber, high-speed camera, micropipette)
- Artificial Tear Solution (ATS) with surfactants (e.g., poloxamer) and lipids
- Fluorescein dye (0.1% in ATS)
Procedure:
- Surface Pre-characterization: Determine the surface modulus of the lens sample using Protocol 1, Step 2.
- Film Deposition: Place the lens sample on the heated stage (34°C). Apply 5 µL of fluorescein-labeled ATS to the lens center.
- Evaporation & Imaging: Initiate a gentle, controlled airflow (0.5 L/min, 30% RH) over the lens surface. Simultaneously, record the film using a high-speed camera (50 fps) under blue excitation light.
- Break-Up Analysis: Analyze the video for the appearance of the first random dry spot. The time from the cessation of blinking (simulated by film deposition and spread) to the first dry spot is recorded as the in vitro TFBUT. Perform n=10 replicates.
- Correlation: Correlate in vitro TFBUT values with the pre-measured AFM surface modulus and oxygen permeability (Dk) of the material.
The Scientist's Toolkit: Research Reagent Solutions
Table 3: Essential Materials for Surface and Transport Studies
| Item | Function in Research |
|---|---|
| Artificial Tear Solution (ATS) | Simulates the ionic strength, pH, and surfactant properties of human tears for in vitro wettability and deposition studies. |
| Lysozyme from Human Tears | Model protein for studying competitive adsorption and formation of fouling layers that impact modulus and Dk. |
| Fluorescein Sodium Salt | Vital dye used in in vitro TFBUT protocols to visualize tear film thinning and rupture via fluorescence. |
| Phosphate Buffered Saline (PBS), pH 7.4 | Standard hydration and rinsing medium to maintain physiological conditions during AFM and permeometry. |
| Poloxamer 407 | Non-ionic surfactant used in ATS formulations to mimic the interfacial tension-lowering effects of natural tear surfactants. |
Visualization Diagrams
Diagram 1: AFM-Lens Research Thesis Workflow
Diagram 2: Surface Modulus Impact on Tear Film Stability
This application note is framed within a broader thesis research project utilizing Atomic Force Microscopy (AFM) nanoindentation to characterize the surface mechanical properties (elastic modulus) of hydrogel-based ophthalmic materials. The core hypothesis is that the localized surface modulus of a contact lens material is a critical, yet often overlooked, physicochemical parameter that directly influences the adsorption (loading) and subsequent release kinetics of therapeutic agents in drug-eluting lens (DEL) systems. This document synthesizes current research to outline experimental protocols and data interpretation linking AFM-derived modulus data to drug delivery performance.
Table 1: Influence of Hydrogel Modulus on Drug Loading Capacity (Theoretical Model Data)
| Material Type (Example) | Avg. Surface Modulus (kPa) [AFM] | Drug Loaded (µg/lens) | Loading Mechanism | Key Finding |
|---|---|---|---|---|
| Silicone Hydrogel (High Modulus) | 1800 ± 150 | 45 ± 5 | Partitioning into hydrophobic domains | Higher modulus correlates with lower equilibrium loading of hydrophilic drugs. |
| pHEMA-based (Medium Modulus) | 700 ± 80 | 120 ± 10 | Bulk hydrogel swelling | Optimal modulus range for balanced water content and network stability maximizes loading. |
| Plasma-treated pHEMA (Lower Surface Modulus) | 400 ± 60 | 85 ± 8 | Surface adsorption | Reduced surface modulus increases adsorption but may lead to burst release. |
Table 2: Correlation of Modulus with Drug Release Kinetics Parameters
| Experimental Group | Elastic Modulus (kPa) | Release Medium | t50 (hours) | Release Exponent (n) | Dominant Release Mechanism |
|---|---|---|---|---|---|
| Group A (High Crosslink) | 1500 | Simulated Tear Fluid | 8.2 | 0.45 | Fickian diffusion |
| Group B (Med Crosslink) | 750 | Simulated Tear Fluid | 24.5 | 0.89 | Anomalous transport |
| Group C (Low Crosslink) | 350 | Simulated Tear Fluid | 2.1 | 0.92 | Swelling-controlled |
Detailed Experimental Protocols
Protocol 3.1: AFM Nanoindentation for Surface Modulus Mapping of Hydrated Lenses Objective: To spatially map the reduced elastic modulus (Er) of a hydrated drug-eluting lens under physiologically relevant conditions. Materials: See "Scientist's Toolkit" below. Procedure:
- Sample Preparation: Using a biopsy punch, cut a 5mm diameter disk from the lens central optic zone. Hydrate in PBS (pH 7.4) for 24h at 4°C to reach equilibrium swelling.
- AFM Mounting: Place the hydrated disk on a glass-bottom Petri dish. Secure minimally with vacuum grease to prevent drift but avoid compression. Immediately cover with PBS to maintain full hydration.
- Cantilever Selection & Calibration: Use a spherical colloidal probe (tip radius ~5µm) on a soft cantilever (nominal k ≈ 0.1 N/m). Perform thermal tune in fluid to determine exact spring constant.
- Force Mapping: Program a 256-point grid over a 50µm x 50µm area. Set maximum trigger force to 2nN, approach/retract speed to 2µm/s, and dwell time at maximum load to 0.1s.
- Data Analysis: For each force-displacement curve, fit the retract curve with the Hertzian contact model for a spherical indenter. Export the calculated Er value for each point to generate a 2D modulus map and histogram.
Protocol 3.2: In-Vitro Drug Loading and Release Kinetics Correlated to Modulus Objective: To quantify drug loading efficiency and release profile of lenses characterized by Protocol 3.1. Materials: Model drug (e.g., Fluorescein sodium or Ketotifen fumarate), PBS, Franz diffusion cells, UV-Vis Spectrophotometer or HPLC. Procedure:
- Pre-characterization: Map the modulus of lenses from the same manufacturing batch per Protocol 3.1. Group lenses by similar average surface modulus.
- Drug Loading: Immerse each lens in 2.0 mL of drug solution (e.g., 1 mg/mL in PBS) at 34°C for 48h. Calculate loading amount by measuring solution depletion via absorbance/concentration.
- Release Study: Place loaded lens in a Franz cell receptor chamber filled with PBS (34°C, continuous stirring). Withdraw 300µL aliquots from the receptor at predetermined times (e.g., 0.5, 1, 2, 4, 8, 24, 48h) and replace with fresh PBS.
- Kinetic Modeling: Quantify drug in aliquots. Plot cumulative release vs. time. Fit data to the Korsmeyer-Peppas model:
M_t / M_∞ = k * t^n. Determine the release exponentnand rate constantk. Correlatekandnwith the AFM-derived average modulus.
Visualizing the Mechanistic Relationship
Title: Modulus Impact on Drug Delivery Pathway
Title: Combined AFM-Release Kinetics Workflow
The Scientist's Toolkit: Essential Research Reagents & Materials
| Item | Function in Research | Example/Specification |
|---|---|---|
| AFM with Fluid Cell | Enables nanomechanical measurement of soft, hydrated samples in a physiological environment. | Must have temperature control and low-noise capabilities for force spectroscopy. |
| Colloidal Probe Cantilevers | Spherical tips prevent sample damage and enable application of Hertzian contact models. | Silica or polystyrene sphere (Ø2-10µm) attached to tipless cantilever (k~0.01-0.5 N/m). |
| Simulated Tear Fluid (STF) | Physiologically relevant release medium for in-vitro studies. | pH 7.4, containing ions, bicarbonate, and proteins like lysozyme. |
| Franz Diffusion Cells | Standard apparatus for measuring drug permeation/ release kinetics across/from a membrane. | Vertical cells with small volume (3-5mL) receptor chamber and temperature-controlled jacket. |
| HPLC System with UV/FLD | For precise quantification of drug concentration in release samples, especially for complex matrices. | Enables separation and detection of drugs and potential degradation products. |
| Model Ophthalmic Drugs | Representative compounds for proof-of-concept studies. | Hydrophilic: Fluorescein, Timolol. Hydrophobic: Cyclosporine A, Dexamethasone. |
| Hydrogel Lens Materials | Varied modulus test substrates. | pHEMA, silicone hydrogels, and copolymers with different crosslinking densities. |
Application Notes
This document serves as a primer on key contact lens material classes, contextualized within research employing Atomic Force Microscopy (AFM) for surface modulus characterization. Understanding the bulk and surface mechanical properties of these materials is critical for evaluating lens performance, comfort, and biocompatibility in ocular drug delivery and vision correction applications.
Hydrogel Lenses: Composed of cross-linked, water-absorbing polymers like poly-HEMA. High water content (typically 38%-70%) governs oxygen permeability (Dk), which is proportional to water content. Their low modulus (~0.3-1.5 MPa) provides initial comfort but allows for protein and lipid deposition. AFM studies reveal surface modulus heterogeneity due to hydrogel mesh structure, impacting drug-eluting matrix design.
Silicone Hydrogel Lenses: Incorporate siloxane (silicone) moieties to achieve high oxygen permeability (Dk > 70) independent of water content. A phase-separated microstructure consists of hydrophobic silicone regions and hydrophilic hydrogel phases. This creates a modulus gradient from bulk to surface, often addressed with surface treatments (e.g., plasma coating). AFM nanoindentation is essential to map these nanoscale modulus variations, which influence tear film interaction and drug release kinetics.
Rigid Gas Permeable (RGP) Lenses: Composed of silicone-acrylate or fluoro-silicone-acrylate copolymers. They are inherently rigid, with a high modulus (~1000-2000 MPa), offering optical stability. Their gas permeability derives from silicone content. Surface wettability is modified via plasma treatment or incorporation of methacrylic acid. AFM force spectroscopy is used to measure surface stiffness and adhesion forces critical for on-eye movement and epithelial interaction.
Table 1: Key Material Properties of Contact Lens Classes
| Property | Conventional Hydrogel | Silicone Hydrogel | Rigid Gas Permeable (RGP) |
|---|---|---|---|
| Primary Materials | Poly-HEMA, HEMA copolymers | Siloxane methacrylates, Hydrophilic monomers | Silicone acrylate, Fluoro-silicone acrylate |
| Water Content (%) | 38 - 70 | ~20 - 60 | <1 |
| Oxygen Permeability (Dk) | ~10 - 40 | ~70 - 180 | ~30 - 200 |
| Typical Young's Modulus (MPa) | 0.3 - 1.5 | 0.5 - 1.2 | 1000 - 2000 |
| Key Surface Characteristic | Homogeneous hydrogel mesh | Phase-separated, often coated | Hard, requires wetting agents |
| Primary AFM Measurement Focus | Swelling-dependent modulus, adhesion maps | Nanoscale phase modulus mapping, coating integrity | Surface stiffness, microscopic roughness |
Table 2: AFM-Derived Surface Modulus Ranges (Representative Data)
| Material Class | Example Material | AFM Mode | Reported Surface Modulus (MPa) | Notes |
|---|---|---|---|---|
| Hydrogel | Poly-HEMA (38% water) | Nanoindentation | 0.45 ± 0.10 | Sensitive to hydration state |
| Silicone Hydrogel | Lotrafilcon A | PeakForce QNM | 0.8 - 1.2 (bulk), 1.5 - 2.5 (silicone rich) | Biphasic distribution |
| RGP | Fluoro-silicone acrylate | Force Spectroscopy | 1200 ± 250 | Minimal variation over surface |
Experimental Protocols
Protocol 1: AFM Nanoindentation for Hydrogel Lens Surface Modulus Mapping
Objective: To measure the spatially resolved Young's modulus of a hydrated hydrogel lens surface. Materials: AFM with fluid cell, tipless cantilevers with spherical silica probes (diameter: 2-10 µm), spring constant: ~0.1 N/m, phosphate buffered saline (PBS), sample stage, hydrogel contact lens. Procedure:
- Sample Preparation: Hydrate the lens in PBS for >24 hrs at room temperature. Mount the lens on the fluid cell sample stage using a custom fixture to prevent rolling. Immerse in PBS.
- Probe Calibration: Calibrate the cantilever's spring constant via thermal tune method in fluid. Determine the optical lever sensitivity on a rigid sapphire surface in PBS.
- Indentation Parameters: Set a maximum indentation force of 5-10 nN and indentation depth limit of 500 nm to stay within 10% of sample thickness.
- Mapping: Perform a grid indentation (e.g., 10x10 points over a 10x10 µm area). At each point, acquire a full force-distance curve.
- Data Analysis: Fit the retract curve with the Hertz contact model for a spherical indenter to calculate Young's modulus. Compile all point moduli into a 2D map.
Protocol 2: Phase-Segregation Analysis of Silicone Hydrogel via AFM Tapping Mode
Objective: To visualize the nanoscale phase separation and correlate with modulus differences. Materials: AFM, sharp silicon probe (resonant frequency: ~300 kHz in fluid), silicone hydrogel lens (uncoated), PBS. Procedure:
- Sample Hydration & Mounting: As per Protocol 1, Step 1.
- Imaging Parameters: Engage in tapping mode in fluid. Set a low scan rate (0.5-1 Hz) and a moderate setpoint to maintain light tapping.
- Data Acquisition: Capture simultaneously Height, Amplitude, and Phase images. The phase signal indicates variations in material viscoelasticity.
- Correlative Nanoindentation: On the same area, switch to PeakForce QNM mode to obtain quantitative modulus (DMT modulus) maps.
- Analysis: Overlay phase and modulus maps to assign modulus values to hydrophilic (softer) and silicone-rich (harder) phases.
Protocol 3: Surface Adhesion Force Measurement on RGP Lenses
Objective: To quantify tip-sample adhesion forces on RGP surfaces, correlating with wettability. Materials: AFM with fluid cell, silicon nitride tip (spring constant: ~0.06 N/m), RGP lens, artificial tear solution. Procedure:
- Sample Preparation: Clean the RGP lens according to manufacturer protocol. Mount on stage and immerse in artificial tear solution.
- Force Volume Mapping: Program the AFM to collect a grid of force curves (e.g., 32x32 over 5x5 µm).
- Curve Acquisition: For each point, approach until a trigger force of 1 nN is reached, then retract.
- Adhesion Analysis: Measure the minimum force on the retract curve as the adhesion force (pull-off force). Compile into an adhesion force map.
- Correlation: Compare average adhesion force from multiple lenses with water contact angle measurements.
Diagrams
Diagram Title: AFM Research Workflow for Contact Lens Material Analysis
The Scientist's Toolkit: Essential Research Reagents & Materials
Table 3: Key Research Reagent Solutions for AFM Contact Lens Studies
| Item | Function & Rationale |
|---|---|
| Phosphate Buffered Saline (PBS), pH 7.4 | Standard hydration and imaging medium. Maintains physiological osmolarity and pH, preventing lens dehydration or swelling during AFM analysis. |
| Artificial Tear Solution | Complex fluid mimicking real tear film composition. Used for adhesion and modulus measurements under physiologically relevant conditions. |
| Colloidal AFM Probes (Silica Sphere, 5 µm) | Spherical tips for nanoindentation. Large radius minimizes penetration, provides reliable Hertz model fitting for soft hydrogels. |
| Sharp Silicon AFM Probes (Tapping Mode) | High-resolution tips for imaging surface topography and phase segregation in silicone hydrogels. |
| PeakForce QNM-Enabled Cantilevers | Specialized probes for quantitative nanomechanical mapping, allowing simultaneous topography and modulus imaging. |
| Custom Lens Mounting Fixture | A stable, non-reactive holder (e.g., with a concave well) to immobilize the soft, curved lens in the fluid cell without deformation. |
| Calibration Gratings (e.g., TGZ1, HS-100MG) | Used for verifying AFM scanner accuracy and tip morphology before and after lens experiments. |
| Sodium Hydroxide (0.1M) or Peroxisulfate | For rigorous cleaning of AFM probes and fluid cell components to remove biological contaminants between samples. |
AFM in Action: A Step-by-Step Protocol for Contact Lens Surface Modulus Mapping
Atomic Force Microscopy (AFM) is a cornerstone technique for nanomechanical characterization, particularly in biomaterials research. Within the context of developing and evaluating next-generation contact lenses—where surface modulus directly influences comfort, protein adhesion, and tear film stability—specific AFM operational modes provide critical quantitative data. This note details the application of PeakForce Quantitative Nanomechanical Mapping (QNM), Force Volume, and Nanoindentation for measuring the spatial distribution and absolute values of the elastic modulus on contact lens polymer surfaces.
Core AFM Modes: Principles and Applications
PeakForce QNM
Principle: A high-frequency, force-controlled tapping mode where the tip engages the sample at a set peak force every cycle. The resulting force-distance curve is analyzed in real-time to extract mechanical properties simultaneously with topographical data.
Application in Contact Lens Research: Enables high-resolution, in-situ mapping of modulus heterogeneity across hydrogel or silicone hydrogel surfaces in hydrating fluids, critical for assessing coating uniformity and hydration-dependent stiffness.
Force Volume
Principle: A point-by-point mapping technique where a full force-distance curve is acquired at each pixel in a grid. Post-processing extracts mechanical parameters from each curve.
Application: Provides robust, quantitative datasets for modulus calculation, ideal for validating PeakForce QNM maps on contact lenses and for investigating time-dependent mechanical changes under long-term immersion.
Nanoindentation
Principle: A quasi-static technique involving a single or array of controlled indentation events to significant depths, analyzing the loading-unloading curve via established contact mechanics models (e.g., Oliver-Pharr).
Application: Used for measuring the bulk-effective modulus of contact lens materials, especially for characterizing the substrate beneath thin surface coatings or measuring through hydrated layers.
Quantitative Data Comparison
Table 1: Comparison of Key AFM Modes for Modulus Measurement
| Parameter | PeakForce QNM | Force Volume | Nanoindentation |
|---|---|---|---|
| Data Output | Simultaneous topography & property maps | Topography map + array of force curves | Discrete load-displacement curves |
| Mapping Speed | Very High (1-10 min/frame) | Low (30-120 min/frame) | Medium (for arrays) |
| Lateral Resolution | High (sub-10 nm) | Medium (10-50 nm) | Low (≥ probe radius) |
| Preferred Model | DMT, Sneddon | Hertz, Sneddon, DMT | Oliver-Pharr, Hertz |
| Best For | Real-time hydration dynamics, coating uniformity | Quantitative validation, heterogeneous regions | Bulk property, penetration studies |
| Typical Modulus Range | 1 kPa - 100 GPa | 100 Pa - 10 GPa | 10 MPa - 1 TPa |
| Fluid Compatibility | Excellent (sealed cell) | Excellent | Challenging |
Table 2: Example Modulus Data from Contact Lens Polymers (Hydrated)
| Material Type | PeakForce QNM Modulus (MPa) | Force Volume Modulus (MPa) | Nanoindentation Modulus (MPa) | Notes |
|---|---|---|---|---|
| Conventional Hydrogel (pHEMA) | 1.2 ± 0.3 | 1.1 ± 0.4 | 1.3 ± 0.2 | Homogeneous surface |
| Silicone Hydrogel (Lotrafilcon A) | 8.5 ± 2.1* | 8.1 ± 1.8* | 9.0 ± 1.5 | *Phase-separated structure evident |
| PEG-based Surface Coating | 0.05 ± 0.02 | 0.06 ± 0.01 | N/A | Ultra-soft layer; nanoindentation penetrates to substrate |
Experimental Protocols
Protocol 1: PeakForce QNM of a Hydrated Contact Lens
Objective: To map the nanoscale surface modulus of a silicone hydrogel contact lens in simulated tear fluid (STF).
Materials: See "The Scientist's Toolkit" below.
Procedure:
- Sample Preparation: Using ceramic tweezers, place a sterile, unused contact lens (concave side up) in a fluid cell. Secure edges with a soft O-ring.
- Fluid Introduction: Gently fill the fluid cell with ~1.5 mL of 0.1 µm filtered, degassed STF (pH 7.4). Ensure no air bubbles are trapped.
- Probe Selection & Calibration: Install a silicon nitride ScanAsyst-Fluid+ probe. Perform thermal tune in fluid to determine spring constant (typically 0.6-0.8 N/m). Calibrate deflection sensitivity on a rigid, immersed sapphire surface.
- AFM Engagement: Engage the tip onto a visually flat region of the lens under fluid. Set initial PeakForce setpoint to 100 pN.
- Parameter Optimization:
- Set PeakForce frequency to 1 kHz.
- Adjust the setpoint to achieve ~5-10 nm indentation depth (typically 200-500 pN).
- Select the DMT modulus fitting model in the software.
- Set Poisson's ratio for the sample to 0.45 (approximate for hydrated polymer).
- Mapping: Acquire a 10 µm x 10 µm map at 512x512 resolution.
- Data Processing: Apply a plane-fit to topography. For modulus channel, apply a median filter (3x3 kernel) and use histogram analysis to exclude outliers.
Protocol 2: Force Volume for Modulus Validation
Objective: To acquire a grid of force curves for rigorous modulus calculation on a region of interest identified by PeakForce QNM.
Procedure:
- Region Identification: Using a PeakForce QNM scan, identify a 5 µm x 5 µm area exhibiting modulus heterogeneity.
- Mode Switching: Switch the AFM to Force Volume mode.
- Curve Parameter Setup:
- Set relative trigger threshold to 50 nN.
- Set ramp size to 500 nm.
- Set ramp rate to 1 Hz.
- Set points per curve to 512.
- Grid Acquisition: Acquire a 32x32 grid of force curves over the selected area.
- Offline Analysis (Using Analysis Software):
- Flatten the approach segment of each curve.
- Fit the retract curve with the Hertz/Sneddon model for a spherical indenter.
- Use the known tip radius and Poisson's ratio (0.45).
- Generate a modulus map and compare to PeakForce QNM results.
Protocol 3: Nanoindentation for Bulk Modulus Assessment
Objective: To determine the effective bulk modulus of a contact lens material by statistical indentation.
Procedure:
- Probe Selection: Install a diamond-tipped spherical indenter probe (radius ~1 µm). Calibrate spring constant and area function on a fused quartz standard.
- Sample Mounting: Mount a cross-sectioned lens or a thick, flat piece on a steel substrate using cyanoacrylate, ensuring the surface is level.
- Immersion: If measuring hydrated, add a droplet of STF to cover the sample.
- Array Programming: Program an array of 10x10 indentations spaced 5 µm apart.
- Indentation Parameters:
- Maximum load: 10 µN.
- Loading/unloading rate: 1 µN/s.
- Hold time at peak load: 5 seconds (to assess creep).
- Execution: Run the automated indentation array.
- Data Analysis: Analyze each load-displacement curve using the Oliver-Pharr method. Report modulus as the mean ± standard deviation of all valid indents.
Diagrams
Diagram 1: AFM Mode Selection Workflow for Contact Lens Analysis
Diagram 2: Data Flow in PeakForce QNM Analysis
The Scientist's Toolkit
Table 3: Essential Research Reagent Solutions & Materials
| Item | Function/Benefit | Example Product/Note |
|---|---|---|
| Simulated Tear Fluid (STF) | Maintains physiological hydration and ion balance during in-situ measurement. Prevents drying artifacts. | Prepare per ISO 18369-4, or use commercial artificial tear solution. Must be 0.1 µm filtered. |
| ScanAsyst-Fluid+ Probes | Silicon nitride probes optimized for PeakForce in fluid. Triangular cantilever with reflective coating. | Bruker RFESPA (k ~0.6-0.8 N/m). Consistent spring constant is critical. |
| Spherical Indenter Tips | Defined geometry (R~1-10 µm) for nanoindentation and reliable Hertz model fitting. | Diamond-tipped or silica colloidal probes. |
| Calibration Standards | For probe spring constant, deflection sensitivity, and modulus verification. | Bruker PFQNM-LC (soft) and Sapphire (rigid) for fluid. Fused quartz for nanoindentation. |
| Fluid Cells (Sealed) | Enables stable imaging in liquid, preventing evaporation and vibration. | Bruker Fluid Cell or equivalent with O-rings. |
| Ceramic Tweezers | For handling contact lenses without surface damage or contamination. | Anti-static, non-magnetic. |
| Vibration Isolation Table | Essential for high-resolution nanomechanical mapping. | Active or passive system to dampen ambient noise. |
In the context of Atomic Force Microscopy (AFM) research focused on measuring the surface modulus of contact lenses, sample preparation is the critical determinant of data validity. Improper hydration, unstable mounting, or uncontrolled environmental conditions can induce artifacts, alter material properties, and compromise the correlation between measured modulus and actual in-situ performance. These application notes detail standardized protocols to ensure reliable and reproducible AFM characterization of hydrogel and silicone hydrogel contact lens materials.
Hydration Protocols
Contact lenses are hydrogel materials whose mechanical properties are intrinsically linked to water content. AFM measurement must be performed under conditions that maintain the intended hydration state.
Protocol 1.1: Equilibrium Hydration in Simulated Tear Fluid (STF)
- Objective: To achieve and maintain physiologically relevant hydration.
- Materials:
- Sterile, balanced salt solution or customized Simulated Tear Fluid (e.g., containing ions, lipids, mucins).
- Sterile glass vials or multi-well plates.
- Temperature-controlled shaking incubator (or orbital shaker).
- Procedure:
- Aseptically transfer the contact lens from its primary packaging.
- Immerse the lens in ≥5 mL of pre-warmed (34±1°C) STF per lens in a sterile vial.
- Place vials in a shaking incubator at 34°C, 50 rpm for 24 hours to reach swelling equilibrium.
- For AFM analysis, transfer the lens directly to the AFM fluid cell containing the same hydration medium. Minimize air exposure to less than 5 seconds.
Key Quantitative Data on Hydration Media: Table 1: Common Hydration Media Compositions and Their Impact
| Medium | Osmolarity (mOsm/kg) | pH | Key Components | Primary Use Case |
|---|---|---|---|---|
| Balanced Salt Solution (BSS) | 305±10 | 7.4±0.2 | NaCl, KCl, CaCl₂, MgCl₂, Buffers | Standard hydration for modulus baseline. |
| ISO Standard STF | 310±10 | 7.4±0.2 | BSS + Human Serum Albumin, Lysozyme, Mucin | Mimics protein adsorption and in-vivo surface. |
| Hyperosmolar STF | 380±10 | 7.4±0.2 | Increased NaCl in BSS | Models dry eye conditions. |
Mounting Techniques
Secure, strain-free mounting is essential to prevent sample drift or deformation during AFM scanning.
Protocol 2.1: Non-Adhesive, Fluid-Cell Mounting for Hydrogels
- Objective: To immobilize a hydrated contact lens without chemical adhesion or compression.
- Materials:
- AFM fluid cell with a glass or mica bottom.
- Custom-designed polydimethylsiloxane (PDMS) or silicone o-ring holder.
- Biocompatible, inert vacuum grease (e.g., high-vacuum grease).
- Procedure:
- Apply a thin bead of vacuum grease to the bottom flange of a PDMS holder sized slightly smaller than the lens diameter.
- Using flat-tipped tweezers, gently place the hydrated lens convex-side-up onto the grease bead.
- Carefully lower the holder (with lens) into the AFM fluid cell, which is pre-filled with hydration medium.
- Secure the holder using the cell's mechanical clamping system. The grease creates a water-tight seal that holds the lens periphery without stressing the central measurement zone.
Environmental Control
Maintaining constant temperature and fluid composition during measurement is non-negotiable.
Protocol 3.1: Integrated Temperature and Fluid Exchange Control
- Objective: To maintain a constant 34°C and enable controlled perfusion of different media.
- Materials:
- AFM with enclosed acoustic/vibration isolation hood.
- Temperature-controlled fluid cell stage or perfusion heater.
- Peristaltic pump or syringe pump with fluid exchange kit.
- Inline temperature sensor and feedback controller.
- Procedure:
- Mount the hydrated sample as per Protocol 2.1.
- Connect the fluid cell inlet/outlet to the perfusion system. Prime all tubing with the desired medium.
- Set the temperature controller to 34°C. Allow the system to equilibrate for 30 minutes after sealing.
- Initiate a slow, continuous perfusion (e.g., 0.1 mL/min) or static fluid condition, as required by the experiment.
- Monitor temperature stability (±0.5°C) via the inline sensor for the duration of the AFM experiment (typically 1-2 hours).
Table 2: Environmental Control Parameters and Tolerances
| Parameter | Target Value | Acceptable Tolerance | Measurement Tool | Consequence of Deviation |
|---|---|---|---|---|
| Temperature | 34°C (Ocular Surface) | ±0.5°C | Calibrated thermocouple | Modulus change (~5-10%/°C for hydrogels). |
| Fluid Evaporation | 0% volume loss | <1% over scan duration | Visual/gravimetric check | Increased osmolarity, lens dehydration. |
| Ambient Vibration | Minimized | RMS < 1 nm | Accelerometer | Excessive noise in force curves. |
Experimental Workflow for AFM Modulus Measurement
Title: AFM Contact Lens Modulus Measurement Workflow
The Scientist's Toolkit: Essential Research Reagent Solutions
Table 3: Key Materials for AFM Contact Lens Sample Prep
| Item Name / Solution | Function & Role in Experiment |
|---|---|
| Custom Simulated Tear Fluid (STF) | Provides physiologically relevant ionic and biomolecular environment to maintain lens hydration state and surface chemistry. |
| Polydimethylsiloxane (PDMS) Mounting Holders | Custom-fabricated o-rings that provide strain-free, non-adhesive immobilization of the soft hydrogel lens. |
| Biocompatible High-Vacuum Grease | Creates a water-tight seal between lens and holder without leaching chemicals that could contaminate the lens or fluid. |
| Temperature-Controlled Perfusion System | Maintains the ocular surface temperature (34°C) and allows for dynamic fluid exchange during measurement. |
| Calibrated AFM Cantilevers (e.g., PNPs) | Silicon nitride probes with low spring constants (0.01-0.1 N/m) and colloidal or pyramidal tips for soft material indentation. |
| Sterile Balanced Salt Solution (BSS) | Baseline hydration medium for establishing control modulus values, free of proteins or other deposits. |
Within a broader thesis focused on measuring the surface elastic modulus of contact lens materials using Atomic Force Microscopy (AFM), the selection and calibration of the probe is paramount. This application note provides detailed protocols for cantilever choice, tip geometry consideration, and spring constant calibration, specifically tailored for soft, hydrated polymer surfaces like those of contact lenses.
Cantilever Choice for Contact Lens Modulus Measurement
The primary mechanical property of interest is the reduced elastic modulus (Er), derived from force-distance curves. For soft materials (E ~ 0.1 MPa to 5 MPa), cantilever selection must prevent excessive sample deformation while maintaining sufficient sensitivity.
Key Parameters:
- Low Spring Constant (k): To achieve measurable deflection on soft samples without indenting beyond the linear elastic regime.
- Resonant Frequency (f0): Should be sufficiently high to minimize thermal noise and environmental vibration interference.
- Tip Geometry: A spherical tip is often preferred to avoid plastic deformation and simplify Hertzian model fitting.
Table 1: Recommended Cantilever Specifications for Contact Lens Surface Modulus Measurement
| Parameter | Target Range | Rationale |
|---|---|---|
| Spring Constant (k) | 0.01 - 0.1 N/m | Optimized for soft sample indentation with measurable deflection. |
| Resonant Frequency in Air (f0) | 10 - 40 kHz | Balances softness (low k) with stability and noise performance. |
| Tip Geometry | Spherical (colloidal) tips; Nominal radius: 1 - 5 µm | Prevents sample piercing, provides defined contact area for Hertz model. Sharp tips (radius < 20 nm) are unsuitable as they may indent beyond linear regime. |
| Coating | Uncoated silicon nitride (Si3N4) or gold reflective backing only. | Si3N4 is hydrophilic, compatible with hydrated lens environment. Avoid stiff metal coatings. |
Experimental Protocol: Force-Volume Mapping for Modulus
This protocol details obtaining spatial modulus maps on a contact lens surface in fluid.
Materials:
- AFM with fluid cell capability.
- Soft cantilever (see Table 1).
- Phosphate Buffered Saline (PBS) or saline solution.
- Hydrated contact lens sample, securely mounted.
Procedure:
- Cantilever Mounting & Fluid Introduction: Mount the selected cantilever. Introduce PBS into the fluid cell carefully to avoid contamination of the laser path. Ensure full immersion of the cantilever.
- Thermal Equilibrium: Allow the system to equilibrate for at least 30 minutes to minimize thermal drift.
- Laser Alignment & Photodetector Calibration: Align the laser on the cantilever end and center the photodetector signal. Perform a photodetector sensitivity (InvOLS) calibration on a clean, rigid area of the sample mount (not the lens) using the force spectroscopy mode.
- Spring Constant Calibration: Perform the thermal tune method (detailed in next section) in fluid to determine the precise spring constant.
- Force Curve Parameter Setup:
- Set trigger threshold to 5-10 nN to limit indentation depth.
- Set approach/retract velocity to 1-2 µm/s to minimize hydrodynamic forces.
- Define a grid (e.g., 32x32 points) over the area of interest.
- Data Acquisition: Execute the force-volume scan. The system will acquire an array of force-distance curves at each point.
- Data Analysis:
- For each curve, convert deflection vs. Z-piezo data to force vs. indentation.
- Fit the approach curve (corrected for baseline) with the Hertz contact model for a spherical indenter: F = (4/3) Er √R δ3/2 where F is force, R is tip radius, δ is indentation.
- The reduced modulus Er is the fitted parameter. Map Er values across the scan area.
Spring Constant Calibration Protocol: Thermal Tune Method
Accurate knowledge of the spring constant (k) is non-negotiable for quantitative modulus measurement.
Procedure:
- Preparation: With the cantilever in the measurement medium (air or fluid), retract the tip several micrometers from the surface to avoid any tip-sample interaction.
- Data Acquisition: Record the power spectral density (PSD) of the cantilever's thermal fluctuations. Use a sampling frequency significantly above the cantilever's resonant frequency (e.g., 4-10 times f0). Acquire data for at least 10 seconds to reduce noise.
- Fitting: Fit the fundamental resonance peak in the PSD to a simple harmonic oscillator (SHO) model: PSD(f) = A / [(f2 - f02)2 + (f f0 / Q)2] where A is a scaling factor, f0 is resonant frequency, and Q is the quality factor.
- Calculation: Calculate the spring constant using the Equipartition Theorem method:
k = kBT /
Table 2: Typical Spring Constant Calibration Results for a Soft Cantilever
| Medium | Resonant Frequency (f0) | Quality Factor (Q) | Calibrated Spring Constant (k) |
|---|---|---|---|
| Air | 25.4 kHz | 52 | 0.032 N/m |
| PBS (Fluid) | 7.1 kHz | 2.8 | 0.029 N/m |
The Scientist's Toolkit
Table 3: Essential Research Reagent Solutions for AFM Contact Lens Studies
| Item | Function in Experiment |
|---|---|
| Phosphate Buffered Saline (PBS), pH 7.4 | Standard immersion fluid to maintain contact lens hydration and mimic physiological conditions during measurement. |
| Silicon Nitride Cantilevers (Uncoated) | Preferred probe material due to its compatibility with aqueous environments and appropriate surface chemistry for soft materials. |
| Colloidal Probe Tips | Borosilicate or silica microspheres (1-5 µm diameter) attached to cantilevers provide a well-defined spherical geometry for reliable Hertz model fitting. |
| Calibration Gratings (TGZ1, PG) | Used for lateral (XY) and vertical (Z) scanner calibration, and for tip characterisation (e.g., tip check sample). |
| Clean Room Wipes & Compressed Air/Duster | For meticulous cleaning of sample stages, fluid cells, and optics to prevent contamination affecting force measurements. |
| UV/Ozone or Plasma Cleaner | For cleaning cantilevers and sample substrates to remove organic contaminants prior to experiments. |
Workflow and Relationship Diagrams
AFM Modulus Measurement Workflow
Key Parameters for Hertz Model Analysis
Within the broader thesis on characterizing contact lens surface modulus using Atomic Force Microscopy (AFM), the acquisition and analysis of force-distance (F-D) curves is the foundational technique. This protocol details the methodology for obtaining quantitative nanomechanical data through F-D curves, with a focus on parameter selection, rate dependence studies, and spatial mapping, specifically tailored for soft, hydrated polymeric materials like contact lens hydrogels.
Key Parameters for F-D Curve Acquisition
The following parameters must be carefully optimized to ensure accurate, reproducible measurements on soft, hydrated surfaces.
Table 1: Critical AFM Parameters for Contact Lens F-D Curve Acquisition
| Parameter | Typical Range (Contact Lens) | Function & Impact |
|---|---|---|
| Cantilever Spring Constant (k) | 0.01 - 0.5 N/m | Calibrated via thermal tune. Lower k values increase sensitivity for soft samples. |
| Probe Tip Geometry | Spherical tip (R=1-5 µm), Colloidal probe | Avoids sample damage; defines contact mechanics model (Hertz/Sneddon). |
| Trigger Point / Setpoint | 0.5 - 10 nN | Maximum force applied. Must be minimized to prevent indentation beyond linear elastic regime. |
| Approach/Retract Velocity | 0.5 - 10 µm/s | Controls loading rate. Critical for assessing viscoelasticity (rate dependence). |
| Sampling Points per Curve | 512 - 4096 | Defines resolution of the F-D curve, especially important in the contact region. |
| Pause at Surface | 0 - 2 seconds | Allows for stress relaxation; key for separating elastic vs. viscous response. |
| Z-length (Sweep Size) | 1 - 3 µm | Must be sufficient to capture non-contact, contact, and adhesion regions fully. |
Protocol: Baseline F-D Curve Acquisition on Hydrated Contact Lenses
Materials & Reagents
Table 2: Research Reagent Solutions & Essential Materials
| Item | Function |
|---|---|
| Commercial AFM with Liquid Cell | Enables operation in fully hydrated, physiologically relevant conditions. |
| Soft Cantilevers (SiN, Ti-coated) | e.g., MLCT-Bio-DC (Bruker), k~0.03 N/m. For high compliance on soft samples. |
| Spherical Tip Attachments | Silica or polystyrene microspheres (2-5µm diameter). Glued to cantilever for defined geometry. |
| Phosphate Buffered Saline (PBS), pH 7.4 | Standard immersion fluid to maintain lens hydration and mimic ocular environment. |
| Petri Dish with Temperature Stage | Holds hydrated lens sample; temperature control (e.g., 34°C) possible. |
| Calibration Gratings (TGZ1, PFQNM-L)) | For tip characterization and spring constant calibration. |
| Software (NanoScope, JPKSPM, Gwyddion) | For acquisition, baseline correction, and analysis of F-D curves. |
Experimental Procedure
- Sample Preparation: Mount a clean, hydrated contact lens in a petri dish. Submerge completely in PBS. Ensure the lens is firmly adhered to the dish bottom to prevent drift.
- Probe Selection & Calibration: Affix a colloidal probe (5 µm sphere) to a soft cantilever. Perform thermal tune in air to determine exact spring constant (k). Characterize tip radius via scanning electron microscopy (SEM) or calibration grating prior to experiment.
- System Setup: Fill liquid cell with PBS, insert probe, and align laser. Allow thermal equilibration for 20 minutes. Engage on a rigid area (e.g., dish glass) near the sample to set photodetector sensitivity (InvOLS).
- Parameter Initialization: In F-D mode, set: Z-length = 2 µm, Velocity = 1 µm/s, Sampling Points = 1024, Trigger Point = 2 nN. Pause at surface = 0.5 s.
- Acquisition: Move probe above a visually flat region of the lens surface (via optical camera). Acquire a series of 20-50 F-D curves at a single location to check reproducibility.
- Baseline Correction: Post-acquisition, apply software flattening to the non-contact region of each curve to define zero force and zero separation.
Protocol: Investigating Loading Rate Dependence
This protocol assesses the viscoelastic properties of the lens material by varying the approach velocity.
- Using the setup from Section 2, select a single, representative XY location on the lens surface.
- Define a matrix of five approach velocities (e.g., 0.5, 1, 2, 5, 10 µm/s). Keep all other parameters constant, especially the trigger force.
- Acquire a set of 10 curves at each velocity in the matrix. Allow 30 seconds between velocity changes for system stabilization.
- For each curve, fit the extending (approach) portion of the contact region with the Hertz model for a spherical indenter to extract the apparent Young's Modulus (E).
- Data Analysis: Plot the calculated modulus (E) versus loading rate (velocity). An increase in E with rate indicates viscoelastic (time-dependent) behavior characteristic of hydrogel polymers.
Protocol: Spatial Mapping of Modulus (Force-Volume)
This protocol generates a 2D map of mechanical properties across the lens surface.
- Define a scan area (e.g., 20 x 20 µm). Define a grid of points (e.g., 32 x 32 = 1024 pixels).
- At each pixel, the AFM will acquire a full F-D curve using optimized parameters (e.g., Velocity = 2 µm/s, Trigger = 3 nN).
- Initiate the Force-Volume scan. Total acquisition time will be significant (~30-60 mins); ensure sample drift is minimal.
- Post-process the array of curves: Apply automatic baseline correction, then fit each curve with the appropriate contact model (e.g., Hertz).
- Data Visualization: Generate a color-coded map where the value of Young's Modulus (in kPa or MPa) is assigned to each pixel, revealing surface heterogeneity.
Data Presentation & Analysis
Table 3: Representative Quantitative Data from a Model Silicone Hydrogel Lens
| Measurement Type | Parameter | Value (Mean ± SD) | Conditions |
|---|---|---|---|
| Single Point Modulus | Young's Modulus (E) | 1.2 ± 0.3 MPa | v = 1 µm/s, F = 2 nN, R = 2.5 µm |
| Rate Dependence | E at v = 0.5 µm/s | 0.9 ± 0.2 MPa | - |
| E at v = 10 µm/s | 1.8 ± 0.4 MPa | - | |
| Spatial Mapping | Avg. Map Modulus | 1.3 ± 0.6 MPa | 20x20 µm area |
| Modulus Range (Min-Max) | 0.4 - 2.9 MPa | - |
Diagrams
F-D Curve Acquisition and Analysis Workflow
Effect of Loading Rate on Measured Modulus
Spatial Modulus Mapping Protocol Steps
Atomic Force Microscopy (AFM) nanoindentation is a pivotal technique for characterizing the mechanical properties of contact lens materials. Accurate measurement of the elastic modulus is essential for understanding lens comfort, oxygen permeability, protein deposition, and overall performance. This application note details the critical steps from acquiring raw force-distance data to extracting the reduced elastic modulus (Er) using contact mechanics models (Hertz, Sneddon, DMT) within a robust data processing pipeline, framed within a thesis on advanced AFM methodologies for ophthalmic biomaterials.
Core Contact Mechanics Models
The choice of model depends on the tip geometry, material properties (e.g., adhesion), and deformation regime.
Hertz Model
The Hertz model is the foundation for non-adhesive, elastic contact between two isotropic solids. It assumes small strains, no surface forces, and a parabolic tip.
- Key Equation: For a parabolic (spherical) tip: ( F = \frac{4}{3} Er \sqrt{R} \delta^{3/2} )
- ( F ): Applied force
- ( Er ): Reduced elastic modulus
- ( R ): Tip radius
- ( \delta ): Indentation depth
Sneddon Model
Sneddon extended Hertzian theory for axisymmetric punch shapes. The most common application in AFM is for a conical tip.
- Key Equation (Conical Tip): ( F = \frac{2}{\pi} E_r \tan(\alpha) \delta^2 )
- ( \alpha ): Half-angle of the cone opening.
Derjaguin-Muller-Toporov (DMT) Model
The DMT model accounts for adhesive forces outside the contact area, making it suitable for stiff materials with low adhesion and small tip radii.
- Key Equation (Spherical Tip): ( F = \frac{4}{3} E_r \sqrt{R} \delta^{3/2} - 2\pi R \Delta\gamma )
- ( \Delta\gamma ): Work of adhesion.
Table 1: Comparison of Contact Mechanics Models for AFM Nanoindentation
| Model | Tip Geometry | Adhesion Consideration | Best Suited For | Key Limitation |
|---|---|---|---|---|
| Hertz | Parabolic/Spherical | Ignores adhesion | Non-adhesive, elastic contacts; stiff materials (e.g., silicone hydrogel lenses in fluid). | Inaccurate for soft, adhesive materials. |
| Sneddon | Conical/Pyramidal | Ignores adhesion | Non-adhesive, elastic contacts with sharp tips; mapping lateral modulus variations. | Assumes perfect tip shape; blunting affects accuracy. |
| DMT | Parabolic/Spherical | Accounts for adhesion outside contact area | Stiff to moderately compliant materials with small, short-range adhesion. | Underestimates adhesion for large, soft contacts. |
Data Processing Pipeline Protocol
This protocol outlines the step-by-step transformation of raw AFM data into a reliable modulus value.
Protocol 3.1: AFM Force Curve Acquisition on Contact Lenses
Objective: To collect calibrated force-distance curves on hydrated contact lens surfaces. Materials: See "The Scientist's Toolkit" below. Procedure:
- Lens Preparation: Hydrate the contact lens in appropriate saline solution (PBS) for >24 hours. Mount the lens on a glass-bottom Petri dish using a thin layer of vacuum grease, ensuring the surface of interest is horizontal and fully covered by solution.
- AFM Calibration: Perform thermal tuning to determine the optical lever sensitivity (OLS) of the cantilever in fluid. Calibrate the spring constant (k) using the thermal noise method.
- Tip Selection & Engagement: Select a colloidal probe (sphere diameter 2-10 µm) for Hertz/DMT analysis or a sharp tip (cone angle <30°) for Sneddon analysis. Engage the tip in fluid far from the sample surface.
- Parameter Setting: Set a force trigger threshold (typically 5-20 nN) to prevent excessive deformation. Adjust the approach/retract velocity to 0.5-2 µm/s to minimize viscous drag effects. Set a sufficient ramp size (e.g., 2-3 µm).
- Data Collection: Acquire a grid of force curves (e.g., 32x32 or 64x64) over a representative area (e.g., 20x20 µm²). Collect a minimum of 5-10 curves on different lens locations for bulk property assessment.
Protocol 3.2: Force Curve Processing and Modulus Fitting
Objective: To process raw photodiode voltage vs. piezo displacement data to obtain a force vs. indentation curve and fit it with a contact model. Procedure:
- Baseline Subtraction: For each curve, select the non-contact region of the approach segment and fit a linear baseline. Subtract this from the entire curve.
- Convert to Force-Displacement:
- Force (F) = Cantilever Deflection (D) × Spring Constant (k). Deflection (D) = (Voltage - Baseline Voltage) × OLS.
- Piezo Displacement (Z) is the raw x-axis.
- Create a Force vs. Piezo Displacement (F-Z) curve.
- Contact Point Detection: Algorithmically determine the point of initial contact. Common methods include: (a) finding the point where force first exceeds a noise threshold (e.g., 3×RMS noise), or (b) finding the intersection of linear fits to the non-contact and contact regions.
- Calculate Indentation (δ): δ = (Piezo Displacement (Z) - Contact Point (Z0)) - (Deflection (D) - Deflection at Contact (D0)).
- Model Fitting:
- Extract the approach (loading) segment of the Force vs. Indentation (F-δ) curve.
- Using a scientific computing tool (e.g., Python, MATLAB, IGOR Pro), fit the appropriate model (from Table 1) to the data.
- Critical Step: Define the fit range. Typically, use data from the contact point up to a maximum indentation (e.g., 10-20% of sample thickness or 200 nm, whichever is smaller) to avoid substrate effects.
- The primary fitted parameter is the Reduced Modulus (Er).
- Convert to Sample Modulus (Esample): Use the equation ( \frac{1}{Er} = \frac{(1-\nu{sample}^2)}{E{sample}} + \frac{(1-\nu{tip}^2)}{E{tip}} ), where ν is Poisson's ratio. For a diamond or silicon nitride tip (Etip >> Esample), this simplifies to ( E{sample} \approx Er (1-\nu{sample}^2) ). Assume νsample ≈ 0.4-0.5 for hydrated hydrogels.
Title: AFM Modulus Data Processing Pipeline
The Scientist's Toolkit
Table 2: Essential Research Reagents & Materials for AFM Contact Lens Characterization
| Item | Function & Relevance |
|---|---|
| AFM with Liquid Cell | Enables nanoindentation measurements in a physiologically relevant, hydrated environment to maintain lens swelling and properties. |
| Colloidal Probe Cantilevers (SiO₂ or PS spheres, R=2-10µm) | Provide a well-defined spherical geometry for applying Hertz/DMT models, reducing stress concentration and improving accuracy on soft hydrogels. |
| Sharp Silicon Nitride Tips (k=0.01-0.5 N/m) | Used for high-resolution mapping and Sneddon model analysis, ideal for probing surface heterogeneity and thin coatings. |
| Phosphate Buffered Saline (PBS), pH 7.4 | Standard hydration and imaging fluid that mimics ocular fluid ionic strength, preventing sample dehydration and property alteration. |
| Glass Bottom Petri Dishes | Provide a transparent, flat substrate for mounting lenses, compatible with AFM stage and optical viewing. |
| High-Vacuum Grease (Silicone-Free) | Used to securely mount the compliant contact lens to the dish without chemical interaction or leaching into the lens material. |
| Calibration Gratings (e.g., TGXYZ1, PSP) | Used for scanner calibration in X, Y, and Z dimensions, ensuring accurate spatial and indentation depth measurements. |
Advanced Protocol: Adhesive Contact Analysis (DMT/JKR)
For soft contact lenses where adhesion is significant, an extended protocol is required.
Protocol 5.1: Adhesive Work of Adhesion (Δγ) Extraction
Objective: To quantify adhesion forces and correctly apply an adhesive contact model. Procedure:
- Follow Protocol 3.1 for data acquisition, ensuring the retract curve is also captured.
- Process data through steps 3.2.1-3.2.4 to obtain F-δ curves for both approach and retract.
- Identify Adhesion Force (Fad): On the retract curve, find the minimum force value (maximum negative force). This is Fad.
- Calculate Work of Adhesion (Δγ): For a spherical tip in the DMT framework, ( F_{ad} = 2\pi R \Delta\gamma ). Rearrange to solve for Δγ.
- Fit with DMT Model: Use the calculated Δγ as a fixed parameter in the DMT equation (Table 1). Fit only the loading portion of the approach curve to extract Er. This decouples the modulus from adhesion.
- Validation: Compare results to the Johnson-Kendall-Roberts (JKR) model, which assumes larger adhesive forces inside the contact area and is more suitable for very soft, highly adhesive materials.
Title: Adhesive Contact Analysis Workflow
A rigorous approach to model selection and data processing is fundamental for accurate AFM-based modulus measurement of contact lenses. The Hertz model serves as a baseline for non-adhesive contacts, while the Sneddon and DMT models extend applicability to conical tips and adhesive systems, respectively. Implementing the standardized protocols and pipelines described here ensures reliable, reproducible data crucial for advancing the development of next-generation ophthalmic biomaterials.
Overcoming Measurement Challenges: Optimizing AFM for Soft, Hydrated Contact Lens Materials
Managing Adhesion and Capillary Forces in Hydrated Environments
Within the broader thesis investigating Atomic Force Microscopy (AFM) for contact lens surface modulus measurement, managing adhesive and capillary forces is paramount. In hydrated environments, these forces can dominate the tip-sample interaction, leading to significant errors in modulus quantification. This document provides application notes and detailed protocols for characterizing and mitigating these forces to ensure accurate nanomechanical measurements on soft, hydrated materials like contact lens hydrogels.
Quantitative Force Analysis in Hydrous Conditions
The following table summarizes key force magnitudes encountered during AFM measurements on hydrated soft surfaces, collated from recent literature.
Table 1: Typical Force Magnitudes in Hydrated AFM Measurements
| Force Type | Typical Magnitude Range | Dominant in Environment | Impact on Modulus Measurement |
|---|---|---|---|
| Capillary Force (Meniscus) | 10 - 100 nN | Air (ambient), Low Humidity | Severe overestimation (can be 100%+ error) |
| Van der Waals Adhesion | 0.1 - 10 nN | All environments | Moderate overestimation |
| Electrostatic Force | 0.01 - 5 nN | Low humidity, non-conductive liquids | Variable, can cause instability |
| Solvation/Hydration Force | 0.05 - 2 nN | Liquid cell (aqueous) | Can reduce or modulate adhesion |
| Hydrodynamic Drag | 0.01 - 1 nN | Liquid cell, high approach speed | Adds background force, affects trigger |
Core Experimental Protocols
Protocol 2.1: Calibrating Cantilevers in Liquid
Objective: Accurately determine the spring constant (k) and optical lever sensitivity (InvOLS) of a cantilever in a liquid environment. Materials: AFM with liquid cell, calibration cantilevers (e.g., TL-CAL from Bruker), colloidal probe (if used), phosphate-buffered saline (PBS) or appropriate saline solution.
- Thermal Tune Method in Liquid:
- Assemble the liquid cell and fill with the measurement solution (e.g., PBS).
- Engage the cantilever far from the surface (~10-20 µm).
- Record the thermal noise spectrum. The mean-square deflection is given by the Equipartition Theorem: (1/2)k⟨x²⟩ = (1/2)kBT, where kB is Boltzmann's constant and T is temperature.
- Fit the fundamental resonance peak to a simple harmonic oscillator model to obtain the spring constant k. Use the built-in software routines (e.g., Nanoscope, Asylum, JPK).
- InvOLS Calibration on Rigid Substrate in Liquid:
- Use a clean, rigid substrate (sapphire, clean glass).
- Perform a force-distance curve at low speed (100 nm/s) to obtain a linear contact region.
- The slope of the contact region on a hard sample gives the InvOLS (m/V) in liquid, which differs from in-air due to refractive index changes.
Protocol 2.2: Measuring and Minimizing Capillary Forces
Objective: Quantify and eliminate meniscus forces for accurate in-air or controlled humidity measurements on hydrogels. Materials: AFM, environmental chamber, hygrometer, hydrophilic/hydrophobic cantilevers.
- Humidity Control Experiment:
- Place the hydrated contact lens sample in the AFM environmental chamber.
- Sequentially set relative humidity (RH) from 10% to 90% in increments of 20%.
- At each RH, allow 30 minutes for equilibration.
- Acquire 50 force-distance curves at different sample locations at each RH level using the same cantilever.
- Plot the measured adhesion force (pull-off force) versus RH. A peak is typically observed at 30-50% RH due to maximal meniscus formation.
- Mitigation Strategy: Perform measurements at either very low RH (<10%, meniscus minimized) or very high RH (>85%, where the meniscus is continuous and Laplace pressure is reduced). High RH is preferred for hydrated samples to prevent dehydration.
Protocol 2.3: Adhesion Force Mapping in Aqueous Buffer
Objective: Map local adhesive interactions on a contact lens surface in physiologically relevant fluid. Materials: AFM with liquid cell, sharp or colloidal probe, PBS at pH 7.4.
- Functionalize a colloidal probe with a chemically inert coating (e.g., PEG) if specific interactions are not the study target.
- Immerse the sample and probe in PBS. Allow thermal equilibration for 30 min.
- Perform a force-volume map or a PeakForce QI-like acquisition over a selected area (e.g., 10x10 µm²).
- For each pixel, record the full force-distance curve. The minimum force in the retraction curve is defined as the adhesion force (F_ad).
- Generate a 2D adhesion map alongside topography and modulus (DMT modulus) maps.
Visualization of Workflows and Relationships
Title: AFM Force Management Workflow for Hydrated Samples
Title: Components of AFM Adhesion Force in Hydrated Environments
The Scientist's Toolkit: Research Reagent Solutions
Table 2: Essential Materials for Managing Adhesion in Hydrated AFM
| Item & Typical Product | Function in Experiment | Critical Consideration |
|---|---|---|
| Colloidal Probe Kits (e.g., sQube from NanoAndMore, CP-PNPL from Bruker) | Spherical tip geometry simplifies contact mechanics (Hertz/Sneddon models) and provides consistent contact area. | Choose sphere material (silica, polystyrene) and diameter (2-20 µm) based on sample stiffness and required stress. |
| PEG-Coated Cantilevers (e.g., SH-PEG from NanoWorld) | Polyethylene glycol (PEG) brush coating minimizes non-specific adhesion (protein, chemical) in biological liquids. | Ensure coating stability in your buffer. Short-chain PEG is common for passive anti-fouling. |
| Liquid AFM Cells with O-rings (Model-specific, e.g., Asylum, Bruker) | Provides a sealed environment for complete sample immersion and fluid exchange during scanning. | Compatibility with scanner, use of inert O-ring material (e.g., Viton) to avoid sample contamination. |
| Environmental Control Chamber (e.g., Genyris from RHK, home-built) | Actively controls relative humidity and temperature around the sample and cantilever. | Precision of RH control (±1%), speed of equilibration, and optical access for laser alignment. |
| Phosphate Buffered Saline (PBS), 1X, pH 7.4 (e.g., Gibco) | Standard physiologically relevant ionic solution for hydrating contact lens samples and mimicking tear fluid. | Use without calcium/magnesium if studying protein adsorption. Always filter (0.22 µm) before use in liquid cell. |
| Calibration Samples (e.g., PDMS arrays, PS/LDPE films from Bruker) | Samples with known, stable modulus for validating AFM measurements and protocols in liquid. | Ensure sample is non-swelling and stable in your chosen liquid over measurement time. |
In Atomic Force Microscopy (AFM) research focused on measuring the surface modulus of contact lenses, data fidelity is paramount. Accurate modulus mapping is critical for understanding lens comfort, protein deposition, and drug-eluting performance. This application note details protocols to mitigate three prevalent artifacts: sample deformation, tip contamination, and scanner drift, which can severely compromise nanomechanical property measurements.
Table 1: Impact and Characteristics of Key AFM Artifacts in Soft Material Analysis
| Artifact | Typical Magnitude of Error | Primary Effect on Modulus Measurement | Detectable via |
|---|---|---|---|
| Sample Deformation | 50% - 500% overestimation | Apparent modulus increases non-linearly with load | Non-linear force curves; Load-dependence study |
| Tip Contamination | 10% - 200% variation (usually increase) | Altered contact geometry, changed adhesion | Changed FZ shape; Inconsistent adhesion values; Visual tip check |
| Scanner Z-Drift | ± 0.1 - 5 nm/s | Baselines shift, false adhesion/indentation | Time-dependent baseline shift in force curves |
| Scanner XY Drift | 0.5 - 3 nm/s | Blurred images, misplaced measurement grids | Feature translation in successive scans |
Table 2: Recommended Operational Parameters for Hydrogel Contact Lens AFM
| Parameter | Recommended Range for Contact Lenses | Rationale for Artifact Reduction |
|---|---|---|
| Maximum Indentation Force | 0.5 - 5 nN | Minimizes plastic deformation & deep substrate effect |
| Indentation Depth (Max) | < 10% of sample thickness | Ensures measured modulus is surface-localized |
| Approach/Retract Velocity | 0.5 - 2 µm/s | Reduces hydrodynamic drag & viscoelastic effects |
| Trigger Threshold | 0.1 - 0.3 nN | Prevents excessive loading on soft surface |
| Dwell Time at Maximum Load | 0 - 100 ms | Limits creep deformation |
| Scan Rate for Imaging | 0.5 - 1.5 Hz | Balances drift and sample disturbance |
Detailed Experimental Protocols
Protocol 1: Minimizing Sample Deformation During Modulus Mapping
Objective: To acquire accurate surface modulus maps of hydrogel contact lenses by controlling indentation parameters.
- Sample Preparation: Hydrate the contact lens in the appropriate saline solution (e.g., PBS) for >24 hours. Immobilize the lens on a glass Petri dish using a thin layer of medical-grade cyanoacrylate at the edge only, ensuring the central measurement area is free and fully hydrated.
- Cantilever Selection: Use a soft, reflective, tipless cantilever (e.g., nominal k ≈ 0.1 N/m). Functionalize with a 5 µm silica microsphere using a two-part epoxy to create a colloidal probe, which provides a defined, reproducible spherical contact geometry.
- Spring Constant Calibration: Perform thermal tune calibration in fluid immediately before measurement.
- Determining Linear Elastic Regime: On a representative area, perform a force volume map (16x16 points) at increasing maximum trigger forces (0.5, 1, 2, 5 nN). Fit the retract curve with the Hertz model for a sphere. Plot apparent modulus vs. trigger force.
- Optimal Load Selection: Identify the force range where the modulus plateaus (minimal load-dependence). Use the midpoint of this range for all subsequent measurements.
- Execution: Perform force-volume or PeakForce QNM mapping using the determined optimal load, a 0.5 µm/s approach rate, and a 50 ms dwell time.
Protocol 2: Identifying and Mitigating Tip Contamination
Objective: To maintain a consistent tip geometry for reliable modulus measurement.
- Establish Baseline: After calibration and before first contact with the sample, record 10 force curves on a clean, rigid reference material (e.g., mica in PBS). Calculate the mean adhesion force and slope of the contact region.
- In-Situ Monitoring: After every 5-10 force curves or 2-3 image scans on the contact lens, re-measure 3 force curves on the rigid reference.
- Contamination Check Criteria: A >15% increase in adhesion force or a >10% change in the contact slope indicates likely contamination.
- Mitigation Procedure: If contamination is detected:
- Retract the tip from the sample.
- Rinse the tip by engaging in a clean area of the fluid cell away from the sample while flushing with fresh PBS.
- Sonicate the cantilever chip in a mild detergent (2% Hellmanex) for 2 minutes, rinse with DI water and ethanol, and dry with clean air. (May require breaking fluid seal).
- Re-calibrate the spring constant.
- Re-establish the baseline (Step 1).
Protocol 3: Compensating for Scanner Z-Drift in Long-Duration Experiments
Objective: To obtain stable force curve baselines over time for quantitative indentation analysis.
- Pre-Thermalization: Power on the AFM scanner and environmental control (if available) for at least 60 minutes before measurement.
- Initial Drift Measurement: Engage the tip on a rigid, non-deforming feature (e.g., the glass substrate near the immobilized lens). Set the scanner to hold the Z-piezo at a fixed voltage. Record the deflection signal over 300 seconds. Calculate the drift rate (nm/s) from the slope.
- Software Compensation: Input the measured drift rate into the AFM software's linear drift compensation function, if available.
- Reference Point Protocol: Program the experiment to periodically (e.g., every 30 measurement points) retract fully and perform a brief (5-point) force curve engagement on a designated "drift check" point on the rigid substrate.
- Post-Hoc Correction: During data analysis, align all force curves based on the constant deflection region before contact, using the drift check points to apply a linear time-based correction to the Z-piezo position data.
The Scientist's Toolkit: Research Reagent Solutions
Table 3: Essential Materials for AFM Modulus Mapping of Contact Lenses
| Item | Function | Example Product/Catalog Number |
|---|---|---|
| Soft, Tipless Cantilevers | Base for colloidal probe creation; low stiffness prevents sample damage. | Bruker MLCT-O10 (k ≈ 0.03 N/m) |
| Silica Microspheres | Provides defined, spherical contact geometry for Hertzian analysis. | Cospheric SiO2MS-5.0 (5.0 µm mean diameter) |
| UV-Curing Epoxy | Securely attaches microsphere to tipless cantilever. | Norland Optical Adhesive 63 |
| Phosphate Buffered Saline (PBS), pH 7.4 | Hydration medium mimicking physiological conditions. | Thermo Fisher Scientific 10010023 |
| Medical-Grade Cyanoacrylate | Securely immobilizes lens without affecting measurement area. | Locitte 4014 |
| Cleanroom Wipes & Swabs | For fluid cell cleaning to reduce particulate contamination. | Texwipe TX1009 |
| Mica Disks (Freshly Cleaved) | Atomically flat, inert surface for tip cleanliness verification. | Ted Pella Inc. 50 |
| Aqueous Detergent Concentrate | For effective tip and fluid cell cleaning. | Hellma Analytics 9-310-006-0054 |
Visualized Workflows and Relationships
Title: Artifact Mitigation Strategy for AFM Modulus Mapping
Title: Tip Contamination In-Situ Monitoring Protocol
Title: Sample Deformation Leads to Modulus Overestimation
Optimizing Load Force and Indentation Depth for Surface-Specific Data
This application note is framed within a broader thesis on using Atomic Force Microscopy (AFM) to measure the surface elastic modulus of modern silicone hydrogel contact lenses. Accurate determination of surface mechanical properties is critical for predicting lens comfort, protein deposition, and corneal interaction. A major challenge is the dependence of the measured modulus on the experimental load force and indentation depth, especially given the thin, often graded, surface layers of these materials. This document provides protocols for systematically optimizing these parameters to obtain surface-specific, reliable data.
Table 1: Reported Surface Modulus of Common Contact Lens Materials
| Material Type | Typical Bulk Modulus (MPa) | Reported Surface Modulus (AFM, MPa) | Optimal Indentation Depth (nm) | Reference Load Force (nN) |
|---|---|---|---|---|
| Conventional Hydrogel (pHEMA) | 0.5 - 1.5 | 0.8 - 2.0 | 100 - 300 | 5 - 20 |
| Silicone Hydrogel (Lotrafilcon A/B) | 0.7 - 1.4 | 5.0 - 20.0 (Graded) | 10 - 50 | 1 - 10 |
| Silicone Hydrogel (Senofilcon A) | 0.7 - 1.1 | 1.5 - 5.0 (Graded) | 20 - 100 | 2 - 15 |
| Plasma Surface Treatment Layer | N/A | 50 - 200 | < 10 | 0.5 - 5 |
Table 2: Effect of Load Force on Measured Modulus (Model Silicone Hydrogel)
| Applied Load Force (nN) | Average Indentation Depth (nm) | Calculated Apparent Modulus (MPa) | Probable Layer Probed |
|---|---|---|---|
| 2 | 8 ± 2 | 18.5 ± 4.2 | Stiff surface treatment |
| 10 | 35 ± 5 | 6.2 ± 1.1 | Transition zone |
| 50 | 150 ± 15 | 1.5 ± 0.3 | Bulk material |
Experimental Protocols
Protocol 1: Determination of Linear Elastic Regime and Maximum Allowable Indentation Objective: To identify the indentation depth range where the material response is linear and reversible, ensuring surface-specificity. Materials: AFM with liquid cell, colloidal probe or sharp tip (k=0.1-0.5 N/m), contact lens sample in PBS, analysis software (e.g., Bruker NanoScope Analysis, JPKSPM, or custom Matlab/Python scripts). Procedure:
- Sample Preparation: Hydrate lens in PBS for ≥24 hours. Mount flat on glass slide using a custom fluid cell or petri dish. Ensure no tension or wrinkling.
- AFM Calibration: Perform thermal tune or other method to determine cantilever spring constant (k). Calibrate photodetector sensitivity on a rigid surface (e.g., sapphire) in PBS.
- Force Volume Mapping: Acquire a 16x16 array of force-displacement curves over a 10x10 μm area. Set a deliberately high trigger force (e.g., 50 nN) to probe deep into the material.
- Data Analysis: For each curve, fit the retract curve with the Hertzian contact model for a spherical indenter. Plot calculated modulus vs. indentation depth for all curves.
- Identify Threshold: The depth at which the modulus plateaus to the bulk value indicates the limit of surface-specificity. The region from 0 nm to ~80% of this depth is the linear, surface-specific regime.
Protocol 2: Optimized Load Force Ramp for Surface Modulus Mapping Objective: To acquire high-resolution, surface-specific elastic modulus maps by applying a load force within the predetermined linear regime. Materials: As in Protocol 1. Procedure:
- Define Optimal Load: From Protocol 1, set the maximum load force to achieve indentation depths in the shallowest third of the linear regime (e.g., 10-30 nm for Lotrafilcon lenses).
- Force Map Acquisition: Configure a high-resolution force map (e.g., 64x64 or 128x128 points over 5x5 μm). Use the optimized load force as the trigger.
- Real-Time Validation: Enable real-time modulus calculation for a few points to verify values are consistent with surface-layer expectations (higher than bulk).
- Mapping: Acquire the full map. Ensure approach/retract velocity is low (0.5-1 μm/s) to minimize viscous effects.
- Post-Processing: Apply a data filter to remove curves with adhesion events or non-linear approach. Batch-process remaining curves with the Hertz model to generate the final modulus map.
Visualization: Experimental and Analytical Workflow
Title: Workflow for AFM Surface Modulus Optimization
The Scientist's Toolkit: Essential Research Reagents & Materials
Table 3: Key Research Reagent Solutions for AFM Contact Lens Studies
| Item | Function & Specification |
|---|---|
| Phosphate Buffered Saline (PBS), pH 7.4 | Standard hydration and imaging medium. Mimics ocular environment and maintains lens swelling. |
| Colloidal AFM Probes | Spherical tips (2-10 μm diameter) for well-defined Hertzian contact, reducing stress concentration vs. sharp tips. |
| Soft Cantilevers | Nominal spring constant 0.01 - 0.5 N/m. Essential for sensitive force measurement at low nN loads without damaging soft surfaces. |
| Liquid Immersion Cell | Sealed fluid cell for AFM stage. Maintains sample hydration during long scans and enables temperature control. |
| Calibration Gratings | Rigid (TGZ1, Sapphire) for sensitivity calibration and soft (PDMS) for model validation. |
| Sylgard 184 PDMS | For preparing validation samples with known, tunable modulus (0.1-3 MPa) to verify protocol accuracy. |
| Analysis Software (e.g., AtomicJ, PUNIAS) | Open-source alternatives for advanced, batch-processing of force curves, including viscoelastic fitting. |
This application note is framed within a doctoral thesis investigating Atomic Force Microscopy (AFM)-based nanomechanical mapping for characterizing the surface modulus of silicone hydrogel contact lenses, a quintessential multi-phase material. Accurate, reliable mapping of mechanical heterogeneity is critical for correlating material structure with performance parameters like comfort, oxygen transmissibility, and protein deposition.
Key Challenges in Multi-Phase Material Mapping
The primary challenges in AFM-based modulus mapping of heterogeneous surfaces like contact lenses include:
- Phase Identification: Distinguishing discrete material phases (e.g., silicone-rich domains, hydrogel matrix) from artifacts.
- Modulus Cross-Talk: Inaccurate modulus quantification at phase boundaries due to tip convolution and mixed mechanical signals.
- Topography Coupling: Disentangling genuine modulus variations from topographically-induced force changes.
- Data Reproducibility: Ensuring consistent results across samples, operators, and instruments.
Core Strategies and Protocols
Strategy: Multi-Frequency & Bimodal AFM for Decoupled Imaging
This approach enhances phase contrast and minimizes topography-modulus coupling by simultaneously exciting and measuring multiple cantilever eigenmodes.
Protocol: Bimodal AFM (AM-FM Imaging) for Contact Lens Surface Mapping
- Probe Selection: Use a silicon probe with a nominal spring constant (k) of 2-5 N/m and a resonant frequency (f0) of 70-90 kHz in air. Calibrate the exact k and sensitivity via thermal tune method.
- Cantilever Excitation:
- Drive the first eigenmode (f1) at a constant amplitude (A1 ~ 10-15 nm) for topography feedback. Use amplitude modulation (AM).
- Drive the second eigenmode (f2) at a constant excitation force. Use frequency modulation (FM) to track its resonant frequency shift (Δf2).
- Sample Preparation: Hydrate the silicone hydrogel contact lens in phosphate-buffered saline (PBS) for 24 hours. Mount on a glass slide using a custom fluid cell filled with PBS to maintain physiological conditions.
- Data Acquisition:
- Engage in contact mode under fluid.
- Acquire images (e.g., 10x10 μm²) capturing:
- Topography Channel: From the feedback signal of the first mode.
- DMT Modulus Channel: Calculated in real-time from the Δf2 of the second mode using the Derjaguin-Muller-Toporov (DMT) model.
- Dissipation/Phase Channel: From the first mode for additional material contrast.
- Analysis: Use post-processing software to segment modulus maps based on histogram peaks, correlating distinct modulus values with material phases.
Strategy: PeakForce QNM for High-Resolution, Quantitative Mapping
PeakForce Quantitative Nanomechanical Mapping controls the maximum force on each tap, enabling direct force-distance curve derivation at high imaging rates.
Protocol: PeakForce QNM on Hydrated Contact Lens Surfaces
- Probe & Calibration: Use a SCANASYST-FLUID+ probe (k ≈ 0.7 N/m). Perform an in-situ thermal calibration in PBS. Pre-calibrate the probe tip radius (~20 nm) using a characterized reference sample (e.g., PS/LDPE blend).
- Tuning: Optimize the PeakForce frequency (0.5-2 kHz) and amplitude (50-150 nm) to achieve stable imaging with a peak force setpoint of 50-100 pN.
- Imaging: Scan the hydrated sample in PBS. Acquire modulus (DMT model), adhesion, deformation, and dissipation maps simultaneously with topography.
- Validation: Perform single-point force spectroscopy on identified phases to verify map accuracy.
Strategy: Statistical Analysis and Data Segmentation
Robust analysis is required to interpret heterogeneous maps.
Protocol: Histogram Deconvolution and Spatial Correlation Analysis
- Extract modulus values from a representative map, excluding obvious artifacts.
- Plot a frequency histogram of modulus values. Fit with multiple Gaussian distributions using least-squares optimization.
- Assign each Gaussian peak to a material phase (e.g., Peak 1: Hydrogel matrix; Peak 2: Silicone domain).
- Apply a threshold-based mask to create binary phase maps.
- Calculate phase area percentages and interfacial roughness from binary maps.
Table 1: Comparative Analysis of AFM Modulus Mapping Techniques for Multi-Phase Contact Lenses
| Technique | Core Principle | Lateral Resolution | Modulus Accuracy on Heterogeneous Surfaces | Key Advantage for Multi-Phase Mapping | Primary Limitation |
|---|---|---|---|---|---|
| Force-Volume Mapping | Array of discrete force-distance curves. | ~50-100 nm (Low) | High (Direct curve fitting) | Gold standard for quantitative validation; decouples data acquisition. | Extremely slow; prone to drift; low spatial resolution. |
| PeakForce QNM | Synchronized force-curve acquisition on each tap. | ~5-10 nm (High) | High (with proper calibration) | Optimal blend of speed, resolution, and quantitation; direct force control. | Sensitive to probe calibration and model selection. |
| Bimodal AM-FM | Excitation & detection of two cantilever eigenmodes. | ~5-10 nm (High) | Moderate-High | Exceptional material contrast; minimizes topography coupling. | Complex setup and data interpretation; model-dependent. |
| Tapping Mode Phase Imaging | Monitoring phase lag of oscillating cantilever. | ~5-10 nm (High) | Qualitative/Low | Very fast; excellent phase contrast. | Not quantitatively reliable for modulus; influenced by multiple factors. |
Table 2: Representative Modulus Data from a Model Silicone Hydrogel Lens Surface (PeakForce QNM)
| Identified Material Phase | Average Reduced Modulus (Er) [MPa] | Standard Deviation [MPa] | Approximate Areal Fraction (%) | Probable Composition |
|---|---|---|---|---|
| Continuous Matrix | 0.85 | ±0.12 | ~70% | Hydrated Poly(HEMA-co-DMA) hydrogel |
| Dispersed Domain | 3.20 | ±0.45 | ~25% | Silicone (PDMS-based) polymer |
| Boundary Region | 1.50 - 2.50 | N/A | ~5% | Interphase / Mixed phase |
The Scientist's Toolkit: Essential Research Reagents & Materials
Table 3: Key Research Reagent Solutions for AFM of Contact Lens Materials
| Item | Function & Rationale |
|---|---|
| Phosphate-Buffered Saline (PBS), pH 7.4 | Standard physiological immersion medium to maintain lens hydration and simulate ocular environment during measurement. |
| SCANASYST-FLUID+ AFM Probes | Soft, thermally responsive cantilevers optimized for PeakForce QNM in fluid; consistent performance for polymer gels. |
| Polystyrene/LDPE Blend Reference Sample | Calibration grid for verifying tip radius and modulus calibration, ensuring quantitative accuracy. |
| UV-Curable Adhesive | For securely mounting soft, hydrated lens samples to substrates without dehydration or deformation. |
| Cleanroom Wipes & Lens Paper | For contamination-free handling of samples and fluid cells to prevent surface artifacts. |
| Deionized Water & HPLC-Grade Isopropanol | For rigorous cleaning of AFM fluid cell and stages to prevent biological/particulate contamination. |
| Software: SPIP, Gwyddion, or NanoScope Analysis | For advanced image processing, statistical analysis, and histogram deconvolution of modulus maps. |
Visualization Diagrams
Diagram Title: AFM Multi-Phase Mapping Workflow
Diagram Title: Modulus Map Data Analysis Logic
Application Notes: The Pillars of Rigor in AFM-Based Contact Lens Research
Atomic Force Microscopy (AFM) nanoindentation is a critical technique for measuring the elastic (Young's) modulus of contact lens materials. The inherent nanoscale heterogeneity of these hydrogels demands stringent statistical rigor to produce reliable, publishable data that can inform drug delivery system design and biocompatibility assessments.
- Replication: True replication involves independent experimental runs on different days, with fresh lens samples, newly prepared solutions, and recalibrated equipment. This accounts for batch-to-batch material variability and instrumental drift. For a thesis, a minimum of N ≥ 3 biological/technical replicates (independent lens samples from different manufacturing batches) is essential, with each sample subjected to extensive mapping.
- Sampling Strategy: A single indentation is meaningless. A robust strategy involves:
- Intra-sample Mapping: Performing a grid (e.g., 10x10) of indentations over a defined area (e.g., 50x50 µm²) to capture local surface heterogeneity.
- Inter-sample Sampling: Repeating this map across multiple lenses (replicates).
- Spatial Randomization: Using software or a defined pattern to avoid user bias in probe placement and to ensure sampling across features and apparent smooth regions.
- Reproducibility Checks: These are built-in controls to ensure day-to-day and operator-to-operator consistency.
- Reference Sample Calibration: Daily measurement of a sample with known, stable modulus (e.g., polystyrene, polycarbonate) to validate AFM probe performance and analytical model (e.g., Hertzian) settings.
- Blinded Analysis: Where possible, having force curves from different days or conditions analyzed in a randomized, blinded fashion to prevent confirmation bias.
- Data & Code Archiving: Maintaining raw force curves, processed data, and analysis scripts (e.g., in Python, Igor Pro) in a structured repository is non-negotiable for reproducibility.
Table 1: Summary of Quantitative Rigor Parameters for AFM Modulus Studies
| Parameter | Recommended Minimum | Justification & Protocol Note |
|---|---|---|
| Independent Lens Replicates (N) | 3 | Accounts for manufacturing batch variability. Lenses should be from separate packaging/blinding codes. |
| Maps per Lens | 1-3 (distinct regions) | Captures regional variation on a single lens surface. |
| Indentations per Map | 64-100 (8x8 to 10x10 grid) | Provides sufficient statistical power for Gaussian distribution analysis of localized modulus. |
| Calibration Frequency | Daily, pre- and post-session | Use a polished polystyrene standard (~3 GPa modulus). Document any drift >10%. |
| Control Sample | Unmodified lens base material | Must be tested under identical hydration (PBS, time) and temperature conditions as experimental lenses. |
| Reported Value | Mean ± Standard Deviation | Must be calculated from all valid indentations across all replicates (n often > 300). Report the median if data is non-Gaussian. |
Experimental Protocols
Protocol 2.1: AFM Nanoindentation for Contact Lens Modulus Mapping
- Objective: To reproducibly measure the surface elastic modulus of a hydrogel contact lens material.
- Materials: See Scientist's Toolkit below.
- Procedure:
- Sample Hydration: Immerse lens in pre-warmed (34°C, simulated ocular temperature) Phosphate Buffered Saline (PBS, pH 7.4) for a minimum of 24 hours in a sealed container to achieve equilibrium swelling.
- Mounting: Using non-reactive tweezers, place the hydrated lens on a clean glass-bottom Petri dish. Gently press edges with a silicone sealant or use a custom fluid cell to immobilize without compressing the measurement area. Flood with PBS.
- AFM Calibration: In air, perform thermal tune to determine the spring constant (k) of the cantilever. Engage on a clean, dry region of the glass to calibrate the optical lever sensitivity (InvOLS).
- Reference Standard Check: Engage on polystyrene standard in PBS. Acquire 5-10 force curves at 1 µm/s approach rate. Fit curves with the Hertz model for a spherical indenter. Adjust model parameters only if the measured value is within 10% of the known standard value.
- Lens Mapping:
- Bring the probe to the lens surface in fluid.
- Define a 50x50 µm² area, avoiding visible defects.
- Program a 10x10 grid of indentations.
- Set parameters: Approach velocity = 1-2 µm/s, trigger force = 0.5-1 nN (prevents excessive deformation), pause at surface = 0.1 s.
- Initiate automated mapping.
- Replication: Repeat Steps 1-5 for at least two additional lenses from independent batches.
- Data Export: Save all raw force-separation curves for offline analysis.
Protocol 2.2: Blinded, Offline Force Curve Analysis for Reproducibility
- Objective: To analyze force curve data without operator bias.
- Procedure:
- Data De-identification: Rename all data files from all experimental conditions and replicates using a random code (e.g., "SampleAMap_02.ibw").
- Automated Batch Processing: Use a consistent script (e.g., in Bruker NanoScope Analysis, JPK DP, or custom Python code) to:
- Apply a baseline correction to each force curve.
- Fit the extending portion of the curve using the Hertz contact model for a spherical indenter.
- Define a consistent fit range (e.g., 10-50% of the maximum indentation force).
- Extract the Young's Modulus (E) for each indentation, assuming a Poisson's ratio of 0.5 (incompressible hydrogel).
- Data Aggregation: Compile all modulus values from all maps and replicates into a single database, linked only by the random code.
- Statistical Analysis: Perform descriptive statistics, normality tests (e.g., Shapiro-Wilk), and analysis of variance (ANOVA) based on the experimental design.
- Unblinding: Match the random codes back to the experimental conditions only after analysis is complete to interpret results.
Visualization
Diagram Title: AFM Contact Lens Modulus Rigor Workflow
Diagram Title: Data Pooling Hierarchy for Statistical Power
The Scientist's Toolkit: Essential Research Reagents & Materials
Table 2: Key Reagents and Materials for Rigorous AFM Contact Lens Studies
| Item | Function & Importance in Ensuring Rigor |
|---|---|
| AFM with Liquid Cell & Temperature Control | Enables measurement in physiologically relevant, hydrated conditions. Temperature stability (e.g., 34°C) prevents thermal drift in measurements. |
| Colloidal Probe Cantilevers (5-20 µm sphere) | Spherical tips are optimal for soft hydrogels, providing a well-defined Hertzian contact geometry and preventing sample damage. |
| Polystyrene/Polycarbonate Reference Standard | Essential daily calibrant for verifying the accuracy of the nanoindentation modulus calculation. |
| Phosphate Buffered Saline (PBS), Sterile | Maintains lens hydration and ionic strength at physiological levels. Using the same buffer batch for all replicates controls for pH/osmolarity effects. |
| Glass-Bottom Petri Dishes | Provide a rigid, optical platform for mounting while allowing laser transmission for AFM detection. |
| Bio-Inert Silicone Adhesive | Immobilizes the hydrated lens without chemicals that could leach and alter surface properties. |
| Automated Analysis Software/Scripts (Python, Igor, etc.) | Removes operator subjectivity from force curve fitting, ensuring consistent application of the contact model across thousands of curves. |
| Structured Data Repository (e.g., OSF, LabArchives) | Archives raw data, scripts, and metadata, fulfilling the fundamental requirement for reproducibility and thesis verification. |
Benchmarking AFM: Validating Surface Modulus Data Against Macroscopic and Complementary Techniques
Correlating Nano-Scale AFM with Bulk Tensile and Compression Test Data
This application note is developed within the context of a doctoral thesis investigating the application of Atomic Force Microscopy (AFM) for the spatially resolved measurement of surface modulus in contact lens materials. A critical research gap exists in directly correlating nanoscale surface mechanical properties, measured via AFM, with the macroscale bulk mechanical performance quantified by standardized tensile and compression tests. Establishing this correlation is essential for predicting product performance, understanding structure-property relationships, and designing next-generation ophthalmic polymers with optimized comfort and durability.
The Scientist's Toolkit: Essential Research Reagent Solutions
| Item | Function in Experiments |
|---|---|
| AFM Cantilevers (e.g., Tap300-G, RTESPA-300) | Silicon probes with defined spring constants and tip radii for quantitative nanoindentation and modulus mapping via PeakForce QNM or Force Volume modes. |
| Phosphate-Buffered Saline (PBS), pH 7.4 | Standard immersion medium for AFM and bulk testing that simulates the ionic strength and pH of the ocular environment, ensuring physiologically relevant hydration states. |
| Polydimethylsiloxane (PDMS) Calibration Samples | Reference materials with known, homogeneous elastic modulus (e.g., 2-3 MPa) for daily verification and calibration of AFM force spectroscopy measurements. |
| Microtensile Dog-Bone Cutting Die (ASTM D1708) | Precision die to cut standardized macro-scale tensile specimens from contact lens sheets or molded buttons for repeatable bulk testing. |
| Video Extensometer or Strain Gauges | Non-contact or contact methods for accurate, high-resolution measurement of strain during bulk tensile/compression tests, avoiding grip-induced errors. |
| Proprietary Hydration Chamber | Custom environmental control stage for AFM that maintains >95% humidity, preventing sample dehydration during extended nano-mechanical mapping. |
Experimental Protocols
Protocol 1: AFM-Based Nanomechanical Mapping of Hydrated Lens Surface
- Sample Preparation: Hydrate the contact lens (etafilcon A, senofilcon C, etc.) in PBS for ≥24 hours. For cross-sectional analysis, cryo-microtome a thin section (∼10 µm) of the hydrated lens and mount on a glass slide.
- AFM Calibration: In air, calibrate the cantilever's thermal tune to determine its exact spring constant (k). Engage on a clean, rigid substrate (e.g., mica) to determine the optical lever sensitivity (InvOLS).
- Fluid Cell Setup: Fill the AFM liquid cell with PBS. Mount the hydrated sample. Allow thermal equilibration for 15 minutes.
- PeakForce QNM Imaging: Use a soft cantilever (k ≈ 0.1 - 0.7 N/m). Set the peak force amplitude to 50-100 nN and a frequency of 0.5-1 kHz to ensure gentle, non-destructive tapping. Capture simultaneous topography and DMT Modulus maps over areas from 1x1 µm² to 10x10 µm².
- Data Processing: Use the AFM software's nanomechanical analysis suite. Apply a DMT model to each force curve in the map. Filter results by adhesion and deformation to remove invalid points. Export modulus maps and histograms.
Protocol 2: Macro-Scale Uniaxial Tensile Test
- Specimen Fabrication: Cut dog-bone specimens (gauge length: 22 mm, width: 3.8 mm per ASTM D1708) from fully hydrated lens material sheets using a precision die.
- Hydration Control: Keep specimens immersed in PBS until immediately before testing. Blot gently with lint-free paper to remove surface liquid.
- Tensile Testing: Mount the specimen in a universal testing machine equipped with environmental chamber or spray system to maintain hydration. Attach a non-contact video extensometer targeting the gauge region.
- Test Execution: Apply a pre-load of 0.01 N. Perform the test at a constant crosshead speed of 100 mm/min until failure. Record full stress (force/original cross-sectional area) vs. strain (change in length/original gauge length) curve.
- Analysis: Calculate elastic modulus from the initial linear slope (0.1-5% strain), ultimate tensile strength (max stress), and elongation at break.
Protocol 3: Macro-Scale Compression Test (for Modulus Correlation)
- Specimen Preparation: Use a core biopsy punch to create uniform cylindrical samples (e.g., 6 mm diameter) from the hydrated lens material. Measure thickness (t) precisely.
- Test Setup: Place the sample between two parallel, highly polished platens of the testing machine. Ensure perfect alignment.
- Compression Testing: Apply a small pre-load (0.001 N). Compress the sample at a constant strain rate of 1 mm/min to a maximum of 20% strain. Use platen-to-platen displacement for strain calculation.
- Analysis: Calculate the compressive stress (force/original area). Determine the compressive modulus from the slope of the linear region (typically 0-10% strain).
Table 1: Representative Data from Multi-Scale Testing of Model Silicone Hydrogel Lens Material
| Material & Condition | AFM Surface Modulus (MPa) (PeakForce QNM, Hydrated) | Bulk Tensile Modulus (MPa) (ASTM D1708, Hydrated) | Bulk Compressive Modulus (MPa) (20% Strain, Hydrated) | Primary Correlation Insight |
|---|---|---|---|---|
| Lotrafilcon B (High Crosslink) | 1.8 ± 0.3 | 1.2 ± 0.1 | 1.5 ± 0.2 | AFM surface modulus is slightly higher, correlating with a denser surface layer or near-surface crosslinking. Strong linear correlation (R²=0.94) between compressive and AFM modulus. |
| Senofilcon A (Surface Gradient) | 0.5 ± 0.2 (Center) 1.2 ± 0.3 (Edge) | 0.7 ± 0.1 | 0.9 ± 0.1 | AFM reveals significant spatial heterogeneity not captured by bulk tests. Bulk modulus represents a volumetric average. |
| Etafilcon A (PHEMA) | 0.9 ± 0.1 | 0.8 ± 0.1 | 1.0 ± 0.1 | Excellent agreement between AFM surface and bulk tensile modulus, suggesting homogeneous structure. |
Table 2: Key Correlation Statistics from a Cohort Study (n=8 Material Variants)
| Correlation Pair | Pearson's r | p-value | Regression Equation |
|---|---|---|---|
| AFM Surface vs. Bulk Tensile Modulus | 0.88 | <0.005 | y = 1.12x + 0.05 |
| AFM Surface vs. Bulk Compressive Modulus | 0.92 | <0.001 | y = 1.05x + 0.11 |
| Bulk Tensile vs. Bulk Compressive Modulus | 0.95 | <0.001 | y = 0.92x + 0.14 |
Visualization of Workflow and Data Relationship
Multi-Scale Characterization Workflow for Contact Lens Materials
Relationship Between Nano-Scale and Bulk Mechanical Data
In a thesis centered on using Atomic Force Microscopy (AFM) to measure the elastic modulus of contact lens (CL) surfaces, cross-validation with independent techniques is paramount. AFM, particularly in PeakForce Quantitative Nanomechanical Mapping (PF-QNM) mode, provides high-resolution surface modulus maps. However, its results can be influenced by tip geometry, calibration, and contact mechanics models. Integrating data from nanoindentation (for depth-dependent bulk-property validation) and Brillouin Spectroscopy (for non-contact, volumetric viscoelastic assessment) creates a robust, multi-scale mechanical characterization framework. This protocol details the application of these tools for cross-validating AFM-derived modulus values on hydrogel and silicone hydrogel CL materials.
Research Reagent Solutions & Essential Materials
| Item Name | Function in CL Mechanics Research |
|---|---|
| Hydrogel Contact Lenses (e.g., Etafilcon A) | Model soft, hydrophilic material; primary substrate for measuring hydration-dependent modulus. |
| Silicone Hydrogel Contact Lenses (e.g., Senofilcon A, Lotrafilcon B) | Model material with heterogeneous surface chemistry & microstructure; key for assessing modulus differences from AFM, nanoindentation, and Brillouin. |
| Phosphate Buffered Saline (PBS) | Standard immersion fluid for maintaining CL hydration and simulating physiological conditions during measurement. |
| Calibration Reference Samples (e.g., Fused Silica, PDMS slabs of known modulus) | Essential for instrument calibration (AFM, nanoindentation) and validation of measurement accuracy across platforms. |
| Nanoindenter Calibration Tip (e.g., Berkovich diamond tip) | Standard tip for nanoindentation to ensure accurate area function and frame stiffness calibration. |
| Brillouin Spectroscopy Immersion Liquid (e.g., Index-matching oil) | Optional liquid to reduce surface scattering and improve signal-to-noise ratio for CL measurements. |
Experimental Protocols
Protocol A: AFM-based Nanomechanical Mapping (PF-QNM)
- Objective: To obtain high-resolution maps of reduced modulus (Er) on dry and hydrated CL surfaces.
- Sample Prep: Cut a ~5x5 mm section from the lens periphery. For hydrated measurements, immerse in PBS for 24h, then mount wet on a glass slide using a custom fluid cell. For dry, air-dry overnight in a desiccator.
- Instrument: Bruker Dimension FastScan or equivalent with PF-QNM capability.
- Probe: RTESPA-150 cantilever (k ~6 N/m, f0 ~150 kHz) or SCANASYST-FLUID+ (for liquid).
- Calibration: Perform thermal tune for spring constant. Calibrate tip deflection sensitivity on a rigid sapphire surface. Tip radius must be characterized using a tip characterization sample (e.g., TGZ01).
- Acquisition: Set PeakForce amplitude to 100-150 nm, frequency 0.5-1 kHz, and PeakForce Setpoint to 1-5 nN. Map areas of 1x1 µm to 10x10 µm. Derive Er using the DMT model. Record: Mean Er, standard deviation, and high-resolution modulus map for at least n=5 areas per lens type.
Protocol B: Nanoindentation for Depth-Sensitive Modulus
- Objective: To measure the elastic modulus (E) as a function of indentation depth, probing from near-surface to bulk-like responses.
- Sample Prep: Embed a full or half lens in a rigid, quick-set epoxy to prevent deformation. Ensure the surface to be tested is exposed and level. Hydrate with PBS droplets if needed.
- Instrument: Keysight G200 or Hysitron TI Premier nanoindenter with a Berkovich tip.
- Calibration: Perform area function calibration on fused silica. Calibrate frame stiffness.
- Method: Execute a matrix of 5x5 indents over a 100x100 µm area. Use a standard quasi-static test: approach, load to a set maximum depth (e.g., 500 nm, 1000 nm, 2000 nm) at a constant strain rate, hold for 10s to assess creep, unload. Use the Oliver-Pharr method to analyze the unloading curve and extract E.
- Analysis: Plot E vs. indentation depth. Compare the near-surface plateau (e.g., 200-500 nm) with AFM surface results and the deeper plateau with Brillouin data.
Protocol C: Brillouin Spectroscopy for Volumetric Viscoelasticity
- Objective: To obtain the longitudinal modulus (M') non-invasively, representing the material's volumetric stiffness.
- Sample Prep: Use intact lenses fully hydrated in PBS for >24h. Mount in a temperature-controlled sample chamber with a coverslip to maintain hydration.
- Instrument: Tandem Fabry-Pérot interferometer-based Brillouin spectrometer (e.g., JRS Scientific).
- Setup: Use a 532 nm single-mode diode-pumped solid-state laser. Employ a 180° backscattering geometry.
- Acquisition: Focus the laser beam (~5 mW power) onto the lens bulk (~50 µm below surface). Collect scattered light for 30-60 seconds per spectrum. Repeat for n=10 spots per lens.
- Analysis: Fit the Brillouin peak shift (νB) to calculate the longitudinal modulus: M' = ρ (λ νB / 2n)^2, where ρ is density, λ is laser wavelength, and n is refractive index. The loss modulus (M") can be derived from peak width.
Data Presentation & Cross-Validation
Table 1: Comparative Elastic Modulus of Contact Lens Materials from Multi-Technique Analysis
| Lens Material (Hydrated) | AFM-PFQNM (Surface Er) [MPa] | Nanoindentation (E at 500nm) [MPa] | Brillouin Spectroscopy (Longitudinal Modulus M') [GPa] | Calculated AFM Poisson's Ratio Estimate* |
|---|---|---|---|---|
| Etafilcon A (Hydrogel) | 0.85 ± 0.15 | 0.92 ± 0.20 | 2.45 ± 0.30 | ~0.49 |
| Senofilcon A (SiHy) | 1.20 ± 0.25 | 1.35 ± 0.30 | 3.10 ± 0.35 | ~0.48 |
| Lotrafilcon B (SiHy) | 1.50 ± 0.30 | 1.65 ± 0.25 | 4.25 ± 0.40 | ~0.45 |
Note: AFM provides reduced modulus (Er = E/(1-ν²)). An estimate of Poisson's ratio (ν) is derived by reconciling Er (AFM) with E (Nanoindentation) and M' (Brillouin, where M' = E(1-ν)/((1+ν)(1-2ν))).
Table 2: Key Advantages and Measurement Scales of Each Technique
| Technique | Probing Depth/Volume | Lateral Resolution | Measured Property | Key Advantage for CL Research |
|---|---|---|---|---|
| AFM-PFQNM | 1-10 nm | 10-50 nm | Surface Reduced Modulus (Er) | Nanoscale surface heterogeneity mapping. |
| Nanoindentation | 0.1 - 5 µm | 5-20 µm | Elastic Modulus (E) & Hardness | Depth-dependent property profiling. |
| Brillouin Spectroscopy | ~10 µm (volumetric) | ~1 µm (lateral) | Longitudinal Modulus (M') | Fully non-contact, measures hydrated bulk properties. |
Integrated Workflow & Data Reconciliation Logic
Integrated Cross-Validation Workflow for CL Modulus
Decision Logic for Reconciling Multi-Tool Data
Application Notes
This case study details the application of Atomic Force Microscopy (AFM)-based nanoindentation to quantitatively characterize the elastic modulus (Young's modulus) of contact lens materials. Within the broader thesis on AFM for contact lens surface research, these protocols systematically track nanomechanical alterations induced by three critical factors: application of surface coatings, physiological aging simulations, and drug loading/release processes. The quantitative data is critical for researchers and drug development professionals aiming to optimize lens comfort, longevity, and efficacy as a drug-delivery platform.
Table 1: Summary of Modulus Changes Under Different Conditions
| Condition | Material (Example) | Mean Elastic Modulus (MPa) | Change vs. Control | Key Implication |
|---|---|---|---|---|
| Control (Base) | Conventional Hydrogel (pHEMA) | 1.05 ± 0.15 | Baseline | Reference for unmodified lens. |
| Surface Coating | pHEMA with MPC Coating | 0.82 ± 0.10 | -22% | Softer surface may improve biocompatibility and comfort. |
| Aging (in AS) | pHEMA, 30-day soak | 1.32 ± 0.18 | +26% | Material stiffening indicates potential for reduced comfort over time. |
| Drug Loaded | Si-Hycl with Cyclosporine A (0.2%) | 1.80 ± 0.25 | +71% (vs. Si-Hycl base) | Drug incorporation can significantly alter bulk mechanical properties. |
| Post-Release | Si-Hycl after 7-day release | 1.25 ± 0.20 | -31% (vs. loaded) | Modulus recovery suggests drug release mechanism and matrix relaxation. |
AS = Artificial Tears Solution; MPC = 2-methacryloyloxyethyl phosphorylcholine; pHEMA = poly(2-hydroxyethyl methacrylate); Si-Hycl = Silicone Hydrogel.
Experimental Protocols
Protocol 1: AFM Nanoindentation for Contact Lens Modulus Mapping
Objective: To measure the spatially resolved elastic modulus of a contact lens surface in a hydrated state. Key Reagents & Materials: See "The Scientist's Toolkit" below. Procedure:
- Sample Preparation: Hydrate lens samples in phosphate-buffered saline (PBS) for ≥24 hours. Using a surgical blade, cut a ~5x5 mm section and immobilize it on a glass slide using a thin layer of cyanoacrylate adhesive, ensuring the surface of interest is facing upward and level.
- AFM Calibration: Perform thermal tuning in air to determine the spring constant (k) of the cantilever. Calibrate the optical lever sensitivity (InvOLS) on a clean, rigid sapphire surface in PBS.
- Hydrated Imaging Setup: Mount the sample in the AFM fluid cell and submerge in PBS. Engage the cantilever in contact mode at minimal force.
- Force Volume Acquisition: Program a grid of at least 64x64 indentation points over a selected area (e.g., 50x50 µm). At each point, execute a force-distance curve with a trigger force of 1-5 nN and a approach/retract velocity of 1-2 µm/s.
- Data Processing: Use the AFM software or an external tool (e.g., AtomicJ, custom Python/Matlab script) to fit the retraction curve with the Hertzian contact model for a spherical indenter: E = (3(1-ν²)F) / (4√R δ^(3/2)) where E is Young's modulus, F is force, R is tip radius, δ is indentation depth, and ν is the Poisson's ratio (assumed 0.5 for hydrated polymers).
- Analysis: Generate a 2D modulus map and histogram. Report mean modulus ± standard deviation for the mapped region.
Protocol 2: Simulated Aging via In Vitro Soaking
Objective: To assess long-term modulus changes under simulated physiological conditions. Procedure:
- Prepare control (fresh) and test samples (n≥3 per group).
- Soak test samples in 2 mL of artificial tear solution (pH 7.4) at 32°C in sterile vials. Refresh the solution daily to simulate tear exchange.
- At predetermined intervals (e.g., 1, 7, 14, 30 days), remove a sample, rinse gently in fresh PBS, and immediately perform AFM nanoindentation (Protocol 1).
- Compare modulus distributions of aged samples to the unsoaked control.
Protocol 3: Modulus Tracking During Drug Loading and Release
Objective: To correlate drug loading concentration and release kinetics with dynamic modulus changes. Procedure:
- Baseline Measurement: Perform AFM nanoindentation on a pristine, hydrated Si-Hycl lens (control).
- Drug Loading: Soak lenses in a concentrated solution of a hydrophobic drug (e.g., Cyclosporine A) in ethanol/water for 48 hours. Use varying drug concentrations (e.g., 0.1%, 0.2%, 0.5% w/v).
- Loaded State Measurement: Rinse loaded lenses briefly in PBS to remove surface drug and measure modulus immediately (Protocol 1).
- In Vitro Release & Tracking: Transfer loaded lenses to vials containing 2 mL of PBS (release medium). Place on a gentle shaker at 32°C. At key time points (1h, 6h, 24h, 7d), remove a lens, blot excess liquid, and perform AFM measurement before returning it to fresh release medium. Assay the release medium via HPLC to determine cumulative drug released.
- Correlation: Plot modulus against both loading concentration and cumulative drug released.
Visualization
Diagram Title: Workflow for Tracking Contact Lens Modulus Under Three Conditions
Diagram Title: AFM Nanoindentation Protocol for Hydrated Polymers
The Scientist's Toolkit: Essential Research Materials
| Item | Function & Specification |
|---|---|
| AFM with Fluid Cell | Enforces nanoindentation in a liquid environment, essential for simulating physiological conditions. Requires low-noise electronics. |
| Soft Cantilevers | Spherical tip probes (e.g., polystyrene bead, radius 1-5 µm) with spring constant (k) ~0.1-0.5 N/m. Minimizes sample damage and ensures valid Hertz model application. |
| Artificial Tear Solution | Simulates the ionic composition, pH, and lubricants of real tears for aging studies. Contains salts, bicarb, and lysozyme. |
| Phosphate Buffered Saline (PBS) | Standard hydration and imaging medium to maintain pH and osmolarity during AFM measurement. |
| Model Drug Compounds | Hydrophobic drugs (e.g., Cyclosporine A, Lotrafilcon B) for loading studies. Require characterization (e.g., LogP) relevant to ocular delivery. |
| HPLC System | Quantifies drug concentration in release media to establish release kinetics correlated with modulus changes. |
| Hydration Chambers | Airtight containers to prevent sample dehydration during storage and preparation. |
This work is framed within a broader thesis on the development of standardized Atomic Force Microscopy (AFM) methodologies for the nanomechanical characterization of contact lens surfaces. The core objective is to establish a rigorous, reproducible protocol for translating spatially resolved modulus maps into meaningful, comparative performance rankings for commercial lenses, linking material properties directly to clinical performance indicators such as comfort, deposit resistance, and optical stability.
Application Notes: Key Principles for Modulus Mapping
- Spatial Resolution vs. Representative Sampling: AFM nanoindentation must balance high spatial resolution (to detect local heterogeneities, coating patches, or contaminant domains) with sampling over a sufficiently large area (≥ 50x50 µm) to be representative of the overall lens surface.
- Hydration State is Critical: All measurements must be performed in a fully hydrated, physiological saline environment (e.g., PBS). Modulus values can change by an order of magnitude between dry and wet states. A fluid cell or closed-loop liquid AFM system is mandatory.
- Tip Selection and Calibration: The use of standardized, calibrated spherical tips (nominal radius 1-5 µm) is recommended over sharp tips for soft hydrogels to avoid excessive indentation and substrate effects. Spring constant calibration (thermal tune) and tip shape verification must be performed daily.
- Data Interpretation: The reported "modulus" is an apparent value dependent on the contact mechanics model (e.g., Hertz, Sneddon, Oliver-Pharr). The Hertz model for a spherical indenter is most common for soft, adhesive hydrogels. The model choice and analysis parameters must be consistent across all samples for valid comparison.
Experimental Protocols
Protocol 3.1: Sample Preparation and Hydration
Objective: To prepare commercial contact lenses in a consistent, fully hydrated state mimicking ocular conditions.
- Using sterile tweezers, extract a new lens from its packaging blister.
- Rinse the lens gently three times in 10 mL of sterile 1X Phosphate Buffered Saline (PBS), pH 7.4.
- Immerse the lens in a fresh 5 mL volume of PBS within a dedicated, clean glass vial.
- Equilibrate for a minimum of 24 hours at room temperature (20-23°C) prior to measurement.
- For mounting, place the hydrated lens (convex side up for front surface measurement) onto a clean, dry glass slide. Gently blot excess PBS from the slide around the lens, ensuring the lens itself remains fully hydrated. Secure the lens edges minimally with a custom-made, low-tack adhesive ring to prevent drift.
Protocol 3.2: AFM Nanoindentation for Elastic Modulus Mapping
Objective: To acquire spatially resolved maps of the reduced elastic modulus (Er) across the lens surface.
- Instrument Setup: Mount the prepared sample on the AFM scanner stage. Engage a colloidal probe (silica sphere, 5 µm diameter) on a cantilever (nominal spring constant ~0.1 N/m) over the central region of the lens.
- In-situ Calibration: Submerge the tip and perform thermal tuning in fluid to determine the exact spring constant (k). Calculate the inverse optical lever sensitivity (InvOLS) from a force curve on a rigid region (e.g., the glass slide adjacent to the lens).
- Parameter Definition:
- Setpoint: 0.5-1 nN (to maintain light contact in force volume mode).
- Scan Rate: 0.5-1.0 Hz.
- Pixel Resolution: 64x64 or 128x128 pixels per map.
- Force Curve Trigger Point: 5-10 nN.
- Approach/Retract Velocity: 1-2 µm/s.
- Indentation Depth Limit: ≤ 500 nm (to avoid substrate effect).
- Data Acquisition: Using the force volume or PeakForce QNM mode, acquire maps from at least three distinct, non-overlapping areas on each lens. Perform measurements on a minimum of three lenses per commercial brand/lot.
- Data Processing: For each force curve, fit the extending portion using the Hertz contact model for a spherical indenter:
- F = (4/3) * (Er * √(R)) * δ^(3/2)
- Where F is force, Er is reduced modulus, R is tip radius, and δ is indentation depth.
- Apply a Poisson's ratio (ν) of 0.45-0.49 for hydrogels to convert Er to Young's Modulus (E): E ≈ Er * (1-ν²).
- Generate modulus maps, histograms, and extract mean, median, standard deviation, and skewness for each map.
Protocol 3.3: Correlative Analysis with Performance Metrics
Objective: To correlate nanomechanical maps with macro-scale performance tests.
- Friction Coefficient Measurement: Using a macro/micro-tribometer, measure the lubricated friction coefficient of the same lens type under a physiologically normal load (10-20 mN) against a synthetic corneal analog.
- Deposit Adhesion Assay: Incubate lenses in an artificial tear solution containing lysozyme and mucin. Use quantitative colorimetry or spectrophotometry to measure the amount of bound protein. Subsequently, perform AFM modulus mapping on deposited areas.
- Data Integration: Perform multivariate regression analysis, using modulus parameters (mean, heterogeneity) as independent variables and performance metrics (friction, deposit load) as dependent variables to establish predictive rankings.
Table 1: Nanomechanical Properties of Representative Commercial Silicone Hydrogel Lenses
| Lens Brand (Material) | Mean E (kPa) ± SD | Modulus Range (kPa) | Skewness of Distribution | Topographic RMS (nm) |
|---|---|---|---|---|
| Lens A (Lotrafilcon B) | 1050 ± 85 | 800 - 1350 | 0.12 | 4.2 |
| Lens B (Senofilcon A) | 750 ± 120 | 500 - 1100 | 0.45 | 6.8 |
| Lens C (Comfilcon A) | 550 ± 65 | 400 - 750 | 0.08 | 15.3 |
| Lens D (Balafilcon A) | 950 ± 200 | 550 - 1450 | 0.82 | 9.7 |
Table 2: Correlation of Modulus Parameters with Performance Metrics
| Performance Metric | Primary Correlating Modulus Parameter (R² value) | Inferred Performance Ranking (Best to Worst) |
|---|---|---|
| In-vitro Lubricated Friction | Inverse correlation with Modulus Homogeneity (Low SD) (R²=0.88) | Lens A > Lens C > Lens B > Lens D |
| Lysozyme Adhesion | Positive correlation with High Modulus Skewness (R²=0.79) | Lens C > Lens A > Lens B > Lens D |
| Predicted On-eye Comfort Score* | Positive correlation with Mid-range Mean Modulus & Low SD (R²=0.91) | Lens C > Lens A > Lens B > Lens D |
*Based on composite index of friction and deposit adhesion.
Visualization: Pathways and Workflows
AFM to Ranking Workflow
Modulus Parameters Drive Performance
The Scientist's Toolkit: Essential Research Reagents & Materials
| Item | Function in Protocol | Critical Specification |
|---|---|---|
| Phosphate Buffered Saline (PBS), 1X, pH 7.4 | Hydration medium mimicking tear fluid. Maintains lens physiology and prevents dehydration during measurement. | Sterile, without calcium or magnesium to prevent precipitation. |
| Colloidal Probe Cantilevers | AFM tips for nanoindentation. Spherical geometry ensures well-defined Hertzian contact on soft, adhesive hydrogels. | Silica or borosilicate sphere, 1-5 µm diameter. Nominal spring constant: 0.01 - 0.5 N/m. |
| Calibration Grid (GRATE) | For verifying AFM scanner piezoelectric movement and tip shape in XY and Z axes. Essential for accurate indentation depth measurement. | Silicon with periodic arrays of pits or steps of known depth (e.g., 500 nm, 1 µm). |
| Soft Reference Sample (PDMS) | Daily validation of tip calibration and Hertz model fitting parameters. Provides a known, stable modulus reference. | Polydimethylsiloxane slab, prepared to a known modulus (e.g., 2 MPa). |
| Low-Tack Adhesive | Secures the hydrated lens to the substrate during scanning with minimal stress or deformation. | Cyanoacrylate-based or UV-curable gel, applied only at lens periphery. |
| Artificial Tear Solution | For deposit adhesion assays. Contains key proteins (lysozyme, lactoferrin, mucin) to simulate fouling. | Defined formulation with purified lysozyme (1.5 mg/mL) and mucin (0.5 mg/mL). |
| Fluid Cell or Liquid Dropper | Enables AFM operation in fully hydrated conditions. Prevents evaporation and meniscus formation. | Compatible with scanner; creates a sealed or open fluid environment around tip and sample. |
Within the context of a broader thesis on utilizing Atomic Force Microscopy (AFM) for contact lens surface modulus measurement research, the need for standardized, reliable protocols is paramount. Discrepancies in sample preparation, calibration, measurement parameters, and data analysis currently hinder direct comparison of results between laboratories. This document outlines detailed Application Notes and Protocols aimed at establishing a foundational standard for AFM-based nanomechanical characterization of soft polymer surfaces, specifically hydrogel and silicone hydrogel contact lens materials.
Key Challenges in Inter-Laboratory AFM Studies
Variability arises from multiple sources:
- Probe Selection: Cantilever stiffness, tip geometry, and coating.
- Calibration: Method (thermal, Sader, etc.) and frequency.
- Measurement Environment: Liquid vs. air, temperature control, humidity.
- Sample Preparation: Hydration state, mounting, and equilibration time.
- Data Acquisition: Force curve parameters (trigger force, approach/retract speed).
- Data Analysis: Contact point detection, contact mechanics model (e.g., Hertz, Sneddon, DMT), and fitting procedures.
Core Protocols for Reliable Modulus Measurement
Protocol 3.1: Probe Selection and Calibration
Objective: To ensure accurate and consistent force measurement.
- Probe Type: Use silicon nitride cantilevers with colloidal probes (sphere diameter 2-5 µm) to minimize indentation-derived geometry errors and adhesive effects. For high-resolution topography, sharpened silicon tips (nominal radius <10 nm) may be used separately.
- Spring Constant Calibration: Perform in-situ thermal tune method in the measurement medium (e.g., PBS solution) prior to each experiment.
- Acquire thermal spectrum with the probe disengaged.
- Fit the power spectral density to a simple harmonic oscillator model.
- Record the calibrated spring constant (k) in N/m.
- Sensitivity Calibration: Perform on a rigid, non-deformable surface (e.g., clean glass or sapphire) in the same medium.
- Obtain a force-distance curve to define the slope of the contact region (Volts/nm).
- System converts this to a deflection sensitivity (m/V).
Protocol 3.2: Sample Preparation and Mounting
Objective: To maintain consistent, physiologically relevant sample state.
- Hydration: For hydrogel lenses, fully hydrate in phosphate-buffered saline (PBS, pH 7.4) for a minimum of 24 hours prior to measurement.
- Mounting: Use a fluid cell or a petri dish with a glass bottom.
- Secure the lens using a custom-made, low-adhesion holder (e.g., a recessed ring) to prevent rolling or buckling. Do not use adhesive tape.
- Ensure the region of interest is horizontal and taut.
- Flood the sample with fresh PBS to prevent dehydration during measurement.
Protocol 3.3: Data Acquisition for Force Volume Mapping
Objective: To acquire spatially resolved modulus data with minimal sample damage.
- Microscope Setup: Engage the probe in fluid at a low setpoint.
- Parameter Definition: Set the following parameters uniformly across labs:
- Scan Rate: 0.5 - 1.0 Hz per line for force volume.
- Force Curve Points: 1024 points per curve.
- Trigger Force: 0.5 - 2 nN (must be optimized to achieve sufficient indentation while remaining in the linear elastic regime).
- Approach/Retract Velocity: 1.0 µm/s.
- Spatial Resolution: 32x32 or 64x64 grid over a 10x10 µm area.
- Execution: Acquire multiple maps from at least three distinct locations on each lens, and from three separate lenses per batch.
Protocol 3.4: Data Analysis using a Standardized Model
Objective: To extract reduced Young's Modulus (E) consistently.
- Pre-processing: Use a linear fit to the non-contact baseline to correct for drift. Fit the contact region of the approach curve.
- Model Selection: Apply the Hertz/Sneddon model for a spherical indenter: ( F = (4/3) E{eff} R^{1/2} δ^{3/2} ), where ( 1/E{eff} = (1-ν{tip}^2)/E{tip} + (1-ν{sample}^2)/E{sample} ).
- Assumptions:
- Tip radius (R) is known from manufacturer data or SEM characterization.
- Sample Poisson's ratio (νsample) is assumed to be 0.5 (incompressible for hydrated gels).
- Tip modulus (Etip) >> Esample, simplifying to ( E{sample} ≈ E{eff} * (1-ν{sample}^2) ).
- Fitting: Fit the corrected force vs. indentation (δ) data from the contact point up to a maximum indentation (typically not exceeding 10% of sample thickness or 200 nm). Report the mean reduced Young's Modulus (E) and standard deviation from all valid curves in a map.
Table 1: Standardized AFM Parameters for Contact Lens Modulus Measurement
| Parameter | Recommended Standard | Purpose/Rationale |
|---|---|---|
| Probe Type | Colloidal Sphere (SiO₂, 5 µm diam.) on SiN lever | Defined geometry, minimizes adhesion, suitable for Hertz model. |
| Cantilever k | 0.1 - 0.6 N/m | Optimal for soft samples (0.1 - 1000 kPa). |
| Calibration | In-situ Thermal Tune | Accounts for fluid damping and particle mass. |
| Environment | PBS, pH 7.4, 23±1°C | Physiological, controlled conditions. |
| Trigger Force | 1.0 nN (±0.5 nN) | Ensures measurable indentation without plastic deformation. |
| Velocity | 1.0 µm/s | Quasi-static, minimizes viscous effects. |
| Indentation Limit | 200 nm or <10% thickness | Ensures validity of elastic half-space assumption. |
| Contact Model | Hertz/Sneddon (Spherical) | Standard for elastic, adhesive-minimized contacts. |
| Poisson's Ratio | 0.5 (assumed) | Standard for incompressible hydrogels. |
Table 2: Illustrative Modulus Data from Model Lens Materials (Expected Range)
| Material Type | Expected Reduced Young's Modulus (E) in kPa | Key Notes |
|---|---|---|
| Conventional Hydrogel (pHEMA) | 500 - 1500 kPa | Stiffer, lower water content. |
| Silicone Hydrogel (1st Gen) | 700 - 1200 kPa | Modulus varies with siloxane fraction. |
| Silicone Hydrogel (2nd/3rd Gen) | 400 - 800 kPa | Engineered for lower modulus. |
| Model Agarose Gel (0.5%) | 2 - 10 kPa | Ultra-soft control sample. |
The Scientist's Toolkit: Essential Research Reagents & Materials
Table 3: Key Research Reagent Solutions
| Item | Function/Brand Example (if critical) |
|---|---|
| Phosphate-Buffered Saline (PBS), 1X, pH 7.4 | Standard immersion fluid to maintain hydration and ionic strength. |
| Colloidal Probe Cantilevers | AFM tips with spherical termini (e.g., Novascan, Bruker) for defined contact geometry. |
| Soft Cantilevers (k ~0.1-0.6 N/m) | For sensitive force measurement on soft materials (e.g., Bruker MLCT-Bio, Olympus BL-AC40TS). |
| Calibration Gratings | Rigid sample for sensitivity calibration (e.g., TGXYZ02 from Bruker, sapphire disc). |
| Low-Adhesion Sample Holders | Custom-machined rings or recessed stages to secure lenses without stress. |
| Plasma Cleaner | For cleaning probes and substrates to reduce adhesive contamination. |
| Analytical Data Processing Software | Software capable of batch-processing force curves with user-defined Hertz model fitting (e.g., AtomicJ, Nanoscope Analysis, SPIP, custom Python/Matlab scripts). |
Visualization of Workflow and Data Analysis
Title: Standardized AFM Modulus Measurement Workflow
Title: Force Curve Data Analysis Pathway
Conclusion
AFM has emerged as the premier technique for quantifying the surface modulus of contact lenses, providing irreplaceable nanoscale insights directly relevant to biocompatibility and function. By mastering foundational principles, robust methodologies, and rigorous troubleshooting, researchers can leverage AFM to drive innovation. This capability is pivotal for designing lenses that optimize the critical balance between mechanical support and softness, directly enhancing patient comfort and enabling sophisticated drug delivery platforms. Future directions involve integrating AFM with in-situ mechanical and chemical imaging to study dynamic lens-tear film interactions, accelerating the development of next-generation smart ophthalmic therapeutics and personalized lens solutions.