SPR Biosensors for Environmental Toxin Detection: Principles, Protocols, and Future Applications in Biomedical Research
Surface Plasmon Resonance (SPR) has emerged as a powerful, label-free technique for the real-time analysis of environmental toxins.
SPR Biosensors for Environmental Toxin Detection: Principles, Protocols, and Future Applications in Biomedical Research
Abstract
Surface Plasmon Resonance (SPR) has emerged as a powerful, label-free technique for the real-time analysis of environmental toxins. This article provides a comprehensive guide for researchers and scientists, detailing the foundational physics of SPR, methodological protocols for detecting toxins like pesticides, mycotoxins, and heavy metals, practical troubleshooting strategies for assay optimization, and a critical validation against techniques like ELISA and HPLC. The content addresses the full scope from basic exploration to advanced application, empowering professionals in drug development and environmental health to implement robust SPR-based analytical methods.
Understanding SPR: The Core Principles for Label-Free Toxin Detection
What is Surface Plasmon Resonance (SPR)? A Primer for Researchers
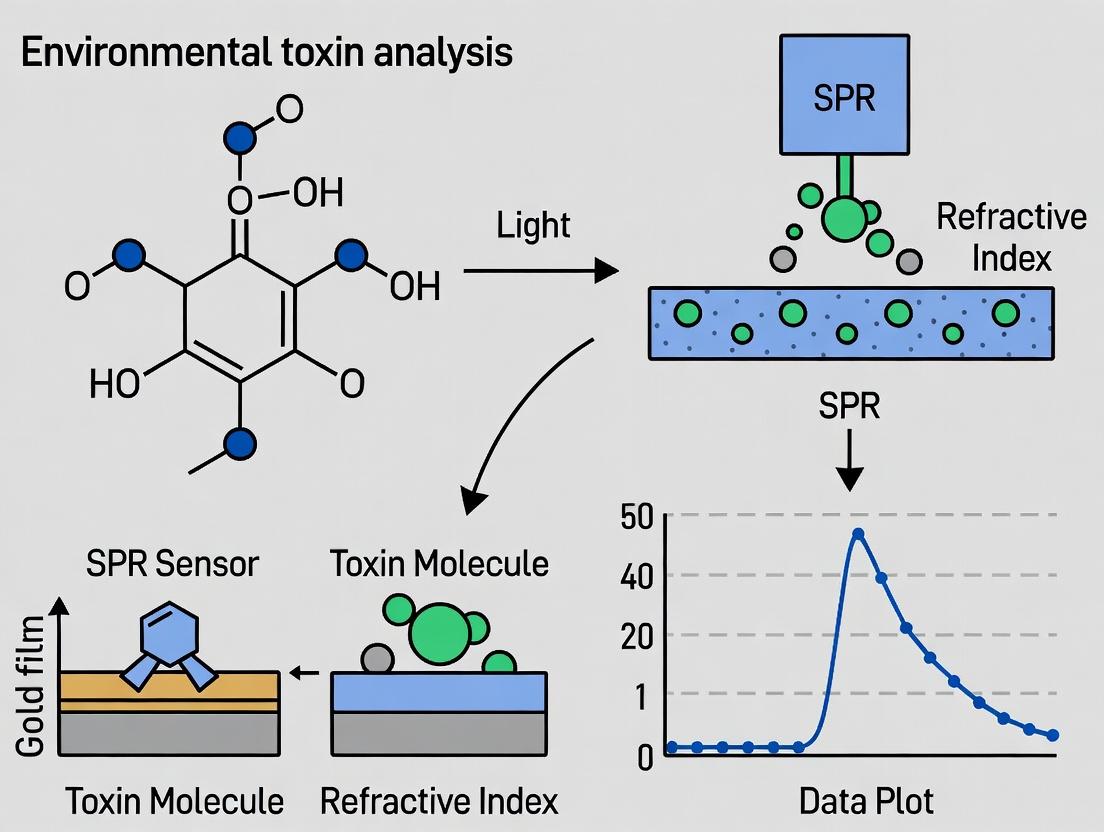
Surface Plasmon Resonance (SPR) is a label-free, real-time optical technique used to measure biomolecular interactions. It detects changes in the refractive index at the surface of a thin metal film (typically gold) upon binding of an analyte to an immobilized ligand. Within the context of a thesis on environmental toxin analysis, SPR offers a powerful platform for the sensitive, quantitative detection of contaminants (e.g., pesticides, mycotoxins, heavy metals) by monitoring their interaction with specific capture molecules like antibodies, aptamers, or molecularly imprinted polymers.
Core Principles and Quantitative Data
SPR instruments measure the resonance angle shift (Response Units, RU) over time, generating a sensorgram. Key kinetic and affinity parameters are derived from this data.
Table 1: Key SPR Parameters and Typical Values for Toxin Analysis
| Parameter | Description | Typical Range for Small Toxin Analysis |
|---|---|---|
| Association Rate Constant (ka) | Speed of complex formation | 10^3 - 10^6 M⁻¹s⁻¹ |
| Dissociation Rate Constant (kd) | Speed of complex breakdown | 10^-1 - 10^-4 s⁻¹ |
| Equilibrium Dissociation Constant (KD) | Affinity (KD = kd/ka) | 10^-6 - 10^-9 M (nM-µM) |
| Limit of Detection (LOD) | Minimum detectable toxin concentration | 0.01 - 10 ng/mL |
| Assay Time | Time for a single binding cycle | 5 - 15 minutes |
| Rmax (Maximum Response) | Theoretical RU at full surface saturation | Scale with ligand molecular weight |
Application Notes: Direct and Competitive Assays for Toxins
Most small molecule toxins (<1000 Da) are detected using indirect, competitive inhibition assays due to their low mass-induced refractive index change.
Table 2: Comparison of SPR Assay Formats for Environmental Toxins
| Assay Format | Principle | Best For | Advantages | Disadvantages |
|---|---|---|---|---|
| Direct Binding | Toxin immobilized, antibody analyte | Large toxins, proteins | Simple, true kinetics | Difficult for small molecules, immobilization challenges |
| Competitive Inhibition | Toxin analog immobilized; Sample toxin & antibody mixed/injected | Small molecules (pesticides, mycotoxins) | High sensitivity, handles small molecules | More steps, data requires inhibition curve analysis |
| Sandwich Assay | Capture antibody immobilized, binds toxin, then detection antibody | Large toxins with multiple epitopes | High specificity and signal amplification | Not suitable for most small molecules |
Detailed Experimental Protocols
Protocol 4.1: Immobilization of a Toxin-Protein Conjugate via Amine Coupling
Objective: Covalently attach a BSA-Ochratoxin A conjugate to a CM5 sensor chip for a competitive immunoassay.
Materials:
- SPR instrument (e.g., Biacore, SensiQ)
- CM5 sensor chip (carboxymethylated dextran)
- Running Buffer: HBS-EP (10 mM HEPES, 150 mM NaCl, 3 mM EDTA, 0.05% v/v Surfactant P20, pH 7.4)
- BSA-Ochratoxin A conjugate (100 µg/mL in 10 mM sodium acetate, pH 4.5)
- Activation Solutions: 0.4 M EDC (N-Ethyl-N'-(3-dimethylaminopropyl)carbodiimide) and 0.1 M NHS (N-hydroxysuccinimide)
- Blocking Solution: 1.0 M Ethanolamine-HCl, pH 8.5
- Regeneration Solution: 10 mM Glycine-HCl, pH 2.0
Method:
- System Preparation: Prime the instrument with running buffer. Dock the CM5 chip.
- Baseline Stabilization: Flow running buffer over all flow cells at 10 µL/min until a stable baseline is achieved.
- Surface Activation: Inject a 1:1 mixture of EDC and NHS (typically 35 µL, 10 µL/min) over the target flow cell(s). This activates carboxyl groups to reactive esters.
- Ligand Immobilization: Immediately inject the BSA-Ochratoxin A conjugate solution (70 µL, 10 µL/min) in appropriate sodium acetate buffer. Aim for a density of 5000-10000 RU.
- Blocking Excess Sites: Inject Ethanolamine-HCl (35 µL, 10 µL/min) to deactivate remaining esters.
- Surface Regeneration (Conditioning): Perform 2-3 injections of regeneration solution (10-30 s contact time) to remove non-covalently bound material. Re-stabilize in running buffer.
Protocol 4.2: Competitive Inhibition Assay for Toxin Quantification
Objective: Measure Ochratoxin A concentration in a spiked cereal sample extract.
Method:
- Sample Preparation: Extract ground cereal with 70% methanol/PBS. Centrifuge, dilute supernatant in running buffer to <5% organic solvent.
- Antibody-Incubated Sample Prep: Mix a fixed concentration of anti-Ochratoxin A monoclonal antibody (e.g., 50 nM) with either toxin standards (0.1, 1, 10, 100 ng/mL) or prepared sample extracts. Incubate at 25°C for 10 min.
- SPR Analysis:
- Set flow rate to 30 µL/min.
- Inject the antibody/toxin mixture (60 µL injection, 120 s dissociation) over the toxin-conjugate surface and a reference surface.
- Regenerate with a 30-second pulse of Glycine-HCl pH 2.0 after each cycle.
- The sensorgram response (RU) is inversely proportional to free toxin concentration in the mixture.
- Data Analysis: Plot the response (RU) versus the logarithm of standard toxin concentration. Fit a 4-parameter logistic curve. Interpolate sample concentrations from the standard curve.
Visualizations
Title: SPR Principle: Angle Shift Upon Molecular Binding
Title: Competitive Inhibition SPR Assay Workflow
The Scientist's Toolkit: Key Research Reagent Solutions
Table 3: Essential Materials for SPR-Based Toxin Analysis
| Item | Function in SPR Assay | Key Considerations for Toxin Research |
|---|---|---|
| Sensor Chips (CM5, C1, SA) | Provides a surface for ligand immobilization. CM5 is versatile (dextran). SA (streptavidin) for biotinylated capture. | Choose chip type based on ligand size/stability. For small toxins, use surfaces enabling dense conjugate immobilization. |
| Coupling Reagents (EDC/NHS) | Activates carboxylated surfaces for covalent amine coupling of proteins/peptides. | Standard for immobilizing toxin-protein conjugates or antibodies. Fresh preparation is critical. |
| Running Buffer (HBS-EP, PBS-P) | Maintains constant pH and ionic strength; surfactant minimizes non-specific binding. | Must be compatible with samples (e.g., tolerate low % organic solvent from toxin extracts). |
| Anti-Toxin Antibodies (Monoclonal) | Primary recognition element for the target toxin. Used in competitive format. | High affinity (low KD) and specificity are paramount. Check cross-reactivity profiles. |
| Toxin-Protein Conjugate (BSA, OVA) | Immobilized ligand that competes with free toxin for antibody binding. | Carrier protein should be different from assay blocking protein to avoid interference. |
| Regeneration Solutions (Glycine pH 2.0-3.0, NaOH) | Dissociates bound antibody to regenerate the sensor surface for next cycle. | Must be strong enough to regenerate but not damage the immobilized ligand. Requires optimization. |
| Analyte Standards (Pure Toxin) | Used to generate the calibration curve for quantitative analysis. | Source from certified supplier. Prepare fresh stock solutions in appropriate solvent. |
Why SPR for Environmental Toxins? Advantages of Real-Time, Label-Free Analysis.
This application note is developed within the broader thesis that Surface Plasmon Resonance (SPR) technology represents a paradigm shift in environmental monitoring by enabling the direct, label-free, and quantitative detection of low-molecular-weight toxins with high sensitivity and throughput. The core thesis posits that the real-time kinetic data provided by SPR surpasses endpoint assays, offering unparalleled insight into toxin-receptor interactions, which is critical for risk assessment and the development of mitigation strategies.
Core Advantages: Real-Time and Label-Free Analysis
Real-Time Analysis: SPR monitors biomolecular interactions as they happen, providing a continuous sensorgram. This allows for the direct measurement of association and dissociation rate constants (ka, kd) and the calculation of affinity constants (KD). For toxins, this kinetic profile can correlate with biological activity and potency.
Label-Free Detection: The detection principle relies on changes in refractive index at the sensor surface upon binding. This eliminates the need for fluorescent, enzymatic, or radioactive labels that can alter toxin behavior, compromise assay development time, and increase cost.
Quantitative Data: SPR provides robust, quantitative data on concentration, affinity, and kinetics from a single experiment.
Application Notes: Key Experimental Findings
Recent studies underscore the efficacy of SPR for environmental toxins. The following table summarizes quantitative data from recent research.
Table 1: Summary of Recent SPR Analyses for Environmental Toxins
| Target Toxin | Immobilized Ligand | Analyte (Toxin) | Reported LOD / Sensitivity | Key Affinity (KD) / Kinetic Data | Reference (Year) |
|---|---|---|---|---|---|
| Microcystin-LR | Anti-Microcystin Antibody | Microcystin-LR | 0.03 µg/L | KD: 1.8 x 10⁻⁹ M | Front. Chem. (2023) |
| Okadaic Acid | Protein Phosphatase 2A | Okadaic Acid | 0.1 nM | ka: 2.1 x 10⁵ M-1s-1; kd: 8.7 x 10⁻⁴ s-1 | Toxins (2023) |
| Saxitoxin | STX-binding Protein | Saxitoxin | 0.01 nM | KD: 0.15 nM | Anal. Chem. (2022) |
| Aflatoxin B1 | DNA Aptamer | Aflatoxin B1 | 0.005 ng/mL | -- | Biosens. Bioelectron. (2024) |
| Tetrodotoxin | Monoclonal Antibody | Tetrodotoxin | 0.1 ng/mL | KD: 2.4 nM | J. Hazard. Mater. (2023) |
Detailed Experimental Protocols
Protocol 1: Direct Binding Assay for Cyanotoxin (Microcystin) Detection
Objective: To determine the affinity and concentration of Microcystin-LR in a water sample using an antibody-functionalized sensor chip.
Materials: See "The Scientist's Toolkit" below. Procedure:
- Sensor Chip Preparation: Dock a CM5 series S sensor chip. Prime the system with HBS-EP+ buffer (pH 7.4).
- Ligand Immobilization: Activate the dextran surface with a 7-minute injection of a 1:1 mixture of 0.4 M EDC and 0.1 M NHS at 10 µL/min.
- Antibody Coupling: Dilute the anti-microcystin monoclonal antibody to 20 µg/mL in 10 mM sodium acetate buffer (pH 5.0). Inject over the activated surface for 7 minutes at 10 µL/min to achieve ~10,000 Response Units (RU).
- Blocking: Deactivate remaining esters with a 7-minute injection of 1 M ethanolamine-HCl (pH 8.5).
- Sample Analysis: Dilute water samples or microcystin standards in running buffer. Inject samples for 2 minutes (association phase) followed by a 3-minute dissociation phase with buffer flow.
- Regeneration: Regenerate the surface with a 30-second pulse of 10 mM glycine-HCl (pH 2.0).
- Data Analysis: Process sensorgrams by subtracting reference flow cell data. Fit the concentration series data to a 1:1 Langmuir binding model to calculate ka, kd, and KD.
Protocol 2: Inhibition Assay for Paralytic Shellfish Poisoning Toxins
Objective: To detect low molecular weight toxins (e.g., Saxitoxin) via competitive inhibition. Procedure:
- Immobilization: Immobilize a toxin-protein conjugate (e.g., STX-BSA) on a sensor chip as described in Protocol 1, steps 1-4.
- Pre-incubation: Mix a fixed, sub-saturating concentration of the detection antibody with varying concentrations of the sample/standard toxin. Incubate for 15-30 minutes.
- SPR Measurement: Inject the pre-mixed solutions over the toxin-conjugate surface. The signal (RU) is inversely proportional to the free toxin concentration in the sample, as toxin inhibits antibody binding to the surface.
- Calibration: Generate a standard curve of %Inhibition vs. log[toxin] to quantify unknown samples.
Signaling Pathway & Workflow Visualization
Diagram 1: Core SPR Detection Workflow for Toxins
Diagram 2: Toxin Inhibiting Key Cellular Enzyme
The Scientist's Toolkit: Research Reagent Solutions
Table 2: Essential Materials for SPR-Based Toxin Analysis
| Item / Reagent | Function in SPR Assay | Example Product / Note |
|---|---|---|
| SPR Instrument | Core platform for real-time, label-free detection. | Biacore series, Sierra Sensors SPR-2, OpenPlex. |
| Sensor Chips | Gold surface with a functional matrix (e.g., carboxymethyl dextran). | CM5 (Cytiva), HCA (amine coupling), Gold chips for thiol coupling. |
| Coupling Reagents | Activate carboxyl groups on chip for ligand immobilization. | EDC (1-ethyl-3-(3-dimethylaminopropyl)carbodiimide) and NHS (N-hydroxysuccinimide). |
| Capture Ligands | Biomolecule that specifically binds the toxin. | Monoclonal/Polyclonal Antibodies, DNA/RNA Aptamers, Molecularly Imprinted Polymers (MIPs). |
| Running Buffer | Maintains pH and ionic strength; reduces non-specific binding. | HBS-EP+ (10 mM HEPES, 150 mM NaCl, 3 mM EDTA, 0.05% v/v Surfactant P20, pH 7.4). |
| Regeneration Solution | Gently removes bound analyte without damaging the ligand. | Low pH (10 mM Glycine-HCl, pH 2.0-2.5), high salt, or mild detergent. |
| Toxin Standards | For calibration curves and quantitative analysis. | Certified reference materials (CRMs) from NIST or other accredited suppliers. |
| Analysis Software | For kinetic/affinity modeling and concentration analysis. | Biacore Evaluation Software, TraceDrawer, Scrubber. |
Application Notes: SPR Analysis of Environmental Toxins
Surface Plasmon Resonance (SPR) biosensing provides real-time, label-free analysis of molecular interactions, making it a cornerstone technology for environmental toxin research. Within the thesis framework on advancing SPR for environmental monitoring, this document details application notes and protocols for four critical toxin classes. The focus is on quantifying binding affinities to biological targets and developing multiplexed detection assays.
Pesticides (Organophosphates)
Target: Acetylcholinesterase (AChE). Organophosphates (e.g., parathion, chlorpyrifos) irreversibly phosphorylate the serine residue in the active site of AChE, disrupting nerve signal transmission. SPR Application: Immobilization of AChE on a carboxymethylated dextran (CMD) sensor chip enables the detection and inhibition kinetics analysis of organophosphates. Regeneration is challenging due to covalent binding.
Mycotoxins (Aflatoxin B1)
Target: DNA & Cellular Proteins. Aflatoxin B1 (AFB1) is metabolized to an epoxide that forms covalent adducts with DNA (primarily at N7-guanine) and serum albumin. SPR Application: Competitive inhibition assays are standard. Aflatoxin B1-BSA conjugate is immobilized on the chip. Sample AFB1 and a specific anti-AFB1 antibody are pre-mixed and injected; the signal is inversely proportional to toxin concentration.
Endocrine Disruptors (Bisphenol A)
Target: Estrogen Receptors (ERα/β). Bisphenol A (BPA) mimics 17β-estradiol by binding to the ligand-binding domain of ERs, triggering aberrant estrogenic signaling. SPR Application: Direct binding assays using immobilized recombinant ERα ligand-binding domain (LBD). Analyses determine relative binding affinities (RBA) compared to estradiol. Low-molecular-weight (LMW) analyte correction is critical.
Heavy Metals (Cadmium)
Target: Metallothionein & Enzymes. Cd²⁺ binds to sulfhydryl groups in cysteine-rich proteins like metallothionein, displacing essential metals like Zn²⁺, and inhibiting DNA repair enzymes. SPR Application: Indirect detection via chelators or engineered proteins. A common protocol immobilizes a chelator (e.g., EDTA derivative) on the chip. Cd²⁺ in sample is captured, then detected via a secondary, metal-specific antibody or a labeled metal-binding protein.
Table 1: Summary of SPR Assay Parameters for Key Toxin Targets
| Toxin Class | Example Analyte | Biological Target | SPR Assay Format | Typical Affinity Range (KD) | LOD (SPR-based) |
|---|---|---|---|---|---|
| Pesticide | Chlorpyrifos-oxon | Acetylcholinesterase | Enzyme Inhibition | Irreversible (k_i: 10^4-10^6 M⁻¹s⁻¹) | 0.1-10 ng/mL |
| Mycotoxin | Aflatoxin B1 | Anti-AFB1 Antibody | Competitive Inhibition | 1-10 nM (Ab affinity) | 0.01-0.1 ng/mL |
| Endocrine Disruptor | Bisphenol A | Estrogen Receptor α (LBD) | Direct Binding | 1-10 µM | 0.1-1 µg/mL |
| Heavy Metal | Cadmium (Cd²⁺) | Chelator/Engineered Protein | Sandwich/Capture | µM-nM (for capture agent) | 0.1-1 ppb (µg/L) |
Experimental Protocols
Protocol 1: Competitive SPR Immunoassay for Aflatoxin B1
Principle: Competition between free AFB1 in sample and chip-immobilized AFB1-BSA for a limited amount of monoclonal antibody.
Materials:
- SPR instrument (e.g., Biacore, OpenSPR)
- Carboxylated sensor chip (e.g., CMD chip)
- AFB1-BSA conjugate (commercial)
- Anti-Aflatoxin B1 monoclonal antibody (mAb)
- EDC/NHS coupling reagents
- Ethanolamine HCl (1.0 M, pH 8.5)
- Running Buffer: PBS-P (0.01 M phosphate, 0.137 M NaCl, 0.05% P20 surfactant, pH 7.4)
- Regeneration Solution: 10 mM Glycine-HCl, pH 2.0
Procedure:
- Surface Activation: Inject a 1:1 mixture of 0.4 M EDC and 0.1 M NHS over the target flow cell for 7 minutes.
- Ligand Immobilization: Dilute AFB1-BSA in 10 mM sodium acetate buffer (pH 4.5) to 50 µg/mL. Inject until ~5000-8000 Response Units (RU) are coupled. Use a reference flow cell activated and blocked with BSA alone.
- Surface Blocking: Inject 1.0 M ethanolamine-HCl (pH 8.5) for 7 minutes to deactivate excess esters.
- Competition Assay:
- Prepare a constant concentration of anti-AFB1 mAb (near KD, e.g., 10 µg/mL) in Running Buffer.
- Mix mAb solution 1:1 with standard/sample containing varying concentrations of free AFB1. Incubate 15 min at 25°C.
- Inject the mixture over the AFB1-BSA and reference surfaces for 3 min at 30 µL/min.
- Monitor the binding response.
- Regeneration: Inject Glycine-HCl, pH 2.0, for 30 seconds to strip the antibody. Re-equilibrate with running buffer.
- Data Analysis: Plot inhibition (%) vs. log[AFB1]. Fit a 4-parameter logistic curve to determine IC50 and calculate sample concentration.
Protocol 2: Direct Binding Assay for Endocrine Disruptor Screening
Principle: Direct measurement of BPA binding to immobilized human ERα-LBD.
Materials:
- Recombinant human ERα-LBD (His-tagged)
- NTA sensor chip (for His-tag capture)
- Running Buffer: HBS-EP+ (10 mM HEPES, 150 mM NaCl, 3 mM EDTA, 0.05% P20 surfactant, pH 7.4)
- Analytes: 17β-estradiol (positive control), BPA, other test compounds in DMSO (<1% final in buffer)
- Regeneration Solution: 350 mM EDTA
Procedure:
- Ligand Capture: Dilute ERα-LBD to 5 µg/mL in Running Buffer. Inject for 2 minutes at 10 µL/min to achieve a consistent capture level (~100-150 RU) on the NTA chip charged with Ni²⁺.
- Analyte Binding: Prepare analyte dilutions in Running Buffer from DMSO stocks. Inject each sample for 2 minutes (association) at 30 µL/min, followed by a 5-minute dissociation phase.
- Surface Regeneration: Inject 350 mM EDTA for 1 minute to remove the His-tagged protein. Re-charge the surface with Ni²⁺ before the next cycle.
- Reference Subtraction: Use a buffer injection and a blank captured surface for double referencing.
- Data Analysis: Fit the corrected sensograms to a 1:1 Langmuir binding model to obtain ka (association rate), kd (dissociation rate), and KD (kd/ka). Calculate Relative Binding Affinity (RBA) as (KD of Estradiol / KD of Analyte) * 100.
Signaling Pathways & Workflows
Title: BPA Estrogenic Signaling Pathway
Title: SPR Competitive Assay for Toxins
The Scientist's Toolkit
Table 2: Essential Research Reagent Solutions for SPR Toxin Analysis
| Item | Function in SPR Assay | Example/Notes |
|---|---|---|
| Carboxymethylated Dextran (CMD) Sensor Chip | Gold sensor surface with a hydrophilic hydrogel matrix for covalent ligand immobilization via amine coupling. | Series S Chip CM5 (Cytiva). Most common for protein/peptide immobilization. |
| NTA Sensor Chip | Surface functionalized with nitrilotriacetic acid for capturing His-tagged proteins via chelated Ni²⁺ ions. | Ideal for capturing recombinant receptors (e.g., ERα-LBD). Allows surface regeneration with EDTA. |
| EDC/NHS Crosslinkers | 1-Ethyl-3-(3-dimethylaminopropyl)carbodiimide (EDC) and N-hydroxysuccinimide (NHS) activate carboxyl groups on the chip for amine coupling. | Supplied as ready-to-mix solutions or lyophilized powders. Critical for covalent immobilization. |
| Running Buffer with Surfactant | Provides a consistent, low-refractive-index background. Surfactant (e.g., P20, Tween 20) minimizes non-specific binding. | HBS-EP+ or PBS-P, pH 7.4. Must be degassed and filtered (0.22 µm). |
| Regeneration Solutions | Reversibly breaks the binding interaction without damaging the immobilized ligand, enabling chip re-use. | Varies by assay: Low/high pH (Glycine), high salt, chaotropic agents (e.g., Guanidine HCl). |
| High-Quality Toxin-Protein Conjugates | Used as the immobilized ligand in competitive immunoassays for small molecules (haptens) like mycotoxins. | Must ensure the toxin is accessible for antibody binding. BSA or OVA conjugates are common. |
| Recombinant Target Proteins | Purified functional domains of biological targets (e.g., AChE, ER-LBD) for direct binding studies. | Requires high purity and activity. His-tags facilitate capture on NTA chips. |
| Validated Antibodies (mAbs) | Primary detection agents in sandwich or inhibition assays. Require high specificity and affinity. | Monoclonal antibodies preferred for consistency. Must be tested for SPR compatibility. |
Within the framework of a thesis focused on Surface Plasmon Resonance (SPR) for environmental toxin analysis, the sensor chip interface is the critical foundation. The selection of gold film thickness, linker chemistry, and biomolecule immobilization strategy directly dictates the sensitivity, specificity, and reproducibility of assays detecting pollutants like mycotoxins, pesticides, or algal toxins. This document provides detailed application notes and protocols for optimizing this interface.
Gold Film Specifications and Performance Data
The gold film serves as the SPR-active layer and the platform for chemistry. Recent advances highlight the importance of precise fabrication.
Table 1: Gold Film Characteristics and SPR Performance Metrics
| Parameter | Standard Film | Optimized Film (for Low MW Toxins) | Function/Rationale |
|---|---|---|---|
| Thickness | 47-50 nm | 45-47 nm | Maximizes SPR angle shift & EM field enhancement. |
| Adhesion Layer (Cr/Ti) | 1-2 nm | 0.5-1 nm (Ti) | Minimizes damping of plasmon; Ti reduces roughness. |
| RMS Roughness | < 1.0 nm | < 0.5 nm | Reduces non-specific binding and signal noise. |
| Grain Size | 20-50 nm | Controlled, >30 nm | Larger grains reduce electron scattering, enhancing sensitivity. |
| Recommended Vendor (Example) | Ssens | G. Layer | Provides chips with characterized, reproducible specs. |
Linker Chemistry and Functionalization Protocols
Linker chemistry forms the molecular bridge between the gold and the biorecognition element (e.g., antibody, aptamer).
Protocol: Formation of a Carboxylated Self-Assembled Monolayer (SAM)
Objective: To create a stable, hydrophilic, carboxyl-terminated surface for covalent immobilization.
Materials:
- SPR sensor chip with gold film.
- 11-mercaptoundecanoic acid (11-MUA) 1 mM in absolute ethanol.
- 6-mercapto-1-hexanol (MCH) 1 mM in ethanol (for backfilling).
- Absolute ethanol (high purity).
- Nitrogen gas stream.
Procedure:
- Gold Pretreatment: Clean the gold surface with a fresh piranha solution (3:1 v/v H₂SO₄:H₂O₂) CAUTION: Extremely hazardous. Rinse extensively with Milli-Q water and ethanol. Dry under N₂.
- SAM Formation: Immerse the chip in 1 mM 11-MUA solution for 18-24 hours at room temperature in a sealed, dark vial.
- Backfilling: Rinse chip with ethanol and transfer to 1 mM MCH solution for 1 hour to displace non-specific adsorption and create a well-ordered monolayer.
- Rinsing: Rinse sequentially with ethanol and Milli-Q water. Dry under N₂. Chip can be stored dry, under N₂, for short periods.
Alternative Linker Chemistries
Table 2: Common Linker Chemistries for Toxin Analysis
| Linker Type | Example Molecule | Terminal Group | Immobilization Target | Best For |
|---|---|---|---|---|
| Carboxylate | 11-MUA | -COOH | Amine groups (Lysine) | Antibodies, proteins. |
| Hydroxyl | MCH | -OH | Non-covalent adsorption | DNA/RNA aptamers (often via thiol tag). |
| Mixed SAM | 11-MUA + MCH | -COOH / -OH | Amines | Reduces steric hindrance for proteins. |
| Dextran Matrix | Carboxymethylated dextran | -COOH (3D) | Amines, Thiols | High ligand density; common in commercial chips. |
| NTA | Ni²⁺-NTA chelate | Ni²⁺ | His-tagged proteins | Recombinant receptors, His-tagged enzymes. |
Immobilization Strategies for Toxin Analysis
Direct detection of small-molecule toxins (<1000 Da) is challenging due to minimal mass change. Competitive or inhibition assays are standard.
Protocol: Competitive Inhibition Assay for Ochratoxin A (OTA)
Principle: A toxin conjugate (OTA-protein) is immobilized. Free toxin in sample and a fixed concentration of anti-OTA antibody are pre-mixed. Binding response is inversely proportional to free toxin concentration.
Immobilization Step (Direct Amine Coupling):
- Activation: Mount the carboxylated chip in the SPR instrument. Prime system with running buffer (e.g., HBS-EP, pH 7.4). Inject a 1:1 mixture of 0.4 M EDC and 0.1 M NHS for 7 minutes.
- Ligand Attachment: Dilute OTA-BSA conjugate in 10 mM sodium acetate buffer (pH 4.5) to 50 µg/mL. Inject over activated surface for 7 minutes to achieve ~5000 RU response.
- Deactivation/Blocking: Inject 1 M ethanolamine-HCl (pH 8.5) for 7 minutes to block remaining esters.
- Reference Surface: Use a parallel flow cell activated and deactivated similarly, or immobilized with non-specific BSA.
Assay Workflow:
- Regeneration Scouting: Find conditions that remove bound antibody without damaging ligand (e.g., 10 mM Glycine-HCl, pH 2.0, 30 sec injection).
- Injection Cycle: For each sample/standard: a. Incubate anti-OTA antibody (fixed, sub-saturating conc.) with sample/standard for 5 min. b. Inject the mixture over sensor surface for 3 min (association). c. Switch to running buffer for 2 min (dissociation). d. Inject regeneration solution.
- Data Analysis: Plot maximum binding response (RU) vs. log[OTA]. Fit to a 4-parameter logistic model for quantification.
Diagram: Competitive Inhibition Assay Workflow
The Scientist's Toolkit: Key Research Reagent Solutions
Table 3: Essential Materials for SPR Sensor Chip Functionalization
| Item / Reagent | Supplier Examples | Function in Experiment |
|---|---|---|
| SPR Gold Chips (bare) | Ssens, G. Layer, Platypus | Provides the plasmonic substrate with controlled thickness and roughness. |
| 11-Mercaptoundecanoic acid | Sigma-Aldrich, Thermo Fisher | Forms carboxyl-terminated SAM for covalent protein coupling. |
| EDC & NHS | Tokyo Chemical Industry, Pierce | Activates carboxyl groups to form amine-reactive esters. |
| HBS-EP Buffer (10x) | Cytiva | Standard running buffer (HEPES, NaCl, EDTA, Surfactant P20) for minimal non-specific binding. |
| Ethanolamine-HCl | Sigma-Aldrich | Blocks residual activated esters post-ligand immobilization. |
| Regeneration Scout Kit | Cytiva, Reichert | Array of buffers (low/high pH, ionic strength) to determine optimal regeneration conditions. |
| Carboxymethyl Dextran Chips (CM5) | Cytiva | Industry-standard 3D hydrogel chip for high-density immobilization. |
| NTA Sensor Chip | Cytiva | For capturing His-tagged recombinant proteins or enzymes as receptors. |
| Protein A/G Sensor Chip | Cytiva, Nicoya | For oriented capture of antibodies via Fc region. |
| Piranha Solution Components | In-house (CAUTION) | Ultra-cleaning solution for gold surface oxidation and organic removal. |
Introduction and Thesis Context Within the broader thesis on developing Surface Plasmon Resonance (SPR) as a frontline tool for environmental toxin analysis, understanding the evolution and capabilities of SPR instrumentation is paramount. The shift from traditional, single-channel angle-shift SPR to high-throughput SPR imaging (SPRi) and highly sensitive nanoscale Localized SPR (LSPR) represents a critical pathway to deploy this technology for multiplexed, on-site detection of mycotoxins, algal toxins, and persistent organic pollutants. This application note details the core principles, comparative performance metrics, and specific experimental protocols for each modality.
Instrumentation Comparison and Quantitative Data
The choice of SPR platform dictates the assay format, throughput, and sensitivity achievable for environmental analysis.
Table 1: Comparative Analysis of SPR Instrumentation Modalities
| Feature | Traditional Angle-Shift SPR | SPR Imaging (SPRi) | Localized SPR (LSPR) |
|---|---|---|---|
| Core Principle | Tracking resonance angle (θ) shift on a thin Au film. | Measuring reflectivity (Δ%R) changes at fixed angle from an array. | Tracking λmax shift of nanostructures. |
| Throughput | Low (1-4 channels typically). | Very High (100s-1000s of spots). | Medium (often multi-well nanostructured plates). |
| Label-free? | Yes. | Yes. | Yes. |
| Sensitivity (Typical) | ~1 pg/mm² (0.1-10 nM KD). | ~10 pg/mm² (1-100 nM KD). | ~10-100 pg/mm² (nM-μM KD). |
| Spatial Resolution | No imaging; bulk signal. | ~1-10 μm pixel resolution. | No conventional imaging; single nanoparticle tracking possible. |
| Primary Environmental Application | Reference-grade kinetic analysis of toxin-antibody binding. | Multiplexed screening for multiple toxin classes simultaneously. | Rugged, miniaturized sensors for small molecule toxins. |
| Key Advantage for Toxin Analysis | Gold-standard for affinity/kinetics. | Multiplexing for toxin cocktails. | Enhanced near-field for small molecules; lower cost. |
Experimental Protocols
Protocol 2.1: Traditional Angle-Shift SPR for Mycotoxin (Ochratoxin A) Antibody Characterization Objective: Determine the affinity (KD) and kinetics (ka, kd) of a monoclonal antibody against Ochratoxin A (OTA). Materials: Biacore T200/8K or equivalent, CMS sensor chip, HBS-EP+ buffer (10 mM HEPES, 150 mM NaCl, 3 mM EDTA, 0.05% v/v Surfactant P20, pH 7.4), 1-ethyl-3-(3-dimethylaminopropyl)carbodiimide (EDC), N-hydroxysuccinimide (NHS), Ethanolamine-HCl, OTA-BSA conjugate, anti-OTA mAb in serial dilutions.
- System Priming: Prime instrument and system with degassed HBS-EP+ buffer.
- Surface Functionalization (Aminocoupling):
- Activate carboxyl groups on flow cell 2 with a 7-min injection of a 1:1 mixture of 0.4 M EDC and 0.1 M NHS.
- Dilute OTA-BSA conjugate in 10 mM sodium acetate (pH 4.5) to 50 μg/mL. Inject for 7 min over activated surface (FC2). Use FC1 as a reference.
- Block unreacted esters with a 7-min injection of 1 M ethanolamine-HCl (pH 8.5).
- Kinetic Experiment:
- Set flow rate to 30 μL/min.
- Inject 5 concentrations of anti-OTA mAb (e.g., 6.25, 12.5, 25, 50, 100 nM) for 3 min (association phase).
- Monitor dissociation in buffer for 10 min.
- Regenerate surface with two 30-sec pulses of 10 mM glycine-HCl (pH 1.5).
- Data Analysis: Double-reference sensorgrams (FC2-FC1, buffer subtracted). Fit data to a 1:1 Langmuir binding model using instrument software to extract ka, kd, and KD (KD = kd/ka).
Protocol 2.2: SPRi for Multiplexed Detection of Marine Biotoxins Objective: Simultaneously detect Saxitoxin (STX), Domoic Acid (DA), and Okadaic Acid (OA) in a single sample. Materials: SPRi instrument (e.g., GWC, Horiba), array-patterned gold chip, PBS-T (0.005% Tween 20), toxin-protein conjugates (STX, DA, OA), polyclonal anti-toxin antibodies, secondary antibody with signal enhancement tag.
- Chip Arraying: Using a microarray spotter, deposit 100 μm spots of each toxin conjugate (50 μg/mL in PBS) and controls (BSA, buffer) in triplicate on the Au chip.
- Blocking: Incubate the patterned chip in 1% BSA in PBS for 1 hr to block non-specific sites.
- Assay Procedure:
- Mount chip in SPRi flow cell. Establish baseline in PBS-T.
- Inject sample (or mixture of anti-toxin antibodies) for 15 min.
- Wash with PBS-T for 5 min.
- Optional Enhancement: Inject anti-species secondary antibody for 10 min to amplify signal.
- Data Acquisition & Analysis: Monitor % Reflectivity (Δ%R) changes for each spot in real-time. Quantitative analysis is achieved by comparing the Δ%R for each toxin spot to a standard curve generated from known antibody concentrations.
Protocol 2.3: LSPR-based Competitive Assay for Microcystin-LR Objective: Detect the small molecule hepatotoxin Microcystin-LR (MC-LR) using a competitive assay format on nanostructured Au substrates. Materials: LSPR spectrometer/plate reader, commercial Au nanotriangle or nanorod substrate in a microplate, MC-LR-BSA conjugate, anti-MC-LR antibody, sample/standard solutions of free MC-LR.
- Surface Preparation: Incubate LSPR wells with MC-LR-BSA conjugate (10 μg/mL in PBS) overnight at 4°C. Wash and block with 1% casein.
- Competition Step: Pre-mix a fixed, sub-saturating concentration of anti-MC-LR antibody with a series of concentrations of free MC-LR standard (or environmental sample) for 15 min.
- Binding: Apply the antibody/toxin mixture to the MC-LR-BSA functionalized LSPR well. Incubate for 20 min.
- Wash and Measure: Wash thoroughly with PBS. Measure the extinction spectrum of each well (400-900 nm). Determine the peak wavelength (λmax).
- Analysis: The free toxin in solution inhibits antibody binding. The λmax shift is inversely proportional to free toxin concentration. Generate a calibration curve of Δλmax vs. log[MC-LR].
Visualizations
Diagram Title: SPR Technology Evolution for Toxin Analysis
Diagram Title: Traditional SPR Kinetic Assay Protocol Flow
The Scientist's Toolkit: Research Reagent Solutions
Table 2: Essential Materials for SPR-based Environmental Toxin Analysis
| Item | Function in SPR Assays | Example/Note |
|---|---|---|
| Carboxymethylated Dextran (CMD) Sensor Chip (e.g., CMS) | Gold standard surface for amine coupling of proteinaceous toxins or conjugates. Provides a hydrophilic matrix to reduce non-specific binding. | Foundation for traditional kinetic assays (Protocol 2.1). |
| Carboxyl- or NHS-Activated Array Chips | Patternable gold surface for immobilizing multiple ligands in discrete spots for multiplexed SPRi. | Required for SPRi toxin arrays (Protocol 2.2). |
| Nanostructured Au LSPR Substrates | Pre-fabricated plates or chips with Au nanoparticles supporting LSPR. The core transduction element for LSPR assays. | Commercial products from nanoComposix or similar (Protocol 2.3). |
| Toxin-Protein Conjugates | Key immunoreagents. The protein (BSA, OVA) enables surface immobilization; the toxin moiety serves as the capture ligand. | Critical for all competitive or direct capture assays. |
| High-Affinity Anti-Toxin Antibodies | Primary detection biorecognition element. Monoclonal preferred for kinetics; polyclonal often used for multiplex screening. | Source from specialized suppliers (e.g., Beacon, Abcam). |
| Regeneration Solution (e.g., Glycine-HCl, pH 1.5-2.5) | Removes bound analyte from the immobilized ligand without damaging it, allowing chip re-use. | Must be optimized for each specific ligand-analyte pair. |
| Running Buffer with Surfactant (e.g., HBS-EP+, PBS-T) | Maintains consistent refractive index and minimizes non-specific binding via surfactants (P20, Tween-20). | Essential for stable baselines and reduced noise. |
| Signal Enhancement Reagents (for SPRi) | Secondary antibodies or nanoparticles used to amplify the signal from small molecule binding events. | Increases sensitivity in multiplex toxin screening. |
SPR Assay Development: Step-by-Step Protocols for Toxin Analysis
This application note, framed within a thesis on Surface Plasmon Resonance (SPR) for environmental toxin analysis, compares covalent coupling and capture methods for immobilizing antibodies and aptamers on SPR sensor chips. The selection of immobilization chemistry is critical for assay sensitivity, specificity, and regenerability when detecting low-molecular-weight toxins like mycotoxins, cyanotoxins, and pesticides. We present quantitative comparisons, detailed protocols, and strategic recommendations for researchers developing SPR biosensors for environmental monitoring and diagnostic applications.
In SPR-based analysis of environmental toxins, the ligand (antibody or aptamer) must be stably immobilized while retaining its bio-recognition function. Covalent coupling offers a permanent attachment, while capture methods provide oriented, homogeneous, and often more active layering. The choice impacts limit of detection (LOD), chip lifetime, and assay cost—key factors for field-deployable environmental sensors.
Quantitative Comparison of Immobilization Methods
Table 1: Performance Metrics for Antibody Immobilization Methods
| Parameter | Covalent Coupling (e.g., amine) | Capture (e.g., Protein A/G) | Capture (Anti-Fc antibody) |
|---|---|---|---|
| Immobilization Level (RU) | 8,000 - 15,000 | 5,000 - 9,000 | 4,000 - 8,000 |
| Functional Activity (%) | 30-60% | 70-90% | 70-85% |
| Assay Stability (cycles) | 50-100+ | 20-50 (depends on regeneration) | 30-60 |
| Orientation Control | Low (random) | High | High |
| Typical Regeneration | Not applicable | Mild acid (pH 2.0-2.5) | Mild acid/Glycine pH 1.5-2.0 |
| Best For | High-density surfaces, rugged use | Screening, kinetic studies | Specific subclass antibodies |
Table 2: Performance Metrics for Aptamer Immobilization Methods
| Parameter | Covalent Coupling (thiol) | Covalent Coupling (amine) | Capture (streptavidin-biotin) |
|---|---|---|---|
| Immobilization Level (RU) | 200 - 800 (low MW) | 300 - 1000 (low MW) | 500 - 1500 (includes SA layer) |
| Functional Activity (%) | 40-70% (depends on folding) | 20-50% (random orientation) | 60-85% (oriented) |
| Assay Stability (cycles) | 80-150 | 50-100 | 100-200+ |
| Orientation Control | Medium (via terminus) | Low | High |
| Typical Regeneration | 50 mM NaOH, mild denaturant | 50 mM NaOH | 4-6 M GuHCl, 10 mM Gly-HCl pH 2.0 |
| Best For | Structured aptamers, folded | High-density screening | Reusable, robust assays |
Detailed Experimental Protocols
Protocol 3.1: Covalent Amine Coupling of Antibodies for Toxin Detection
Objective: To immobilize a monoclonal antibody against microcystin-LR on a CM5 sensor chip via amine groups.
Materials:
- SPR instrument (e.g., Biacore T200, OpenSPR)
- CM5 sensor chip (carboxymethylated dextran)
- Running Buffer: HBS-EP+ (10 mM HEPES, 150 mM NaCl, 3 mM EDTA, 0.05% v/v Surfactant P20, pH 7.4)
- Antibody: 20-50 µg/mL in 10 mM sodium acetate, pH 4.5 (optimize pH scouting)
- Activation Solutions: 400 mM EDC and 100 mM NHS (freshly mixed 1:1)
- Deactivation Solution: 1 M ethanolamine-HCl, pH 8.5
- Regeneration Solution: 10 mM Glycine-HCl, pH 2.0
Procedure:
- Chip Priming: Dock the CM5 chip and prime the system with HBS-EP+ buffer at 25°C.
- Baseline Stabilization: Flow running buffer over all cells at 10 µL/min until a stable baseline is achieved.
- Surface Activation: Inject the EDC/NHS mixture for 7 minutes (70 µL at 10 µL/min).
- Ligand Immobilization: Immediately inject the antibody solution for 7 minutes (70 µL at 10 µL/min). Monitor the increase in Response Units (RU).
- Blocking Unreacted Groups: Inject 1 M ethanolamine-HCl, pH 8.5, for 7 minutes.
- Surface Wash: Wash with two 1-minute pulses of regeneration solution to remove loosely bound antibody, followed by re-equilibration with running buffer.
- Target Binding: The chip is now ready for analyte (toxin or toxin-protein conjugate) binding experiments.
Protocol 3.2: Capture of Antibodies Using a Protein A Surface
Objective: To capture a polyclonal antibody for ochratoxin A analysis on a pre-immobilized Protein A surface.
Materials:
- Protein A sensor chip or CM5 chip with covalently immobilized Protein A.
- Capture Antibody: 5-10 µg/mL in HBS-EP+ buffer.
- Regeneration Solution: 10 mM Glycine, pH 2.0.
Procedure:
- Establish Capture Baseline: Flow HBS-EP+ over the Protein A surface.
- Antibody Capture: Inject the antibody solution for 2-3 minutes (30 µL at 10 µL/min) to achieve a capture level of ~100-200 RU.
- Analyte Injection: Inject the sample containing ochratoxin A (or toxin conjugate). The lower molecular weight requires high sensitivity settings.
- Surface Regeneration: Inject Glycine pH 2.0 for 30-60 seconds to dissociate both the toxin-antibody complex and the captured antibody, renewing the Protein A surface for the next cycle.
Protocol 3.3: Streptavidin-Biotin Capture of Aptamers for Saxitoxin Detection
Objective: To immobilize a biotinylated DNA aptamer against saxitoxin on a streptavidin (SA) sensor chip.
Materials:
- SA sensor chip (or CMS chip with immobilized streptavidin).
- Biotinylated Aptamer: 100-200 nM in HBS-EP+ buffer, heat-annealed and cooled slowly in binding buffer.
- Regeneration Solution: 8 M Urea + 1 M NaCl (or 10 mM HCl for harsh regeneration).
Procedure:
- Chip Conditioning: Perform three 1-minute injections of 1 M NaCl in 50 mM NaOH to clean and condition the SA surface.
- Aptamer Immobilization: Inject the annealed biotinylated aptamer solution for 5-7 minutes (50-70 µL at 10 µL/min) to achieve the desired density. Low density (~100 RU) is often optimal for small molecule detection.
- Surface Blocking: Inject a 1-minute pulse of 50 µM free biotin to block any unoccupied streptavidin sites.
- Analyte Binding: Inject saxitoxin samples. Due to small size, signal amplification strategies (e.g., sandwich assay, inhibition format) may be needed.
- Regeneration: Inject the urea/NaCl solution for 30-60 seconds to denature and remove bound analyte, restoring the aptamer surface.
Diagrams
Covalent Amine Coupling Workflow
Antibody Capture & Regeneration Cycle
Immobilization Strategy Decision Tree
The Scientist's Toolkit: Research Reagent Solutions
Table 3: Essential Materials for SPR Ligand Immobilization
| Item | Function & Relevance |
|---|---|
| CM5 Sensor Chip | Gold standard carboxymethylated dextran chip for covalent coupling via amine, thiol, or carboxyl chemistry. |
| Series S SA Sensor Chip | Pre-immobilized streptavidin on a dextran matrix for high-affinity capture of biotinylated ligands (aptamers, antibodies). |
| Protein A Sensor Chip | Pre-immobilized Protein A for efficient, Fc-mediated capture of most IgG antibodies, ensuring proper orientation. |
| EDC & NHS (Amine Kit) | Crosslinkers for activating carboxyl groups to form reactive NHS esters for covalent amine coupling. |
| 1 M Ethanolamine, pH 8.5 | Used to deactivate and block excess reactive ester groups after ligand coupling, reducing non-specific binding. |
| HBS-EP+ Buffer | Standard running buffer with added surfactant to minimize non-specific adsorption and stabilize baseline. |
| pH Scouting Kits | Set of buffers (pH 3.5-5.5) to determine the optimal pH for preconcentration and covalent immobilization of proteins. |
| 10 mM Glycine-HCl, pH 2.0 | Mild regeneration solution for dissociating captured antibodies from Protein A/G or antigen-antibody complexes. |
| Biotinylated Aptamer | Synthetic oligonucleotide with a terminal biotin tag for directed, stable immobilization on a streptavidin surface. |
Application Notes
Within the context of developing Surface Plasmon Resonance (SPR) biosensors for environmental toxin analysis, the selection of assay format is critical to overcome matrix complexity and achieve regulatory-level sensitivity. This document details three primary assay formats, with a focus on their application for low-molecular-weight toxins (e.g., mycotoxins, microcystins) and proteinaceous toxins (e.g., botulinum neurotoxin).
Direct Detection Assay: Ideal for large analytes (>10 kDa) or high-affinity interactions. The target toxin binds directly to an immobilized capture molecule (e.g., antibody, receptor). While simple, it is less suitable for small toxins due to minimal mass change and is highly susceptible to non-specific binding in complex environmental samples (e.g., soil extracts, algal blooms).
Inhibition (Competitive) Assay: The preferred format for small molecule toxins (<1 kDa). A known concentration of a toxin-protein conjugate is immobilized on the sensor chip. The sample containing the free toxin is mixed with a limited amount of antibody. Free toxin competitively inhibits antibody binding to the surface. The signal is inversely proportional to toxin concentration. This format excels in specificity for small analytes in complex matrices.
Sandwich Assay: Employed for larger toxins with multiple epitopes. A primary capture antibody is immobilized. The toxin from the sample binds, and a second, distinct detector antibody is flowed over to form a complex, amplifying the signal. This format offers superior specificity and sensitivity but requires two non-competing epitopes.
Table 1: Comparative Analysis of SPR Assay Formats for Toxin Detection
| Parameter | Direct Detection | Inhibition (Competitive) | Sandwich |
|---|---|---|---|
| Ideal Analyte Size | >10 kDa | <1-5 kDa | >15 kDa |
| Sensitivity | Moderate | High (for small molecules) | Very High |
| Specificity in Matrix | Low | High | Very High |
| Assay Complexity | Low | Moderate | High |
| Key Application | Protein toxins, viruses | Mycotoxins, pesticides, antibiotics | Bacterial protein toxins (e.g., SEB, Botulinum) |
| Typical LOD (Example) | ~1-10 ng/mL | ~0.1-1 ng/mL | ~0.01-0.1 ng/mL |
Protocols
Protocol 1: Inhibition (Competitive) Assay for Ochratoxin A (OTA) Analysis Objective: Quantify OTA in buffer and spiked cereal extracts. Materials: See "Research Reagent Solutions" below. Procedure:
- Chip Preparation: Immobilize OTA-BSA conjugate on a CM5 sensor chip via amine coupling to achieve ~5000 RU.
- Regeneration Scouting: Determine optimal surface regeneration conditions (e.g., 10 mM Glycine-HCl, pH 2.0 for 30 sec).
- Analyte Preparation: Mix a constant, limiting concentration of anti-OTA monoclonal antibody (e.g., 10 µg/mL) with sample/standard (buffer or diluted extract) for 5 minutes pre-incubation.
- SPR Running Conditions:
- HBS-EP+ running buffer (10 mM HEPES, 150 mM NaCl, 3 mM EDTA, 0.05% v/v Surfactant P20, pH 7.4).
- Flow rate: 30 µL/min.
- Sample injection: 120 sec association, 180 sec dissociation.
- Regeneration: Apply regeneration solution for 30 sec after each cycle.
- Data Analysis: Plot maximum binding response (RU) during association versus OTA standard concentration. Fit data to a four-parameter logistic (4PL) competitive inhibition curve to generate a calibration plot.
Protocol 2: Sandwich Assay for Staphylococcal Enterotoxin B (SEB) Objective: Detect and quantify SEB in buffer. Procedure:
- Chip Preparation: Immobilize capture anti-SEB antibody (Clone 1) on a Protein A chip or via amine coupling to achieve ~10,000 RU.
- Regeneration: Use 10 mM Glycine, pH 1.7 for 30 sec.
- Assay Cycle: a. Capture: Inject sample/SEB standard for 180 sec. b. Wash: Flow running buffer for 120 sec. c. Detection: Inject detector anti-SEB antibody (Clone 2, 25 µg/mL) for 180 sec. d. Dissociation: Monitor for 180 sec. e. Regenerate: As in step 2.
- Data Analysis: The response is the RU value from the baseline after capture to the plateau after detection. Plot response versus SEB concentration for quantification.
Visualization
Title: Competitive Inhibition Assay Workflow
Title: Sandwich Assay Signal Amplification
The Scientist's Toolkit: Research Reagent Solutions
Table 2: Essential Materials for SPR-Based Toxin Assay Development
| Item | Function & Specification |
|---|---|
| Carboxymethylated Dextran (CM) Sensor Chip (e.g., CM5) | Gold surface with a hydrophilic hydrogel matrix for high-capacity ligand immobilization via amine coupling. |
| HBS-EP+ Buffer | Standard running buffer for most applications. Provides consistent pH and ionic strength, contains surfactant to minimize non-specific binding. |
| Amine Coupling Kit | Contains N-hydroxysuccinimide (NHS) and N-ethyl-N'-(3-dimethylaminopropyl)carbodiimide (EDC) for activating carboxyl groups on the chip surface. |
| Protein A or G Sensor Chip | For oriented, non-denaturing capture of antibody Fc regions, preserving antigen-binding capacity. |
| Regeneration Solutions | Low pH (Glycine-HCl, pH 1.5-2.5), high pH (e.g., 50 mM NaOH), or other specific buffers to fully dissociate bound analyte without damaging the immobilized ligand. |
| Toxin-Protein Conjugate (e.g., OTA-BSA) | Critical reagent for competitive assays. The toxin (hapten) must be conjugated to a carrier protein (BSA, OVA) for surface immobilization. |
| Monoclonal Antibody Pair | For sandwich assays, two antibodies recognizing distinct, non-overlapping epitopes on the target toxin are required. |
| P20 Surfactant | A non-ionic detergent (polysorbate 20) added to running buffers (typically 0.05%) to reduce surface tension and non-specific adsorption. |
Effective sample preparation is critical for the accurate detection of environmental toxins (e.g., mycotoxins, algal toxins, pesticides) using Surface Plasmon Resonance (SPR) biosensors. SPR’s sensitivity and label-free nature can be compromised by complex sample matrices, necessitating robust extraction and clean-up protocols to minimize matrix effects and ensure reliable quantification in support of a thesis on advancing SPR for environmental monitoring.
Environmental Matrices and Associated Challenges
Environmental samples present diverse matrices that interfere with SPR analysis by causing non-specific binding, sensor fouling, or altering association/dissociation kinetics.
Table 1: Common Environmental Matrices and Primary Interferences in SPR Analysis
| Matrix Type | Example Samples | Primary Interferents | Impact on SPR Signal |
|---|---|---|---|
| Water | River, Lake, Seawater | Humic/Fulvic Acids, Dissolved Organic Matter, Salts, Particulates | Non-specific binding, baseline drift, ionic strength effects. |
| Soil/Sediment | Agricultural soil, Riverbed sediment | Humic Substances, Heavy Metals, Organic Polymers, Colloids | Severe fouling, signal suppression, clogging of flow systems. |
| Biological | Algae, Fish Tissue | Proteins, Lipids, Carbohydrates, Pigments (e.g., chlorophyll) | High non-specific binding, viscosity changes, competition for binding sites. |
| Air Particulates | PM2.5 Filters | Polycyclic Aromatic Hydrocarbons, Complex inorganic/organic mixtures | Co-extraction of interferents, sensor surface contamination. |
Core Extraction and Clean-up Protocols
Protocol 3.1: Solid-Phase Extraction (SPE) for Aqueous Samples
Objective: To concentrate target toxins and remove humic acids and salts from water samples prior to SPR analysis.
Materials:
- Water sample (e.g., 100 mL surface water)
- C18 or HLB SPE cartridges (500 mg, 6 mL)
- Vacuum manifold
- Solvents: HPLC-grade Methanol, Acetonitrile, Water (acidified with 0.1% Formic Acid)
- Elution tubes
Method:
- Conditioning: Pass 5 mL of methanol through the cartridge, followed by 5 mL of acidified water. Do not let the sorbent dry.
- Loading: Acidify the water sample to pH ~3. Load the sample onto the cartridge at a steady flow rate of 5-10 mL/min.
- Washing: Wash the cartridge with 5-10 mL of acidified water (or a mild aqueous/organic mix, e.g., 5% methanol) to remove salts and polar interferences.
- Drying: Dry the cartridge under full vacuum for 10-15 minutes to remove residual water.
- Elution: Elute the target analytes with 2-4 mL of an appropriate organic solvent (e.g., 80:20 Acetonitrile:Methanol) into a clean collection tube.
- Reconstitution: Evaporate the eluent to dryness under a gentle stream of nitrogen. Reconstitute the dried extract in a suitable SPR running buffer (e.g., HBS-EP) to a final volume of 200 µL.
- Filtration: Pass the reconstituted sample through a 0.22 µm low-protein-binding PVDF syringe filter.
Protocol 3.2: QuEChERS-based Extraction for Solid Matrices
Objective: To extract a broad range of semi-polar/polar toxins from soil or biological tissues.
Materials:
- Homogenized sample (e.g., 5 g soil or 2 g tissue)
- QuEChERS Extraction Kit (containing MgSO4, NaCl, buffering salts)
- QuEChERS Dispersive SPE (d-SPE) Clean-up Kit (containing MgSO4, PSA, C18, etc.)
- Centrifuge and 50 mL centrifuge tubes
- Solvents: Acetonitrile (1% acetic acid), Water
Method:
- Extraction: Place the sample in a 50 mL tube. Add 10 mL of acetonitrile (1% acetic acid). Vortex vigorously for 1 minute.
- Salting-out: Add the contents of the extraction salt packet (e.g., 4 g MgSO4, 1 g NaCl, 1 g sodium citrate, 0.5 g disodium hydrogen citrate). Shake immediately and vigorously for 1 minute to prevent clumping.
- Centrifugation: Centrifuge at >4000 rpm for 5 minutes to achieve phase separation.
- Clean-up: Transfer 1 mL of the upper acetonitrile layer to a d-SPE tube containing clean-up sorbents (e.g., 150 mg MgSO4, 50 mg PSA, 50 mg C18). Vortex for 30 seconds.
- Second Centrifugation: Centrifuge the d-SPE tube at high speed for 2 minutes.
- Preparation for SPR: Transfer the cleaned supernatant to a vial. A 1:4 dilution in SPR running buffer is typically required to reduce organic solvent content (<5% v/v) prior to SPR injection to prevent buffer mismatch and non-specific binding.
Strategies to Minimize Matrix Effects in SPR Analysis
Matrix effects (signal suppression/enhancement) are quantified by comparing the calibration curve in pure buffer to one prepared in a matrix extract.
Table 2: Quantification of Matrix Effects and Mitigation Strategies
| Strategy | Protocol / Reagent | Typical Reduction in Matrix Effect* | Key Application |
|---|---|---|---|
| Sample Dilution | Diluting the sample extract with running buffer. | 30-70% | Initial, simple step to reduce interferent concentration. May compromise sensitivity. |
| SPE Clean-up | Using selective sorbents (e.g., HLB, GCB for pigments). | 60-90% | Essential for complex matrices like soil or tissue. |
| d-SPE Clean-up (QuEChERS) | Using PSA (for organic acids, sugars) and C18 (for lipids). | 50-85% | High-throughput clean-up for solid and semi-solid samples. |
| Sensor Surface Regeneration | Injection of a regeneration solution (e.g., 10 mM Glycine-HCl, pH 2.0). | N/A | Restores baseline and binding capacity between sample cycles. |
| Surface Blocking | Pre-treatment with an inert protein (e.g., 0.1% BSA, Casein) or surfactant (e.g., 0.05% Tween 20). | 40-80% | Reduces non-specific binding by occupying sites on the sensor chip. |
| Reference Subtraction | Using a reference flow cell with an irrelevant or inactivated ligand. | 70-95% | Most critical SPR-specific tactic. Subtracts bulk refractive index shifts and non-specific binding signal. |
*Estimated reduction in signal suppression/enhancement compared to untreated extract.
The Scientist's Toolkit: Research Reagent Solutions
Table 3: Essential Materials for SPR Sample Preparation
| Item | Function in SPR Sample Prep |
|---|---|
| HLB (Hydrophilic-Lipophilic Balance) SPE Cartridges | Reversed-phase polymer sorbent for broad-spectrum extraction of polar and non-polar toxins from water with high recoveries. |
| PSA (Primary Secondary Amine) d-SPE Sorbent | Removes fatty acids, organic acids, and sugars during QuEChERS clean-up, common in food and environmental extracts. |
| C18 d-SPE Sorbent | Co-removes lipids and non-polar interferents during dispersive clean-up. |
| Graphitized Carbon Black (GCB) Sorbent | Selectively removes planar molecules and pigments (e.g., chlorophyll) that cause severe matrix effects. |
| HBS-EP Buffer (10 mM HEPES, 150 mM NaCl, 3 mM EDTA, 0.05% v/v Surfactant P20) | Standard SPR running buffer; EDTA chelates metals, surfactant minimizes non-specific binding. |
| Carboxymethylated Dextran Sensor Chip (e.g., CM5) | Common, versatile chip for ligand immobilization via amine coupling; susceptible to matrix fouling without clean-up. |
| Series S Sensor Chip SA (Streptavidin) | Used for capturing biotinylated antibodies or DNA probes; allows for a renewable surface in some formats. |
| Regeneration Solution (e.g., 10-50 mM Glycine-HCl, pH 1.5-3.0) | Dissociates tightly bound analyte and matrix components from the immobilized ligand, restoring chip activity. |
Experimental Workflow & Data Interpretation
SPR Sample Prep Workflow
Deconstructing & Mitigating Matrix Effects
Application Notes
Within the broader thesis focusing on Surface Plasmon Resonance (SPR) for environmental toxin analysis, real-time kinetic analysis is paramount. This technique enables the direct, label-free measurement of molecular interactions between environmental toxins (e.g., mycotoxins, algal toxins, pesticides) and their biological targets (e.g., antibodies, receptors, DNA). Determining the affinity (KD), association rate (ka), dissociation rate (kd), and active concentration provides critical insights into toxin mechanism, potency, and risk assessment, forming the basis for developing sensitive detection biosensors.
The following Application Notes detail the implementation of SPR for characterizing the interaction between a model environmental toxin, Microcystin-LR (MC-LR), and a high-affinity monoclonal antibody (mAb). MC-LR, a hepatotoxin produced by cyanobacteria, serves as a relevant model due to its significant public health concern.
Table 1: Representative Kinetic Analysis of Anti-MC-LR mAb Binding to Immobilized MC-LR-BSA Conjugate
| Analyte (Conc. Range) | Ligand | ka (1/Ms) | kd (1/s) | KD (M) | Rmax (RU) | Chi² (RU²) |
|---|---|---|---|---|---|---|
| Anti-MC-LR mAb (0.5-64 nM) | MC-LR-BSA | 3.2 x 10⁵ | 8.7 x 10⁻⁵ | 2.7 x 10⁻¹⁰ | 125 | 0.18 |
| Negative Control mAb (64 nM) | MC-LR-BSA | - | - | No binding | < 2 | - |
Table 2: Concentration Analysis of MC-LR in Spiked Water Samples
| Sample Matrix | MC-LR Spiked (nM) | Calculated (nM) | % Recovery | Assay Format |
|---|---|---|---|---|
| Purified Water | 1.0 | 0.98 | 98% | Competitive Inhibition |
| Lake Water | 1.0 | 0.92 | 92% | Competitive Inhibition |
| Lake Water | 10.0 | 9.7 | 97% | Competitive Inhibition |
Experimental Protocols
Protocol 1: Direct Kinetic Analysis of Antibody-Toxin Interaction
Objective: To determine the kinetic rate constants (ka, kd) and affinity (KD) of a monoclonal antibody binding to an immobilized toxin conjugate.
Materials: See "The Scientist's Toolkit" below. Instrument: Biacore T200 or equivalent SPR system. Software: Biacore Evaluation Software.
Procedure:
Surface Preparation:
- Dock a CMS sensor chip.
- Prime the system with running buffer (HBS-EP+, pH 7.4).
- Activate two flow cells (Fc1, Fc2) for 7 minutes with a 1:1 mixture of 0.4 M EDC and 0.1 M NHS at a flow rate of 10 µL/min.
- Immobilization: Dilute MC-LR-BSA conjugate to 20 µg/mL in 10 mM sodium acetate buffer (pH 4.5). Inject over Fc2 for 7 minutes (≈3500 RU achieved). For Fc1 (reference surface), inject BSA alone using the same conditions.
- Deactivation: Inject 1 M ethanolamine-HCl (pH 8.5) for 7 minutes to block unreacted esters.
- Condition the surface with three 30-second injections of 10 mM glycine-HCl (pH 2.0), followed by re-equilibration with running buffer.
Kinetic Experiment:
- Prepare a 2-fold serial dilution of the anti-MC-LR antibody in running buffer (e.g., 64, 32, 16, 8, 4, 2, 1, 0.5 nM). Include a 0 nM sample (buffer only).
- Set the instrument temperature to 25°C.
- Program a multi-cycle kinetics method:
- Contact time: 180 seconds (association phase).
- Dissociation time: 600 seconds (dissociation phase).
- Flow rate: 30 µL/min.
- Inject samples in random order to minimize systematic bias. Each injection is followed by a regeneration step: a 30-second pulse of 10 mM glycine-HCl (pH 2.0).
Data Analysis:
- Double-reference the sensorgrams: subtract both the reference flow cell (Fc1) response and the buffer injection (0 nM) response.
- Fit the processed data globally to a 1:1 Langmuir binding model using the evaluation software.
- Report the calculated ka, kd, KD, and fit quality parameter (Chi²).
Protocol 2: Competitive Inhibition Assay for Toxin Concentration
Objective: To quantify the concentration of free MC-LR toxin in an environmental sample by competitive inhibition.
Materials: As above, plus known concentrations of pure MC-LR toxin for standard curve generation.
Procedure:
Surface Preparation: Immobilize the anti-MC-LR mAb (≈10,000 RU) on a CMS chip following the amine coupling steps in Protocol 1, using Fc2. Fc1 is prepared with an isotype control antibody.
Inhibition Experiment:
- Prepare a series of MC-LR standard solutions in buffer (e.g., 0, 0.1, 0.5, 1, 5, 10, 50 nM).
- Prepare unknown environmental water samples. Filter (0.22 µm) and dilute as necessary in running buffer.
- Pre-mix a fixed, sub-saturating concentration of MC-LR-BSA conjugate (the "analyte," e.g., 20 nM) with an equal volume of each standard or sample. Incubate for 15 minutes at 25°C to allow competition for antibody binding sites.
- Inject each pre-mixture over the antibody surface for 120 seconds at a flow rate of 30 µL/min. Monitor the binding response.
- Regenerate the surface with a 60-second pulse of 10 mM glycine-HCl (pH 1.5).
Data Analysis:
- Reference-subtract the sensorgrams (Fc2 - Fc1).
- Plot the maximum binding response (RU) versus the concentration of free MC-LR standard on a logarithmic scale.
- Fit the standard curve data to a four-parameter logistic (4PL) equation.
- Interpolate the response from the unknown samples on the standard curve to determine the concentration of MC-LR in the original sample.
Mandatory Visualization
Title: SPR Kinetic Analysis Workflow
Title: Competitive Inhibition Assay Principle
The Scientist's Toolkit
Table 3: Essential Research Reagents & Materials for SPR-Based Toxin Analysis
| Item | Function/Benefit in Analysis |
|---|---|
| CMS Series S Sensor Chip | Gold surface with a carboxymethylated dextran matrix for covalent ligand immobilization via amine coupling. The standard for most kinetic studies. |
| EDC & NHS (Amine Coupling Kit) | Cross-linking reagents used to activate carboxyl groups on the dextran matrix for covalent attachment of protein ligands (e.g., toxin-protein conjugates or antibodies). |
| HBS-EP+ Buffer | Standard running buffer (HEPES pH 7.4, NaCl, EDTA, Surfactant P20). Provides a stable, low-nonspecific binding environment for interactions. |
| Anti-Microcystin-LR mAb | High-affinity, specific capture agent. The quality of this reagent is critical for reliable kinetic and concentration analysis. |
| MC-LR-BSA Conjugate | The toxin (hapten) covalently linked to a carrier protein (BSA). Enables stable immobilization on the sensor chip for direct kinetic assays with antibodies. |
| Regeneration Solutions (e.g., Glycine-HCl pH 1.5-2.5) | Mild acidic solutions that disrupt the antibody-antigen interaction without damaging the immobilized ligand, allowing surface re-use for hundreds of cycles. |
| PBS-P+ Buffer | Phosphate-buffered saline with surfactant, often used for sample dilution and as running buffer in concentration assays to match physiological conditions. |
Within the broader thesis on Surface Plasmon Resonance (SPR) for environmental toxin analysis, this note presents detailed application protocols. SPR's real-time, label-free detection capability makes it ideal for monitoring low molecular weight toxins across complex matrices, advancing research into exposure assessment and remediation strategies.
Application Note & Protocol: Aflatoxin B1 (AFB1) in Food
Objective: Quantify AFB1 in maize and peanut samples using an inhibition immunoassay format on an SPR biosensor.
Experimental Protocol:
- Sensor Chip Functionalization: A CM5 sensor chip is activated with a 1:1 mixture of 0.4 M EDC and 0.1 M NHS for 7 minutes. AFB1-BSA conjugate (50 µg/mL in 10 mM sodium acetate, pH 4.5) is injected for 10 minutes to achieve ~8000 RU immobilization. Remaining active esters are deactivated with 1 M ethanolamine-HCl (pH 8.5).
- Inhibition Assay: Monoclonal anti-AFB1 antibody (2 µg/mL) is pre-incubated with standard or sample extract for 10 minutes. This mixture is injected over the AFB1-BSA surface for 3 minutes at 30 µL/min.
- Regeneration: The surface is regenerated with 10 mM glycine-HCl (pH 2.0) for 30 seconds.
- Data Analysis: The sensorgram response (RU) for the antibody is inversely proportional to AFB1 concentration in the sample. A calibration curve is generated from standards (0, 0.1, 0.25, 0.5, 1.0, 2.5 ng/mL).
Table 1: Performance Data for AFB1 SPR Inhibition Assay
| Parameter | Value |
|---|---|
| Linear Range | 0.05 - 2.0 ng/mL |
| Limit of Detection (LOD) | 0.02 ng/mL |
| Limit of Quantification (LOQ) | 0.05 ng/mL |
| Mean Recovery (Spiked Maize) | 92.5% - 106.3% |
| Intra-assay CV | < 6% |
| Inter-assay CV | < 9% |
Application Note & Protocol: Atrazine in Water
Objective: Direct detection of atrazine in groundwater using a competitive SPR assay with a high-affinity molecularly imprinted polymer (MIP) surface.
Experimental Protocol:
- MIP Sensor Preparation: A gold sensor chip is coated with a nanostructured polypyrrole film via electrochemical polymerization in the presence of 5 mM atrazine (template). The template is removed by repeated washing with acetic acid/methanol (1:9 v/v) to create specific cavities.
- Sample Analysis: Water samples are filtered (0.22 µm) and injected directly over the MIP and a non-imprinted control surface for 5 minutes at 20 µL/min.
- Binding Measurement: The specific binding response (RU difference between MIP and control) is measured during dissociation in running buffer.
- Regeneration: Bound atrazine is stripped using a 2-minute pulse of the acetic acid/methanol solution.
Table 2: Performance Data for Atrazine MIP-SPR Assay
| Parameter | Value |
|---|---|
| Linear Range | 0.01 - 100 nM |
| LOD | 0.003 nM (≈ 0.65 ng/L) |
| Selectivity Coefficient (vs. Simazine) | 12.5 |
| Analysis Time per Sample | < 12 min |
| Recovery (Groundwater Matrix) | 94 - 102% |
Application Note & Protocol: Bisphenol A (BPA) in Consumer Products
Objective: Detect BPA leaching from polycarbonate plastics using an SPR immunosensor.
Experimental Protocol:
- Chip Preparation: A carboxymethyl dextran chip is immobilized with a BPA-OVA conjugate using amine coupling (as in Protocol 1).
- Leachate Simulation: Plastic samples are incubated with a 50% ethanol/water solution at 60°C for 24 hours. Extracts are diluted in HBS-EP buffer (pH 7.4).
- Competitive Detection: A fixed concentration of anti-BPA antibody (5 µg/mL) is mixed with the sample/standard and injected for 4 minutes. Binding inhibition is monitored.
- Surface Regeneration: Achieved with two 1-minute pulses of 10 mM NaOH.
Table 3: Performance Data for BPA SPR Immunoassay
| Parameter | Value |
|---|---|
| Dynamic Range | 0.05 - 25 ng/mL |
| LOD | 0.02 ng/mL |
| IC50 | 1.8 ng/mL |
| Cross-Reactivity (BPS) | 8.7% |
| Recovery (Plastic Leachate) | 88% - 104% |
The Scientist's Toolkit: Key Research Reagent Solutions
Table 4: Essential Materials for SPR-Based Toxin Analysis
| Item | Function |
|---|---|
| CM5 Sensor Chip (Carboxymethyl dextran) | Gold surface with a hydrophilic hydrogel for covalent ligand immobilization via amine coupling. |
| EDC & NHS Crosslinkers | Activate carboxyl groups on the sensor surface for covalent attachment of proteins/ligands. |
| HBS-EP Running Buffer | Standard SPR running buffer (HEPES, NaCl, EDTA, Surfactant P20) to maintain pH and reduce non-specific binding. |
| Glycine-HCl (pH 2.0-3.0) | Common regeneration solution for breaking antibody-antigen interactions without damaging the immobilized ligand. |
| Protein A or Protein G | Used for capturing antibodies on the sensor surface in an oriented manner for direct assay formats. |
| Molecularly Imprinted Polymer (MIP) Kits | Pre-formulated monomers/template mixtures for creating synthetic, stable recognition surfaces for small molecules. |
| Toxin-Protein Conjugates (e.g., AFB1-BSA) | Critical for immobilization on the chip to create the recognition surface for competitive/inhibition assays. |
| Monoclonal Anti-Toxin Antibodies | High-specificity recognition elements; the keystone reagent for immunoassay development. |
SPR Assay Workflow for Toxin Detection
Competitive Inhibition SPR Assay Principle
MIP-SPR Direct Detection Pathway
Optimizing SPR Assays: Troubleshooting Nonspecific Binding and Sensitivity Issues
Application Notes: Context in Environmental Toxin Analysis via SPR
Surface Plasmon Resonance (SPR) biosensors are pivotal in detecting low-molecular-weight environmental toxins (e.g., mycotoxins, pesticides, algal toxins) due to their label-free, real-time kinetics capability. However, the analysis of complex environmental matrices (soil extracts, water, food homogenates) exacerbates three core pitfalls: Nonspecific Binding (NSB), Bulk Refractive Index (BRI) effects, and Carryover. These artifacts can obscure specific analyte-receptor interactions, leading to false positives, inaccurate affinity constants, and poor detection limits. This document details protocols and solutions framed within a thesis focused on developing robust SPR assays for environmental surveillance.
Table 1: Impact of Common Pitfalls on SPR Assay Parameters for Toxin Detection
| Pitfall | Typical Signal Contribution (RU) | Effect on Apparent KD | Common in Matrix | Mitigation Strategy Impact |
|---|---|---|---|---|
| Nonspecific Binding | 10 - 200 RU (matrix dependent) | Can over/under-estimate by >10-fold | River water, soil extracts | >90% reduction with optimized surface blocking |
| Bulk Refractive Index Shift | 50 - 500+ RU (high salt/solvent) | Masks binding; invalidates kinetics | Buffer mismatches, crude samples | >95% correction with double referencing |
| Carryover | 1-5% of prior sample signal | Alters baseline; cumulative error | All, especially high-conc. toxins | <1% residual with stringent wash protocols |
Table 2: Recommended Reagent Solutions for Mitigation
| Reagent/Component | Function in Toxin SPR Assays | Example Product/Chemical |
|---|---|---|
| CM5 Sensor Chip | Standard carboxylated dextran matrix for ligand immobilization. | Cytiva Series S CM5 |
| HBS-EP+ Running Buffer | Standard buffer (10mM HEPES, 150mM NaCl, 3mM EDTA, 0.05% P20 surfactant) minimizes NSB. | Cytiva BR100669 |
| Surfactant P20 (Polysorbate 20) | Non-ionic detergent added to buffer (0.005-0.05%) to reduce NSB. | Thermo Fisher 28320 |
| Bovine Serum Albumin (BSA) | Common blocking agent (0.1-1 mg/mL) to passivate unreacted sites. | Sigma-Aldrich A7906 |
| Carboxymethyl-dextran | Soluble form used as a blocking agent for chip surfaces. | Sigma-Aldrich 86524 |
| Ethanolamine-HCl | Standard reagent for deactivation after amine coupling. | Cytiva BR100050 |
| Regeneration Scouting Kit | Pre-formatted solutions (low/high pH, ionic strength) for identifying optimal regeneration. | Cytiva BR100838 |
| Instrument-Specific Wash Solution | For flow system sanitization to prevent carryover (e.g., DESORB, Glycine-HCl). | As per instrument vendor |
Experimental Protocols
Protocol 2.1: Comprehensive Surface Preparation & Blocking to Minimize NSB
Objective: Immobilize a toxin-specific capture molecule (e.g., antibody, molecularly imprinted polymer) while minimizing future NSB from complex samples.
- Chip Activation: Dock a CM5 sensor chip. Inject a 1:1 mixture of 0.4 M EDC and 0.1 M NHS for 7 minutes at 10 μL/min.
- Ligand Immobilization: Dilute the capture ligand in 10 mM sodium acetate buffer (pH optimized per ligand’s pI). Inject until desired immobilization level is reached (~5000-10000 RU for antibodies). Use a reference flow cell activated and deactivated without ligand.
- Surface Deactivation: Inject 1 M ethanolamine-HCl (pH 8.5) for 7 minutes.
- Aggressive Blocking: Inject a solution of 1 mg/mL BSA and 0.1 mg/mL soluble carboxymethyl-dextran in running buffer for 10 minutes. This step is critical for environmental samples.
- Conditioning: Perform 3-5 regeneration cycles (e.g., 10 mM Glycine-HCl, pH 2.0) to stabilize the surface before analyte binding experiments.
Protocol 2.2: Double-Referencing to Correct for BRI & NSB
Objective: Isolate the specific binding signal by subtracting both systematic noise and flow cell-specific NSB.
- Sample Preparation: Prepare toxin standards and environmental samples in the running buffer. Prepare an identical "blank" matrix (e.g., toxin-free extract) for each sample.
- Experimental Setup: Use a sensor chip with at least one active flow cell (with ligand) and one reference flow cell (blocked only). The analyte cycle must include:
- Primary Reference Subtraction: The reference flow cell signal is subtracted from the active flow cell signal in real-time. This removes most of the BRI shift.
- Solvent Correction/Double Reference: Run the "blank" matrix sample over both flow cells. Save this sensorgram. Then, run the actual sample. In data analysis, subtract the "blank" sensorgram from the sample sensorgram. This removes signals common to both, isolating specific binding.
Protocol 2.3: Rigorous Wash Protocol to Eliminate Carryover
Objective: Ensure the sample flow path is free of residual analyte between injections, crucial for trace toxin analysis.
- Post-Sample Wash: After each analyte injection, immediately inject running buffer for 60 seconds at a high flow rate (e.g., 50 μL/min).
- Periodic Regeneration & Sanitization: Following the binding cycle, inject the predetermined regeneration solution (e.g., 20% ethanol for small toxins) for 30-60 seconds.
- Systematic Wash Cycle: After every 5-6 sample cycles, run an extended wash protocol:
- Flush with 50% aqueous dimethyl sulfoxide (DMSO) for 2 minutes at 30 μL/min.
- Flush with instrument-specific sanitization solution (e.g., 50 mM NaOH, 0.5% SDS) for 2 minutes.
- Re-equilibrate with running buffer for 5 minutes before next sample.
Visualization: Diagrams & Workflows
Title: SPR Workflow for Toxin Analysis Showing Key Pitfalls
Title: Linking SPR Pitfalls to Their Causes and Solutions
This work is a component of a broader thesis focused on advancing Surface Plasmon Resonance (SPR) biosensing for the detection and quantification of environmental toxins (e.g., mycotoxins, pesticides, algal toxins). The economic viability and high-throughput applicability of SPR in environmental monitoring are critically dependent on the regeneration and reuse of sensor chips. This application note details the development and validation of robust surface regeneration protocols for sensor chips functionalized with common capture ligands, enabling their reuse over multiple analysis cycles without significant loss of performance.
Core Principles of Surface Regeneration
Effective regeneration must completely dissociate the high-affinity analyte-capture ligand complex without irreversibly damaging or denaturing the immobilized capture molecule. The key challenge is identifying a chemical or physical condition that disrupts the specific molecular interactions (hydrogen bonds, hydrophobic effects, electrostatic forces) while maintaining the bioactivity of the sensor surface. The optimal reagent is highly specific to the interaction pair.
Quantitative Comparison of Regeneration Solutions for Common Assay Formats
Table 1: Performance of Regeneration Solutions Across Different Sensor Chip Assays
| Capture Ligand | Target Toxin (Example) | Tested Regeneration Solutions | Optimal Solution | Max Cycles to <10% Signal Loss | Reference Association Signal Stability (% of Initial) |
|---|---|---|---|---|---|
| Monoclonal Antibody | Aflatoxin B1 | 10 mM Glycine-HCl (pH 2.5), 10 mM NaOH, 0.5% SDS | 10 mM Glycine-HCl, pH 2.5 | 75 | 98.2 ± 1.5 |
| Polyclonal Antibody | Ochratoxin A | 50 mM Phosphoric Acid, 4 M MgCl₂, 0.1% Tween-20 + pH 2.0 buffer | 50 mM Phosphoric Acid | 60 | 96.8 ± 2.1 |
| DNA Aptamer | Patulin | 1-10 mM NaOH, 4-8 M Urea, 20 mM EDTA | 5 mM NaOH | 100+ | 99.5 ± 0.8 |
| Streptavidin Surface | Biotinylated Toxin Conjugate | 6 M Guanidine HCl, 1% SDS, 50% Ethylene Glycol | 1% SDS (60s pulse) | 50 | 95.0 ± 3.0 |
| Protein A/G Surface | Antibody (for sandwich assay) | 10 mM Glycine pH 2.0-3.0, 0.85% H₃PO₄ | 0.85% H₃PO₄ (30s) | 40 | 92.5 ± 2.5 |
Detailed Experimental Protocols
Protocol 4.1: Standardized Regeneration Scouting Procedure
Objective: To systematically identify the optimal regeneration condition for a new antibody-toxin interaction pair.
Materials: SPR instrument, sensor chip with immobilized capture antibody, toxin analyte solution, running buffer (e.g., HBS-EP+: 10 mM HEPES, 150 mM NaCl, 3 mM EDTA, 0.05% P20 surfactant, pH 7.4).
Reagents for Scouting:
- Low pH: 10-100 mM Glycine-HCl (pH 1.5-3.0), 10-100 mM Citric acid (pH 2.0-4.0)
- High pH: 1-50 mM NaOH, 10-100 mM Glycine-NaOH (pH 8.5-10.0)
- Chaotropic: 1-6 M MgCl₂, 1-6 M Guanidine HCl
- Ionic/Surfactant: 0.1-1% SDS, 0.1-1% Tween-20
- Chelating: 10-100 mM EDTA
Methodology:
- Establish a Stable Baseline: Prime the SPR system with running buffer for at least 30 minutes at the standard flow rate (e.g., 30 µL/min).
- Initial Binding Cycle: Inject the toxin analyte at a known concentration (sufficient to generate a robust signal, e.g., ~100 RU) for 2-3 minutes. Allow dissociation in buffer for 2-3 minutes.
- First Regeneration Test: Inject the mildest candidate solution (e.g., pH 3.0 glycine) for 30-60 seconds. Monitor the sensorgram for a rapid return to baseline.
- Evaluate: Perform a second identical injection of the same toxin analyte. Compare the maximum binding response (RU) to the initial cycle.
- Iterate: If response recovery is >95%, the condition may be suitable. If response is significantly lower (<90%), the condition may be too harsh. If baseline does not fully return, the condition is too weak. Test progressively harsher conditions in new, identical channels or on fresh chip spots.
- Validate: Once a candidate is identified, perform 10-20 consecutive bind-regenerate cycles to assess medium-term stability.
Protocol 4.2: Validation of Long-Term Chip Reusability
Objective: To determine the operational lifespan of a sensor chip under optimized regeneration conditions.
Methodology:
- Using the optimal condition from Protocol 4.1, perform 50-100 sequential analysis cycles on the same sensor spot. Each cycle consists of:
- Baseline stabilization (60s)
- Analyte injection (180s)
- Dissociation in buffer (180s)
- Regeneration injection (as determined, e.g., 30s)
- Stabilization (60s)
- Every 10th cycle, inject a standardized, mid-range concentration of toxin analyte and a buffer blank (for referencing).
- Plot the response of the standardized analyte injection versus cycle number. The chip is considered to have failed when the normalized response falls below 90% of the initial response.
- Periodically check the surface uniformity by performing a calibration curve.
The Scientist's Toolkit: Essential Research Reagent Solutions
Table 2: Key Reagents for SPR Surface Regeneration Development
| Reagent / Solution | Function in Regeneration | Typical Use Case |
|---|---|---|
| Glycine-HCl Buffer (pH 1.5-3.0) | Low pH disrupts hydrogen bonding and protonates carboxylates/amines, weakening antigen-antibody bonds. | First-line scouting for monoclonal antibody surfaces. |
| Sodium Hydroxide (1-10 mM) | High pH denatures proteins and disrupts hydrogen bonds. Effective for DNA-based aptamers. | Regeneration of aptamer surfaces; harsh cleaning of protein-fouled surfaces. |
| Sodium Dodecyl Sulfate (SDS) (0.1-1%) | Ionic surfactant solubilizes proteins and disrupts hydrophobic interactions. | Dissociating very strong hydrophobic interactions; cleaning heavily fouled surfaces. |
| Magnesium Chloride (MgCl₂) (1-4 M) | High ionic strength disrupts electrostatic interactions. | Useful for dissociating complexes based primarily on ionic pairing. |
| Phosphoric Acid (0.5-1%) | Provides a combination of low pH and chaotropic effect. | Effective for tightly bound antibody-antigen pairs, especially on Protein A/G chips. |
| Ethylenediaminetetraacetic Acid (EDTA) (10-100 mM) | Chelates divalent cations (Mg²⁺, Ca²⁺), destabilizing cation-dependent complexes. | Regeneration of interactions dependent on metal ions. |
Visualized Workflows and Pathways
Title: SPR Chip Regeneration Decision Workflow
Title: Logical Flow from Thesis Goal to Protocol Development
Within the broader thesis on Surface Plasmon Resonance (SPR) for environmental toxin analysis, a primary challenge is the direct detection of low molecular weight toxins (e.g., mycotoxins, pesticides, algal toxins) at environmentally and biologically relevant concentrations. Traditional SPR assays often lack the requisite sensitivity for these small molecules. This document details the application of gold nanoparticles (AuNPs) and graphene oxide (GO) as signal amplification agents to enhance SPR sensitivity, enabling robust, label-free detection of trace environmental contaminants.
Application Notes: Comparative Nanomaterial Properties
Table 1: Comparative Properties of Amplification Nanomaterials
| Property | Gold Nanoparticles (AuNPs, 20-40 nm) | Graphene Oxide (GO, Sheets <500 nm) |
|---|---|---|
| Primary Amplification Mechanism | Mass enhancement & coupling of localized SPR (LSPR) | High surface area for analyte preconcentration & dielectric constant change |
| Typical Functionalization | Thiolated antibodies, oligonucleotides, or streptavidin | π-π stacking, electrostatic binding, or covalent amine coupling |
| Signal Enhancement Factor | 10-100x (vs. direct binding) | 5-50x (vs. direct binding) |
| Key Advantage | Strong optical signal, well-established bioconjugation | Superior loading capacity for small molecules, versatile surface chemistry |
| Key Limitation | Potential for non-specific binding | Batch-to-batch variability in oxide group distribution |
| Optimal SPR Platform | Traditional wavelength/angle modulation SPR, SPRi | SPR, Graphene-enhanced SPR (GI-SPR) substrates |
Detailed Experimental Protocols
Protocol 3.1: AuNP-Antibody Conjugate for Sandwich Assay Amplification
Objective: To prepare and apply antibody-conjugated AuNPs for the amplified detection of a target toxin (e.g., Aflatoxin B1) in a sandwich assay format.
Materials: See "The Scientist's Toolkit" (Section 5).
Method:
- AuNP Conjugation:
- Adjust pH of 10 nM citrate-capped AuNPs (20 nm) to 8.5-9.0 using 0.1 M K₂CO₃.
- Add thiolated detection antibody (or streptavidin for biotin-based assays) to a final concentration of 2-5 µg/mL.
- Incubate for 1 hour at room temperature with gentle mixing.
- Add bovine serum albumin (BSA) to 0.1% (w/v) and incubate for 30 minutes to block free surfaces.
- Centrifuge at 10,000 x g for 15 minutes (4°C) to remove unbound antibody. Resuspend pellet in 0.01 M PBS with 0.1% BSA (pH 7.4).
- Characterize conjugation by UV-Vis spectroscopy (redshift of ~5 nm in plasmon peak).
SPR Chip Preparation (Sensor Chip CM5):
- Dock chip and prime system with running buffer (PBS-P, pH 7.4).
- Activate carboxyl groups with a 7-minute injection of a 1:1 mixture of 0.4 M EDC and 0.1 M NHS.
- Inject capture antibody (10-50 µg/mL in 10 mM sodium acetate, pH 4.5) for 7 minutes to achieve ~5000-10000 RU of immobilization.
- Deactivate remaining esters with a 7-minute injection of 1 M ethanolamine-HCl, pH 8.5.
- Establish a stable baseline with running buffer.
Amplified Detection Assay:
- Inject sample/standard (containing target toxin) for 3 minutes at 30 µL/min. Record primary binding response (R1).
- Inject AuNP-Ab conjugate (diluted 1:5 in running buffer) for 3 minutes at 10 µL/min.
- Record the amplified response (R2). The net amplification signal is ΔR = R2 - R1.
- Regenerate the surface with a 30-second pulse of 10 mM glycine-HCl, pH 2.0.
Protocol 3.2: GO-Based Analyte Preconcentration for Direct Detection
Objective: To utilize GO as a carrier to preconcentrate small toxin molecules for enhanced direct SPR detection.
Materials: See "The Scientist's Toolkit" (Section 5).
Method:
- GO-Probe Preparation:
- Disperse GO sheets (0.1 mg/mL) in deionized water by sonication for 30 minutes.
- Mix the GO dispersion with a probe molecule (e.g., a DNA aptamer specific for Ochratoxin A) at a 1:5 mass ratio (GO:Aptamer).
- Incubate at 25°C for 2 hours, allowing π-π stacking interaction.
- Purify by centrifugation at 12,000 x g for 20 minutes. Resuspend in assay buffer.
Analyte Preconcentration:
- Incubate the GO-Aptamer conjugate with the sample (or standard) for 20 minutes. Target analytes bind to the aptamer on the high-surface-area GO.
SPR Detection (on a Carboxymethyl Dextran Chip):
- Immobilize a complementary capture molecule (if using a sandwich format) or use a bare gold chip for direct adsorption of GO.
- Inject the GO-Aptamer-Analyte mixture over the SPR chip for 5 minutes at 5 µL/min.
- The large mass and dielectric change induced by the GO complex yields a significantly higher response (RGO) compared to injecting free analyte alone (Rdirect).
- Calculate the enhancement factor: EF = RGO / Rdirect.
Visualization Diagrams
Title: AuNP Sandwich Assay Amplification Workflow
Title: GO-Based Analyte Preconcentration Mechanism
The Scientist's Toolkit
Table 2: Essential Research Reagent Solutions
| Item | Function in Protocol | Key Consideration |
|---|---|---|
| Citrate-capped AuNPs (20-40 nm) | Core signal-amplifying particle. | Size uniformity is critical for consistent LSPR. |
| Thiolated Detection Antibody | Provides specificity for AuNP conjugation. | Must be thiolated or biotinylated for coupling. |
| Carboxymethyl Dextran SPR Chip (e.g., CM5) | Standard substrate for antibody immobilization. | Provides a hydrophilic, low non-specific binding matrix. |
| EDC/NHS Crosslinkers | Activates carboxyl groups on chip for covalent coupling. | Freshly prepare the mixture before use. |
| Graphene Oxide Dispersion | High-surface-area carrier for preconcentration. | Sonication time determines sheet size and dispersion quality. |
| DNA or RNA Aptamer | High-affinity probe for small molecule toxins. | Requires careful folding/conditioning before use with GO. |
| PBS-P Running Buffer (with surfactant) | Maintains chip hydration and minimizes non-specific binding. | 0.005% Polysorbate 20 (Tween 20) is typical. |
| Glycine-HCl (pH 2.0-2.5) | Regeneration solution to remove bound complexes. | Must be optimized for each antibody-antigen pair. |
Within the broader thesis on developing Surface Plasmon Resonance (SPR) biosensors for environmental toxin analysis (e.g., mycotoxins, pesticides, algal toxins), buffer optimization is a critical foundational step. The performance of an SPR assay—dictated by signal magnitude, binding kinetics accuracy, and baseline stability—is profoundly influenced by the composition of the running buffer. This application note details the systematic optimization of ionic strength, pH, and surfactant additives to enhance assay sensitivity and robustness for detecting low-molecular-weight toxins in complex environmental samples.
Key Buffer Parameters: Mechanisms of Action
Ionic Strength: Modulates electrostatic interactions between the immobilized ligand (e.g., an antibody or protein receptor) and the analyte (toxin). High ionic strength can shield non-specific electrostatic attractions, reducing background, but may also weaken specific binding if it relies on ionic forces.
pH: Affects the ionization state of amino acid residues on both the ligand and analyte, influencing binding affinity (Ka). Operating at the optimal pH is crucial for maintaining ligand activity and ensuring reproducible analyte capture.
Surfactants: Non-ionic surfactants (e.g., Tween 20) are added to minimize non-specific adsorption of matrix components to the sensor chip and fluidic system, a common challenge with environmental samples. However, they can potentially denature proteins at high concentrations.
Table 1: Effect of Buffer Parameters on SPR Assay for Aflatoxin B1 Analysis
| Parameter Tested | Test Range | Optimal Value | Impact on Response (RU) | Impact on Baseline Noise (RU) |
|---|---|---|---|---|
| Ionic Strength (NaCl) | 0 - 300 mM | 150 mM | Maximal Specific Signal | Minimal at 150 mM |
| pH | 6.0 - 8.0 | 7.4 | Highest Affinity (Lowest KD) | Stable across range |
| Tween 20 | 0 - 0.05% v/v | 0.01% v/v | Negligible on specific signal | >70% reduction in non-specific adsorption |
Table 2: Optimized Buffer Formulation for Environmental Toxin SPR Assays
| Component | Concentration | Function in Assay |
|---|---|---|
| HEPES | 10 mM | Buffering capacity at physiological pH |
| NaCl | 150 mM | Optimizes ionic strength, reduces non-specific binding |
| EDTA | 3 mM | Chelates divalent cations, prevents microbial growth |
| Tween 20 | 0.01% v/v | Surfactant to block non-specific adsorption |
| pH | 7.4 | Optimized for antibody-antigen binding kinetics |
Detailed Experimental Protocols
Protocol 1: Systematic pH Optimization for Ligand Immobilization
Objective: Determine the optimal pH for immobilizing a capture antibody (anti-microcystin) on a CM5 sensor chip. Materials: SPR instrument, CM5 sensor chip, 10 mM acetate buffers (pH 4.0, 4.5, 5.0, 5.5), anti-microcystin antibody (50 µg/mL in respective buffer), EDC/NHS cross-linking kits, 1 M ethanolamine-HCl (pH 8.5). Procedure:
- Dock a new CM5 chip and prime the system with running buffer (HBS-EP, pH 7.4).
- Activate individual flow cells for 7 minutes with a 1:1 mixture of 0.4 M EDC and 0.1 M NHS.
- Inject the antibody solution in different pH acetate buffers over separate flow cells for 7 minutes.
- Deactivate excess reactive esters by injecting 1 M ethanolamine-HCl (pH 8.5) for 7 minutes.
- Record the immobilization level (Response Units, RU) for each pH condition. The pH yielding the highest stable RU without causing aggregation is optimal.
Protocol 2: Ionic Strength & Surfactant Screening for Assay Background Reduction
Objective: Identify the NaCl and Tween 20 concentration that minimizes non-specific binding from a spiked environmental water sample. Materials: SPR with immobilized toxin sensor, running buffers with NaCl (0, 50, 150, 300 mM) and Tween 20 (0, 0.005%, 0.01%, 0.05%), filtered river water sample spiked with 10 ppb microcystin-LR. Procedure:
- Prepare a 2x2 matrix of buffers varying in [NaCl] and [Tween 20], all in 10 mM HEPES, pH 7.4.
- Set the SPR instrument to cycle through the four buffers.
- For each buffer condition, inject the spiked river water sample for 3 minutes at 30 µL/min, followed by a dissociation phase.
- Measure the non-specific binding response in a reference flow cell (no ligand) and the specific binding in the active flow cell.
- The condition yielding the highest signal-to-noise ratio (Specific RU / Reference Cell RU) is optimal.
Visualization of Workflows
Title: pH Screening for SPR Ligand Immobilization
Title: Buffer Matrix Screening for SNR Optimization
The Scientist's Toolkit: Research Reagent Solutions
Table 3: Essential Reagents for SPR Buffer Optimization Studies
| Item | Function & Role in Optimization |
|---|---|
| CM5 Sensor Chip | Gold sensor surface with carboxymethylated dextran matrix for covalent ligand immobilization. |
| HEPES Buffer (1M, pH 7.4) | Provides consistent buffering capacity; inert and does not interfere with most biological interactions. |
| Tween 20 (10% Solution) | Non-ionic surfactant stock solution; critical for blocking non-specific adsorption in sample matrices. |
| EDC/NHS Cross-linking Kit | Activates carboxyl groups on the sensor chip for stable amine-coupled immobilization of ligands. |
| Ethanolamine-HCl (1M, pH 8.5) | Blocks remaining activated ester groups after immobilization, quenching the reaction. |
| PBS (10X Concentrate) | Phosphate-buffered saline; a common basis for running buffers, provides ionic strength and pH control. |
| Regeneration Solutions | (e.g., Glycine-HCl, pH 2.0-3.0) Essential for removing bound analyte to re-use the sensor surface between cycles. |
Within a thesis on Surface Plasmon Resonance (SPR) for environmental toxin analysis, rigorous data analysis is paramount. The detection of low-molecular-weight toxins (e.g., mycotoxins, algal toxins) at trace levels in complex matrices demands analytical refinement. This document details advanced data processing protocols—Reference Subtraction and Double Referencing—and essential quality controls (QCs) to enhance specificity, accuracy, and reliability in SPR biosensor research.
Critical Data Analysis Protocols
Reference Subtraction
Reference subtraction is the primary step to remove nonspecific binding and bulk refractive index effects.
- Purpose: Isolate the specific binding signal by subtracting the response from a reference surface or channel.
- Application: Essential for analyzing environmental samples (e.g., soil extracts, water) which cause significant matrix effects.
Protocol:
- Surface Preparation: Immobilize the ligand (e.g., toxin-specific antibody) on the active sensor chip flow cell (Fc2). Prepare a reference surface in a separate flow cell (Fc1) with a non-reactive protein (e.g., BSA) or a deactivated surface.
- Sample Injection: Inject the analyte (toxin standard or sample) simultaneously over both the active and reference surfaces at a constant flow rate (typically 10-30 µL/min).
- Data Acquisition: Record sensorgrams (Response Units vs. Time) for both channels.
- Subtraction: Subtract the reference channel sensorgram (Fc1) from the active channel sensorgram (Fc2) in the SPR software (e.g., Biacore Evaluation Software).
Result = Response(Fc2) - Response(Fc1).
Double Referencing
Double referencing further refines data by subtracting systematic noise from a buffer blank injection.
- Purpose: Remove instrument drift, injection artifacts, and any minor differences between flow cells.
Protocol:
- Perform Reference Subtraction as described above.
- Buffer Injection: Inject running buffer (without analyte) over both surfaces using identical injection parameters (volume, flow rate).
- Secondary Subtraction: Subtract the buffer injection sensorgram (already reference-subtracted) from the analyte injection sensorgram (reference-subtracted).
Final Response = [Response(Fc2_analyte) - Response(Fc1_analyte)] - [Response(Fc2_buffer) - Response(Fc1_buffer)].
Quality Controls for Environmental Analysis
Implement QCs to validate each assay run and ensure data integrity.
- System Suitability Test (SST): Run a mid-level toxin standard at the start and end of a sample series. The binding response must be within ±10% of the expected value.
- Blank Matrix Control: Process and analyze a toxin-free sample of the representative matrix (e.g., purified water, extract from clean soil). The response should be below the limit of detection (LOD).
- Positive Control: A known concentration of toxin standard in buffer to confirm ligand activity.
- Regeneration Efficiency: Monitor the baseline stability after regeneration cycles. A drift of >5 RU over 5 cycles indicates surface degradation.
Data Presentation: Key QC Parameters Table
Table 1: Standard Quality Control Parameters for SPR Analysis of Environmental Toxins.
| QC Parameter | Target Value | Acceptance Criterion | Purpose |
|---|---|---|---|
| Baseline Noise | < 0.5 RU (RMS) | ≤ 1.0 RU | Measures instrument stability. |
| Buffer Injection Response | 0 RU | ± 2 RU | Checks for carryover or buffer artifacts. |
| Reference Channel Signal | Minimal change | ≤ 3 RU for toxin standard | Monitors non-specific binding. |
| Positive Control Response | As per calibration | Within ±10% of mean | Verifies assay sensitivity. |
| Regeneration Recovery | 100% | >95% | Ensures surface reusability. |
| Calibrant RSD | Low variability | < 5% (intra-run) < 10% (inter-run) | Assesses precision of standard curve. |
Experimental Protocol: SPR Binding Assay for Aflatoxin B1
Title: Direct Competitive SPR Immunoassay for Aflatoxin B1 in Buffer. Objective: Quantify Aflatoxin B1 using a monoclonal antibody immobilized on a CMS sensor chip.
Materials:
- Instrument: SPR biosensor (e.g., Biacore X100, Sierra SPR S250)
- Sensor Chip: Carboxymethylated dextran (CM5)
- Ligand: Anti-Aflatoxin B1 monoclonal antibody (mAb)
- Analytes: Aflatoxin B1 standards (0.1, 0.25, 0.5, 1.0, 2.5 nM) in HBS-EP+ buffer.
- Regent Solutions: See "The Scientist's Toolkit" below.
Detailed Methodology:
- System Priming: Prime the instrument with filtered (0.22 µm) and degassed HBS-EP+ running buffer.
- Surface Activation: Inject a 1:1 mixture of 0.4 M EDC and 0.1 M NHS for 420 seconds (70 µL) at 10 µL/min.
- Ligand Immobilization: Dilute anti-Aflatoxin B1 mAb to 20 µg/mL in 10 mM sodium acetate (pH 5.0). Inject over Fc2 until ~10,000 RU increase. Inject Fc1 with buffer for reference.
- Surface Deactivation: Inject 1 M ethanolamine-HCl (pH 8.5) for 420 seconds to block remaining active esters.
- Binding Assay:
- Set instrument temperature to 25°C.
- Inject Aflatoxin B1 standards or samples for 180 seconds (association) at 30 µL/min.
- Monitor dissociation in buffer for 300 seconds.
- Regenerate the surface with a 30-second injection of 10 mM Glycine-HCl (pH 2.0).
- Perform a buffer blank injection between standards.
- Data Processing: Apply reference subtraction (Fc2 - Fc1) followed by double referencing (subtract buffer blank). Fit processed data to a competitive binding model for quantification.
Mandatory Visualizations
SPR Data Analysis Refinement Workflow
Reference Surface Subtraction Principle
The Scientist's Toolkit
Table 2: Essential Research Reagent Solutions for SPR-based Environmental Toxin Analysis.
| Item | Function in SPR Assay | Typical Example |
|---|---|---|
| CM Series Sensor Chip | Provides a carboxymethylated dextran matrix for covalent ligand immobilization. | Cytiva Series S Sensor Chip CM5 |
| Running Buffer | Maintains constant pH and ionic strength; minimizes non-specific binding. | HBS-EP+ (10 mM HEPES, 150 mM NaCl, 3 mM EDTA, 0.05% v/v Surfactant P20, pH 7.4) |
| Activation Reagents | Activates carboxyl groups on the dextran matrix for ligand coupling. | EDC (1-ethyl-3-(3-dimethylaminopropyl)carbodiimide) and NHS (N-hydroxysuccinimide) |
| Quenching Reagent | Blocks remaining activated esters after ligand immobilization. | 1 M Ethanolamine-HCl, pH 8.5 |
| Regeneration Solution | Dissociates bound analyte to regenerate the ligand surface for reuse. | 10-100 mM Glycine-HCl (pH 1.5-3.0), 10-50 mM NaOH |
| Anti-Toxin Antibody | The capture ligand providing specificity for the target environmental toxin. | Monoclonal antibody against Aflatoxin B1, Ochratoxin A, etc. |
| Matrix-Matching Buffer | Used to prepare standards to mimic sample matrix and minimize refractive index shifts. | Buffer containing diluted, toxin-free sample extract. |
SPR Validation and Benchmarking: How It Stacks Up Against ELISA, HPLC-MS, and Other Methods
This application note provides a detailed comparison between Surface Plasmon Resonance (SPR) and Enzyme-Linked Immunosorbent Assay (ELISA) within the context of a broader thesis focused on advancing SPR for environmental toxin analysis. For researchers in drug development and environmental science, the choice between these two cornerstone label-free and labeled biosensing techniques hinges on key parameters: sensitivity, throughput, requirement for labeling, and ability to provide real-time kinetic data. Understanding these differences is critical for developing robust detection methods for low-molecular-weight toxins like mycotoxins, cyanotoxins, and pesticides.
Comparative Analysis: Core Parameters
The following table summarizes the fundamental operational differences between SPR and ELISA technologies.
Table 1: Core Comparison of SPR and ELISA
| Parameter | SPR (e.g., Biacore, OpenSPR) | ELISA (e.g., Sandwich, Competitive) |
|---|---|---|
| Detection Principle | Label-free; measures refractive index change near a sensor surface. | Label-dependent; measures enzymatic colorimetric/chemiluminescent signal. |
| Sensitivity (Typical) | High (pM-nM range). Can be enhanced with nanoparticles. | Very High (fM-pM range for ultrasensitive variants). |
| Throughput | Moderate. Modern systems offer high-throughput screening (HTS) with autosamplers (96-384 samples/run). | High. Well-established for 96- and 384-well plate formats, easily automated. |
| Labeling Requirement | Not required for analyte. Ligand is typically immobilized. | Required. Detection involves enzyme-conjugated antibodies. |
| Real-Time Data | Yes. Provides real-time binding curves (sensograms) for kinetics (ka, kd, KD). | No. Provides only endpoint measurements. |
| Sample Consumption | Low (tens of microliters). | Moderate (hundreds of microliters per well). |
| Information Gained | Affinity (KD), kinetics (ka, kd), specificity, concentration. | Concentration, specificity (with cross-reactivity checks). |
| Cost per Analysis | High instrument cost; moderate consumable cost. | Low instrument cost; moderate to high reagent/kit cost. |
Detailed Experimental Protocols
Protocol 1: Direct Binding Assay for Toxin-Analyte Kinetics Using SPR
This protocol outlines the determination of the binding affinity between an immobilized antibody and a small-molecule environmental toxin (e.g., ochratoxin A) using direct binding kinetics on an SPR instrument.
Key Research Reagent Solutions:
- Sensor Chip: CM5 (carboxymethylated dextran) or Series S Sensor Chip C.
- Running Buffer: HBS-EP+ (10 mM HEPES, 150 mM NaCl, 3 mM EDTA, 0.05% v/v Surfactant P20, pH 7.4). Filter and degas.
- Immobilization Reagents: 1-ethyl-3-(3-dimethylaminopropyl)carbodiimide (EDC), N-hydroxysuccinimide (NHS), for amine coupling. Ethanolamine-HCl for deactivation.
- Ligand: Anti-toxin monoclonal antibody (mAb), purified.
- Analyte: Purified environmental toxin (e.g., ochratoxin A) in a concentration series (e.g., 0.78 nM to 100 nM) prepared in running buffer.
- Regeneration Solution: 10 mM Glycine-HCl, pH 2.0 (or optimized condition).
Procedure:
- System Startup: Prime the SPR instrument with filtered and degassed running buffer.
- Ligand Immobilization:
- Dock the sensor chip. Activate the dextran matrix with a 7-minute injection of a 1:1 mixture of EDC and NHS.
- Dilute the anti-toxin antibody to 10-50 µg/mL in 10 mM sodium acetate buffer (pH 4.5-5.5, optimized). Inject over the activated surface for 5-7 minutes to achieve desired immobilization level (~5000-10000 Response Units).
- Inject ethanolamine-HCl for 7 minutes to block remaining active esters.
- Use one flow cell as a reference surface (activated and deactivated only).
- Kinetic Binding Experiment:
- Set instrument method to perform multi-cycle kinetics.
- Inject analyte solutions in increasing concentrations over ligand and reference surfaces for 2-3 minutes (association phase).
- Switch to running buffer flow for 5-10 minutes (dissociation phase).
- Inject regeneration solution for 30-60 seconds to fully regenerate the antibody surface between cycles.
- Data Analysis:
- Subtract reference flow cell data from ligand flow cell data.
- Fit the resulting sensograms to a 1:1 binding model using the instrument's software (e.g., Biacore Evaluation Software) to calculate association (ka) and dissociation (kd) rate constants, and the equilibrium dissociation constant (KD = kd/ka).
Protocol 2: Competitive Inhibition ELISA for Toxin Quantification
This protocol describes a competitive ELISA suitable for detecting small-molecule toxins in complex environmental samples (e.g., lake water extracts).
Key Research Reagent Solutions:
- Microplate: 96-well polystyrene plate, high protein-binding.
- Coating Antigen: Toxin-protein conjugate (e.g., Ochratoxin A-BSA).
- Blocking Buffer: 1% BSA or 3% non-fat dry milk in PBS.
- Primary Antibody: Anti-toxin monoclonal antibody.
- Sample/Toxin Standards: Toxin standards (0, 0.01, 0.1, 1, 10, 100 ng/mL) prepared in toxin-free matrix. Unknown environmental samples.
- Secondary Antibody: Horseradish Peroxidase (HRP)-conjugated anti-species IgG.
- Wash Buffer: PBS with 0.05% Tween-20 (PBST).
- Substrate Solution: TMB (3,3',5,5'-Tetramethylbenzidine).
- Stop Solution: 1 M Sulfuric Acid.
Procedure:
- Plate Coating: Dilute coating antigen in carbonate/bicarbonate buffer (pH 9.6). Add 100 µL/well. Incubate overnight at 4°C.
- Washing: Aspirate and wash plate 3x with wash buffer.
- Blocking: Add 200 µL/well of blocking buffer. Incubate for 1-2 hours at room temperature (RT). Wash 3x.
- Competition: Premix a constant dilution of primary antibody with equal volumes of toxin standards or samples. Incubate for 15-30 minutes. Transfer 100 µL of each mixture to the coated wells. Incubate for 1 hour at RT. Wash 3x.
- Detection: Add 100 µL/well of HRP-conjugated secondary antibody. Incubate for 1 hour at RT. Wash 5x.
- Signal Development: Add 100 µL/well of TMB substrate. Incubate in the dark for 10-15 minutes.
- Reaction Stop: Add 50 µL/well of stop solution. The color will change from blue to yellow.
- Data Analysis: Measure absorbance at 450 nm immediately. Generate a standard curve (log toxin concentration vs. % inhibition) and interpolate unknown sample concentrations.
Visualizations
Diagram 1: SPR Direct Binding Assay Workflow
Diagram 2: Competitive ELISA Signaling Pathway
The Scientist's Toolkit
Table 2: Essential Research Reagents and Materials
| Item | Function in SPR/ELISA | Example/Note |
|---|---|---|
| Carboxymethylated (CM5) Sensor Chip | Gold surface with a dextran matrix for covalent ligand immobilization via amine coupling. Core SPR consumable. | Series S Sensor Chip C (Cytiva) |
| HBS-EP+ Buffer | Standard running buffer for SPR. Provides consistent ionic strength and pH, while surfactant minimizes non-specific binding. | Cytiva product # BR100669 |
| EDC & NHS | Crosslinking reagents for activating carboxyl groups on the sensor chip dextran for ligand immobilization. | Thermo Fisher Scientific #PG82079 |
| Toxin-Protein Conjugate | Critical coating antigen for competitive ELISA. BSA or OVA conjugated to the target small-molecule toxin. | Synthesized in-house or sourced from specialty vendors. |
| Anti-Toxin Monoclonal Antibody | High-affinity, specific capture/detection reagent for both SPR (ligand) and ELISA (primary antibody). | Must be characterized for cross-reactivity. |
| HRP-Conjugated Secondary Antibody | Enzyme-linked antibody for signal amplification in ELISA. Binds to the primary antibody species. | Goat anti-mouse IgG-HRP (for mouse mAbs). |
| TMB Substrate Solution | Chromogenic substrate for HRP. Turns blue upon oxidation, stopped to yellow for absorbance reading. | Stable, ready-to-use solutions preferred (e.g., Thermo Fisher #34021). |
| Microplate Reader | Instrument for measuring absorbance (450 nm) or luminescence in ELISA. Essential for endpoint analysis. | SpectraMax, Synergy, or similar. |
Application Notes
Within a thesis focused on developing Surface Plasmon Resonance (SPR) biosensors for environmental toxin analysis, the integration and contrast with orthogonal chromatographic techniques is critical. SPR provides real-time, label-free data on biomolecular interactions (e.g., toxin binding to an antibody or receptor), but lacks inherent chemical identification. Chromatography coupled with mass spectrometry (HPLC/GC-MS) provides definitive chemical analysis and quantification but is typically endpoint and does not measure interaction kinetics or affinity directly.
Key Comparative Insights:
- SPR excels in screening for "bioactivity" – identifying which samples contain compounds that bind to a specific biological target (e.g., estrogen receptor for endocrine disruptors). It quantifies affinity (KD), kinetics (ka, kd), and concentration of active analyte in complex matrices without purification.
- HPLC/GC-MS is indispensable for identifying and quantifying the specific chemical entities present in a sample (e.g., determining if it's Bisphenol A, atrazine, or a mycotoxin). It confirms the identity of the SPR-active compound and measures its total chemical concentration, not just the bioactive fraction.
Integrated Workflow for Environmental Analysis:
- SPR-based Screening: A crude environmental extract (water, soil) is injected over an SPR sensor chip coated with a target protein. A binding response indicates the presence of bioactive compounds.
- Fractionation & Identification: Active samples are fractionated via HPLC. Each fraction is re-analyzed by SPR to pinpoint the bioactive fraction, which is then routed to GC-MS or LC-MS for definitive chemical identification.
- Validation: The purified identified toxin is characterized by SPR for full thermodynamic and kinetic profiling.
Table 1: Core Comparison of SPR and Chromatography/MS Techniques
| Feature | Surface Plasmon Resonance (SPR) | High-Performance Liquid Chromatography (HPLC) | Gas Chromatography-Mass Spectrometry (GC-MS) |
|---|---|---|---|
| Primary Output | Binding kinetics (ka, kd), affinity (KD), concentration (RU) | Chromatographic separation, retention time, UV/FLD peak area | Mass spectra, molecular fingerprint, fragment ion patterns |
| Identification | None (binds to target X) | Tentative (matches RT/spectra to standard) | Definitive (high-confidence spectral match to libraries) |
| Quantification Basis | Mass change on sensor surface (Response Units) | Detector signal vs. calibration curve (e.g., ng/mL) | Ion abundance vs. calibration curve (e.g., ppb) |
| Sample Throughput | Medium-High (real-time, flow system) | Low-Medium (sequential runs) | Low-Medium (sequential runs) |
| Key Advantage | Label-free, real-time interaction data; functional activity | Excellent for non-volatile, thermally labile compounds | Gold standard for volatile/semi-volatile compound ID |
| Key Limitation | Cannot identify unknown compounds | Requires standards for positive ID; less sensitive than MS | Requires derivatization for many polar toxins; destructive |
| Typical LOD | ~0.1-10 nM (depending on analyte size) | ~0.1-1 ng (UV detection) | ~0.01-0.1 pg (SIM mode for target compounds) |
Experimental Protocols
Protocol 1: SPR-Based Screening for Estrogenic Compounds in Water Samples
Objective: To detect and quantify compounds in river water that bind to the human estrogen receptor alpha ligand-binding domain (hERα-LBD).
Research Reagent Solutions & Materials:
| Item | Function |
|---|---|
| SPR Instrument (e.g., Biacore T200, Cytiva) | Platform for real-time, label-free interaction analysis. |
| CMS Sensor Chip (Cytiva) | Carboxymethylated dextran chip for ligand immobilization. |
| Human ERα-LBD (Recombinant) | The biological target protein (ligand) immobilized on the chip. |
| N-ethyl-N'-(3-dimethylaminopropyl)carbodiimide (EDC)/N-hydroxysuccinimide (NHS) | Activates carboxyl groups on chip for covalent coupling. |
| Ethanolamine HCl | Blocks remaining activated groups after immobilization. |
| HBS-EP+ Running Buffer (10mM HEPES, 150mM NaCl, 3mM EDTA, 0.05% v/v Surfactant P20, pH 7.4) | Standard SPR running and dilution buffer. |
| 17β-Estradiol (E2) Standard | Positive control analyte for system validation. |
| Solid-Phase Extraction (SPE) Columns (C18) | For concentrating and desalting water samples. |
Methodology:
- Chip Preparation: Dock a new CMS sensor chip and prime the system with HBS-EP+ buffer.
- Ligand Immobilization: Using amine coupling, inject a 7-minute pulse of a 1:1 mixture of EDC and NHS at 10 µL/min to activate the dextran matrix. Inject hERα-LBD (20 µg/mL in 10 mM sodium acetate, pH 5.0) over the desired flow cell until ~10,000 Response Units (RU) are achieved. Inject ethanolamine-HCl for 7 minutes to block remaining sites.
- Sample Preparation: Pass 1 L of river water through a conditioned C18 SPE column. Elute bound compounds with 5 mL of methanol. Dry under nitrogen and reconstitute in 100 µL of HBS-EP+ buffer.
- Binding Analysis: Set instrument temperature to 25°C. Dilute the reconstituted sample 1:10 in running buffer. Inject over both the hERα-LBD and reference flow cells for 120 seconds at 30 µL/min, followed by a 300-second dissociation phase. Regenerate the surface with a 30-second pulse of 10 mM Glycine-HCl, pH 2.0.
- Data Processing: Subtract the reference flow cell signal. Fit the corrected sensorgram for the positive control (E2) to a 1:1 binding model to determine kinetic constants. Report sample responses as Resonance Units (RU) at the end of the injection.
Protocol 2: HPLC Fractionation with SPR Activity Tracking & GC-MS Identification
Objective: To isolate and identify the specific SPR-active compound from a positive environmental sample.
Research Reagent Solutions & Materials:
| Item | Function |
|---|---|
| HPLC System with Fraction Collector | Separates complex mixtures and collects timed fractions. |
| Reverse-Phase C18 Column (e.g., 250 x 4.6 mm, 5 µm) | Standard column for separating mid-to-non-polar compounds. |
| GC-MS System with EI Source | Provides definitive chemical identification via fragmentation patterns. |
| Derivatization Reagent (e.g., MSTFA) | Silylates polar groups (e.g., -OH) for volatility in GC-MS. |
| Autosampler Vials & Inserts | For holding samples and fractions. |
Methodology:
- HPLC Method Development: Using the SPR-positive crude extract, develop a gradient method (e.g., Water/Acetonitrile + 0.1% Formic Acid, 5% to 95% ACN over 45 min). Collect fractions every 30 seconds.
- SPR Activity Mapping: Dry down each HPLC fraction. Reconstitute each in HBS-EP+ buffer and analyze via the SPR protocol above (Protocol 1, Step 4). Identify the fraction(s) containing the bioactive compound.
- GC-MS Sample Prep: Transfer the active fraction to a GC vial. Dry completely under nitrogen. Add 50 µL of pyridine and 50 µL of MSTFA. Heat at 60°C for 45 minutes for derivatization.
- GC-MS Analysis:
- GC: Inject 1 µL in splitless mode onto a 30m HP-5MS column. Oven program: 50°C (hold 2 min), ramp 20°C/min to 320°C (hold 5 min).
- MS: Operate in electron impact (EI) mode at 70 eV. Scan from m/z 50-650.
- Data Analysis: Compare the acquired mass spectrum against standard libraries (NIST, Wiley). Confirm identity by comparing retention time and mass spectrum to an analytical standard, if available.
Visualizations
Title: Integrated SPR-Chromatography Workflow for Toxin Analysis
Title: SPR vs HPLC vs GC-MS: Outputs and Roles
1.0 Introduction: Context Within Environmental Toxin Analysis Research
Within the broader thesis on Surface Plasmon Resonance (SPR) for environmental toxin analysis, validation against established reference methods is not merely beneficial—it is imperative for regulatory acceptance and scientific credibility. This Application Note details the protocols and frameworks for conducting rigorous correlation studies between SPR biosensor assays and gold-standard analytical techniques, such as Liquid Chromatography-Mass Spectrometry (LC-MS/MS) and Enzyme-Linked Immunosorbent Assay (ELISA). The goal is to demonstrate that SPR, offering real-time, label-free kinetics, can deliver quantitative results concordant with traditional methods while providing superior throughput and insight into binding mechanisms.
2.0 Core Correlation Study Protocol
2.1 Experimental Design for Method Comparison A split-sample design is employed where identical environmental samples (e.g., water, soil extract, food homogenate) spiked with a target toxin (e.g., microcystin-LR, ochratoxin A) are analyzed in parallel by SPR and the reference method. A minimum of 20 samples across the analytical measurement range (including blank, low, mid, and high concentrations) is recommended for robust statistical analysis.
2.2 Detailed Protocol: SPR Assay for Microcystin-LR Validation vs. LC-MS/MS
- SPR Sensor Chip Preparation: A CM5 series S chip is used. The surface is activated with a 1:1 mixture of 0.4 M EDC and 0.1 M NHS for 7 minutes. Anti-microcystin monoclonal antibody (10 µg/mL in 10 mM sodium acetate, pH 5.0) is immobilized via amine coupling to achieve a response of ~10,000 RU. Remaining active esters are deactivated with 1 M ethanolamine-HCl, pH 8.5.
- Sample Analysis: Running buffer is HBS-EP+ (10 mM HEPES, 150 mM NaCl, 3 mM EDTA, 0.05% v/v Surfactant P20, pH 7.4). Samples and calibration standards are injected for 120 seconds at a flow rate of 30 µL/min, followed by a 300-second dissociation phase. Surface regeneration is achieved with two 30-second pulses of 10 mM glycine-HCl, pH 2.0.
- Data Processing: The response is recorded in Resonance Units (RU). A calibration curve (Response vs. log[concentration]) is fitted using a 4-parameter logistic (4PL) model. Unknown concentrations are interpolated from this curve.
2.3 Detailed Protocol: Reference LC-MS/MS Analysis for Microcystin-LR
- Sample Preparation: Solid-phase extraction (SPE) using C18 cartridges preconditioned with methanol and water. Samples are loaded, washed with 20% methanol, and eluted with 100% methanol. Eluates are dried under nitrogen and reconstituted in mobile phase.
- LC Conditions: Column: C18 (100 x 2.1 mm, 1.7 µm). Mobile Phase A: 0.1% Formic acid in water. B: 0.1% Formic acid in acetonitrile. Gradient: 20% B to 95% B over 8 minutes. Flow rate: 0.3 mL/min.
- MS/MS Conditions: Ionization: Electrospray Ionization (ESI), positive mode. Multiple Reaction Monitoring (MRM) transitions: 995.5 > 135.0 (quantifier) and 995.5 > 213.0 (qualifier). Calibration uses internal standard (deuterated microcystin-LR).
3.0 Data Presentation & Statistical Analysis
Table 1: Correlation Data for Microcystin-LR in Water Samples (n=24)
| Sample ID | SPR Result (µg/L) | LC-MS/MS Result (µg/L) | % Difference |
|---|---|---|---|
| Blank | < LOD | < LOD | N/A |
| S1 (Low) | 0.15 | 0.14 | +7.1% |
| S2 (Low) | 0.32 | 0.30 | +6.7% |
| S3 (Mid) | 1.05 | 1.10 | -4.5% |
| S4 (Mid) | 2.22 | 2.30 | -3.5% |
| S5 (High) | 9.80 | 9.50 | +3.2% |
| S6 (High) | 19.50 | 20.10 | -3.0% |
| Statistical Summary | SPR Method | LC-MS/MS Method | Comparison |
| Linear Range | 0.1 - 25 µg/L | 0.05 - 50 µg/L | R² = 0.998 |
| Average Precision (%CV) | 6.2% | 4.8% | Slope = 0.98 |
| Limit of Detection (LOD) | 0.05 µg/L | 0.02 µg/L | Intercept = 0.07 |
| Recovery (%) | 92-105% | 94-108% | Bland-Altman Bias = -0.09 µg/L |
4.0 Mandatory Visualization
Title: Workflow for SPR Method Validation vs. Reference
Title: SPR Direct Detection Signaling Pathway for Toxins
5.0 The Scientist's Toolkit: Key Research Reagent Solutions
| Item / Reagent | Function in Validation Study |
|---|---|
| SPR Sensor Chip (e.g., CMS) | Gold-coated glass slide with a carboxylated dextran matrix for stable ligand immobilization. |
| Anti-Toxin Monoclonal Antibody | High-affinity, specific capture molecule immobilized on the SPR chip surface. |
| Covalent Immobilization Kit (EDC/NHS) | Cross-linking reagents for covalent amine coupling of antibodies to the sensor chip. |
| HBS-EP+ Running Buffer | Provides consistent pH, ionic strength, and reduces non-specific binding in SPR assays. |
| Toxin Analytical Standards | Certified pure toxins for preparing calibration curves in both SPR and reference methods. |
| Stable Isotope-Labeled Internal Standard (for LC-MS) | Corrects for matrix effects and losses during sample preparation in MS-based validation. |
| SPE Cartridges (C18) | For sample clean-up and pre-concentration of environmental samples prior to LC-MS analysis. |
| Regeneration Buffer (e.g., Glycine-HCl) | Gently removes bound analyte from the SPR chip surface for re-use without damaging the antibody. |
This document provides application notes and protocols for assessing four critical metrics—Limit of Detection (LOD), Specificity, Reproducibility, and Cost-Per-Sample—in the development of Surface Plasmon Resonance (SPR) biosensors. This work is framed within a broader thesis focused on advancing SPR technology for the sensitive, selective, and economically viable monitoring of environmental toxins (e.g., mycotoxins, algal toxins, pesticides) in complex matrices.
Key Metrics: Definitions and Data
The following table summarizes target performance benchmarks for an SPR biosensor applied to environmental toxin analysis, derived from current literature and technological standards.
Table 1: Target Performance Metrics for SPR in Environmental Toxin Analysis
| Metric | Definition | Target Benchmark (for a model toxin, e.g., Aflatoxin B1) | Measurement Method |
|---|---|---|---|
| Limit of Detection (LOD) | The lowest analyte concentration that can be reliably distinguished from zero. | ≤ 0.1 ng/mL (ppb) | Signal-to-Noise ratio (S/N=3) from calibration curve of blank matrix. |
| Specificity | The ability to measure the target analyte without interference from cross-reactants. | ≥ 95% recovery in presence of structural analogs (e.g., Aflatoxin B2, G1). | Spike recovery test in the presence of common interferents at 10x concentration. |
| Reproducibility | The precision of repeated measurements under specified conditions. | Intra-assay CV ≤ 5%; Inter-assay CV ≤ 10%. | Coefficient of Variation (CV%) from replicate measurements (n≥5). |
| Cost-Per-Sample | Total consumable and operational cost for a single analysis. | ≤ $15 per sample (excluding capital equipment). | Sum of chip, ligand, running buffer, and regeneration solution costs. |
Experimental Protocols
Protocol A: Determining the Limit of Detection (LOD)
Objective: To establish the minimum detectable concentration of a target toxin (e.g., Ochratoxin A) in a purified water sample.
Materials:
- SPR instrument (e.g., Biacore, OpenSPR).
- Sensor chip (e.g., carboxymethylated dextran gold chip).
- Anti-ochratoxin A monoclonal antibody (ligand).
- Ochratoxin A standards (0, 0.01, 0.05, 0.1, 0.5, 1.0 ng/mL in running buffer).
- EDC/NHS coupling kits, ethanolamine.
- HBS-EP running buffer (10 mM HEPES, 150 mM NaCl, 3 mM EDTA, 0.05% v/v Surfactant P20, pH 7.4).
- Regeneration solution (e.g., 10 mM Glycine-HCl, pH 2.0).
Procedure:
- Chip Functionalization: Activate the sensor chip surface with a 1:1 mixture of 0.4 M EDC and 0.1 M NHS for 7 minutes.
- Ligand Immobilization: Dilute the anti-ochratoxin A antibody to 20 µg/mL in 10 mM sodium acetate buffer (pH 5.0). Inject over the activated surface for 10 minutes to achieve a target immobilization level of ~10,000 Response Units (RU).
- Surface Blocking: Inject 1 M ethanolamine-HCl (pH 8.5) for 7 minutes to deactivate excess reactive esters.
- Calibration Curve Generation: In triplicate, inject ochratoxin A standard solutions (0 to 1.0 ng/mL) over the ligand surface at a flow rate of 30 µL/min for 3 minutes (association), followed by running buffer for 5 minutes (dissociation).
- Regeneration: After each sample injection, inject the regeneration solution for 60 seconds to remove bound analyte.
- Data Analysis: Plot the maximum equilibrium response (RU) vs. analyte concentration. Fit a four-parameter logistic curve. Calculate the LOD as the concentration corresponding to the mean response of the zero standard plus three times its standard deviation.
Protocol B: Assessing Specificity via Cross-Reactivity Test
Objective: To evaluate the biosensor's ability to distinguish the target toxin from common structural analogs.
Materials: Same as Protocol A, plus cross-reactant standards (e.g., Ochratoxin B, Ochratoxin C, 4-Hydroxyochratoxin A).
Procedure:
- Prepare standard solutions of the target toxin (Ochratoxin A) and each cross-reactant at a fixed concentration of 1 ng/mL.
- Using the functionalized chip from Protocol A, inject each solution in triplicate, following the same injection and regeneration cycle.
- Record the equilibrium response (RU) for each injection.
- Calculate Cross-Reactivity (%) as:
(RU_cross-reactant / RU_target_analyte) * 100. Specificity is affirmed if cross-reactivity for key analogs is <5%.
Protocol C: Evaluating Reproducibility
Objective: To determine intra-assay (repeatability) and inter-assay (intermediate precision) Coefficient of Variation (CV).
Materials: Same as Protocol A.
Procedure:
- Intra-Assay Precision: In a single run, prepare and inject a mid-point calibration standard (e.g., 0.5 ng/mL Ochratoxin A) five times consecutively over the same sensor surface with regeneration between cycles.
- Inter-Assay Precision: Over five separate days, using a newly functionalized sensor chip each day, repeat the injection of the 0.5 ng/mL standard in triplicate.
- Data Analysis: For each data set, calculate the mean response (RU) and standard deviation (SD). Compute the CV% as
(SD / Mean) * 100.
Protocol D: Calculating Cost-Per-Sample
Objective: To derive the consumable cost associated with a single analytical measurement.
Procedure:
- Itemize all consumables used in one assay cycle (from Protocol A): sensor chip, ligand antibody, coupling reagents, running buffer, regeneration solution.
- Determine the total cost per unit (e.g., chip cost per flow cell, antibody cost per µg).
- Calculate the usage per sample (e.g., 50 µL of buffer per injection, 1/100th of a chip's functional lifetime).
- Sum the cost of all consumables used for a single injection/analysis to arrive at the Cost-Per-Sample. Exclude capital equipment depreciation and labor.
Visualizations
Title: Framework for Assessing Key SPR Biosensor Metrics
Title: SPR Direct Binding Assay Workflow for Toxin Detection
The Scientist's Toolkit: Research Reagent Solutions
Table 2: Essential Materials for SPR-Based Environmental Toxin Analysis
| Item | Example Product/Type | Function in the Assay |
|---|---|---|
| SPR Instrument | Biacore series (Cytiva), OpenSPR (Nicoya), Spreeta (TI). | Optical platform to generate and measure the plasmon resonance signal shift in real-time. |
| Sensor Chip | CM5 (carboxymethylated dextran), HCA (hydrophobic), SA (streptavidin). | Provides a functionalized gold surface for the stable immobilization of the biorecognition element (ligand). |
| Ligand (Capture Molecule) | Monoclonal antibody, aptamer, molecularly imprinted polymer (MIP). | Binds specifically to the target environmental toxin, providing assay specificity. |
| Coupling Reagents | EDC (1-Ethyl-3-(3-dimethylaminopropyl)carbodiimide) and NHS (N-hydroxysuccinimide). | Activates carboxylated chip surfaces for covalent ligand immobilization via amine coupling. |
| Running Buffer | HBS-EP (HEPES Buffered Saline with EDTA and surfactant). | Maintains constant pH and ionic strength; surfactant minimizes non-specific binding to the chip. |
| Regeneration Solution | Low pH (Glycine-HCl), high pH (NaOH), high salt, or chaotropic agents. | Dissociates bound analyte from the ligand without damaging it, allowing chip re-use. |
| Toxin Standards & Analogs | Certified reference materials (e.g., from Romer Labs, Sigma-Aldrich). | Used for calibration curves (quantitation) and cross-reactivity tests (specificity assessment). |
The Role of SPR in Multi-Analyte Platforms and High-Throughput Screening for Toxins
Application Notes
Surface Plasmon Resonance (SPR) is a label-free, real-time biosensing technology that has become indispensable for the high-throughput screening (HTS) and multiplexed detection of environmental toxins. Within the broader thesis on SPR for environmental toxin analysis, its application in multi-analyte platforms addresses critical needs for speed, sensitivity, and parallel processing in monitoring complex samples like water, food, and agricultural products.
Recent advancements have focused on increasing throughput and multiplexing capabilities. Traditional single-channel SPR has evolved into SPR imaging (SPRi) and array-based platforms, allowing simultaneous detection of dozens of analytes. A key innovation is the integration of SPR with microfluidic systems for automated, sequential sample delivery, drastically reducing analysis time and reagent consumption. Furthermore, the development of novel biorecognition elements—including aptamers, molecularly imprinted polymers (MIPs), and nanobodies—has enhanced the specificity and stability of SPR sensors for diverse toxin classes, from mycotoxins to marine biotoxins and pesticides.
Quantitative data from recent studies underscore the performance of these multi-analyte SPR platforms:
Table 1: Performance Metrics of Recent Multi-Analyte SPR Platforms for Toxin Detection
| Toxin Class | Specific Toxins | Platform Type | LOD (Range) | Assay Time | Multiplexing Capacity | Reference (Year) |
|---|---|---|---|---|---|---|
| Mycotoxins | Aflatoxin B1, Ochratoxin A | SPRi with aptamer array | 0.05 - 0.3 ng/mL | < 20 min | Up to 12 analytes | Wang et al. (2023) |
| Marine Biotoxins | Okadaic Acid, Saxitoxin | Smartphone-based SPR | 1.8 - 3.7 ng/mL | ~15 min | 4 analytes | Chen & Liu (2024) |
| Pesticides | Atrazine, Glyphosate | MIP-SPR microarray | 0.11 - 0.33 nM | 30 min | 8 analytes | Silva et al. (2023) |
| Heavy Metals | Hg²⁺, Pb²⁺, Cd²⁺ | Fiber-optic SPR with DNAzymes | 0.08 - 0.5 ppb | 25 min | 3 analytes | Gupta et al. (2024) |
These platforms demonstrate the shift from single-analyte confirmation to multi-analyte screening, enabling comprehensive risk assessment. The real-time kinetic data provided by SPR (ka, kd, KD) is crucial for understanding toxin-receptor interactions, aiding in the development of more effective detoxifying agents or inhibitory drugs.
Detailed Experimental Protocols
Protocol 1: SPRi for Multiplexed Mycotoxin Detection Using an Aptamer Array
Objective: To simultaneously quantify four common mycotoxins (Aflatoxin B1, Ochratoxin A, Fumonisin B1, Zearalenone) in a single cereal extract sample.
I. Research Reagent Solutions & Essential Materials
| Item | Function & Brief Explanation |
|---|---|
| SPRi Chip (Gold-coated, 16-spot array) | Sensor surface; enables parallel measurement of binding events in multiple spotted regions. |
| Thiolated Aptamers (4 sequences, specific to each toxin) | Biorecognition element; immobilized on gold surface via thiol-gold chemistry for specific capture. |
| Mycotoxin Standards & Spiked Sample Extracts | Analytes for calibration and real sample testing. |
| 1-Ethyl-3-(3-dimethylaminopropyl)carbodiimide (EDC)/ N-Hydroxysuccinimide (NHS) | Coupling agents for activating carboxylated surfaces if using a dextran chip. |
| 6-Mercapto-1-hexanol (MCH) | Backfiller molecule; creates a well-ordered self-assembled monolayer to reduce non-specific binding. |
| HBS-EP+ Running Buffer (10 mM HEPES, 150 mM NaCl, 3 mM EDTA, 0.05% v/v Surfactant P20, pH 7.4) | Standard SPR running buffer; maintains consistent pH and ionic strength, minimizes non-specific binding. |
| Regeneration Solution (10 mM Glycine-HCl, pH 2.0) | Gently removes bound analytes from aptamers without damaging them, allowing chip re-use. |
| Microfluidic Flow Cell & Autosampler (Integrated with SPRi) | Enables automated, sequential delivery of samples and buffers over the sensor array. |
II. Step-by-Step Methodology
Chip Functionalization:
- Clean the gold SPRi chip with piranha solution (Caution: Highly corrosive), followed by rinsing with ethanol and water. Dry under nitrogen.
- Spot 1 µL of each thiolated aptamer solution (1 µM in PBS) onto designated positions on the chip array using a microarray spotter. Incubate in a humid chamber for 1 hour at room temperature (RT).
- Immerse the chip in 1 mM MCH solution for 30 minutes to backfill unoccupied gold surfaces.
- Rinse with running buffer and mount the chip in the SPRi instrument.
Instrument Priming and Baseline Establishment:
- Prime the integrated microfluidic system with HBS-EP+ buffer at a flow rate of 20 µL/min.
- Establish a stable baseline for all 16 detection spots (4 analytes in replicates).
Binding Assay and Calibration:
- Sample Injection: Inject spiked cereal extract samples or toxin standard solutions (in running buffer) over the chip surface for 5 minutes (association phase).
- Buffer Flow: Switch back to running buffer for 5 minutes (dissociation phase).
- Regeneration: Inject regeneration solution for 30 seconds to strip bound toxins from the aptamers.
- Recovery: Re-equilibrate with running buffer for 2 minutes before the next cycle.
- Create a calibration curve by running a series of toxin standards (e.g., 0, 0.01, 0.1, 1, 10, 100 ng/mL) in random order.
Data Analysis:
- Use the SPRi software to extract response units (RU) for each spot at a fixed time point at the end of the association phase.
- Subtract responses from a negative control spot (spotted with a non-specific aptamer).
- Plot calibration curves for each toxin and interpolate concentrations from unknown samples.
Protocol 2: High-Throughput Screening for Toxin Inhibitors using a Microfluidic SPR System
Objective: To screen a library of 96 small-molecule compounds for their ability to inhibit the binding of a model toxin (e.g., Ochratoxin A) to its antibody.
I. Experimental Workflow
II. Step-by-Step Methodology
Ligand Immobilization:
- Using a CM5 dextran chip, activate the surface with a 1:1 mixture of EDC/NHS for 7 minutes.
- Dilute the anti-Ochratoxin A antibody to 20 µg/mL in 10 mM sodium acetate buffer (pH 5.0). Inject until the desired immobilization level (~10,000 RU) is reached.
- Block any remaining activated esters with 1 M ethanolamine-HCl (pH 8.5) for 7 minutes.
HTS Run Preparation:
- Prepare a 96-well plate containing each test compound at 100 µM in assay buffer (HBS-EP+).
- In each well, add Ochratoxin A to a final concentration of 50 nM (its approximate KD).
- Seal the plate and incubate at RT for 30 minutes to allow compound-toxin interaction.
Automated Screening Cycle:
- Program the autosampler method. Key parameters: Flow rate: 30 µL/min. Injection time of mixture: 3 min. Dissociation time: 2 min. Regeneration: 1 min pulse of 10 mM NaOH.
- Initiate the run. The instrument will sequentially draw from each well of the 96-well plate, inject the mixture, monitor the binding response, regenerate the surface, and proceed to the next well.
Data Processing:
- The binding response (RU) for the OTA/compound mixture is recorded.
- Calculate percent inhibition for each compound:
% Inhibition = [1 - (RU_compound / RU_OTA_control)] * 100whereRU_OTA_controlis the response from OTA alone. - Compounds showing >70% inhibition are considered primary hits for further dose-response analysis (IC50 determination).
Key Signaling Pathways in Toxin Detection
The fundamental signaling mechanism in SPR involves the perturbation of surface plasmons by changes in the refractive index at the sensor surface. In toxin analysis, this is leveraged through specific biorecognition events.
Conclusion
SPR biosensing represents a versatile and increasingly vital tool in the analytical arsenal for environmental toxin research. By offering label-free, real-time interaction data, it bridges the gap between simple immunoassays and complex chromatographic identification. The future of SPR in this field lies in the integration of novel biorecognition elements like nanobodies and molecularly imprinted polymers (MIPs), multiplexed array formats for high-throughput screening, and point-of-care device development using portable SPR systems. For biomedical and clinical researchers, these advancements promise not only enhanced environmental monitoring but also new pathways for understanding toxin exposure biomarkers and their implications for human health, ultimately contributing to improved risk assessment and therapeutic interventions.