SPR Biosensors for Pathogen Detection: A 2024 Guide to Principles, Methods, and Cutting-Edge Applications
This article provides a comprehensive technical overview of Surface Plasmon Resonance (SPR) biosensors for pathogen detection, tailored for researchers and drug development professionals.
SPR Biosensors for Pathogen Detection: A 2024 Guide to Principles, Methods, and Cutting-Edge Applications
Abstract
This article provides a comprehensive technical overview of Surface Plasmon Resonance (SPR) biosensors for pathogen detection, tailored for researchers and drug development professionals. It explores the foundational physics of SPR and biorecognition elements, details contemporary functionalization and assay methodologies, addresses critical troubleshooting and signal optimization strategies, and validates performance through comparative analysis with other techniques. The scope covers the complete workflow from sensor design to data interpretation, empowering scientists to implement and advance SPR-based diagnostic platforms.
Understanding SPR Biosensors: Core Principles and Pathogen Recognition Mechanisms
1. Introduction: SPR in Pathogen Detection Surface Plasmon Resonance (SPR) biosensors are pivotal in modern pathogen detection research, offering label-free, real-time monitoring of biomolecular interactions. The core principle exploits the physics of plasmon resonance—the collective oscillation of conduction electrons at a metal-dielectric interface excited by evanescent waves. This application note details the protocols and quantitative frameworks for leveraging SPR in detecting pathogenic agents, a critical component of a thesis focused on advancing rapid diagnostic technologies.
2. Core Physics & Quantitative Parameters The resonance condition is highly sensitive to changes in the refractive index within the evanescent field (typically ~200 nm from the sensor surface). Key quantitative parameters governing SPR response are summarized below.
Table 1: Key Quantitative Parameters in SPR Biosensing
| Parameter | Typical Range/Value | Impact on Pathogen Detection |
|---|---|---|
| Evanescent Field Penetration Depth | 150 - 300 nm | Defines the sensing volume; must be comparable to pathogen size (e.g., viruses ~80-120 nm). |
| Resonance Angle Shift | 0.1° ≈ 10⁻⁴ RIU | A 0.1° shift can indicate significant pathogen capture on the surface. |
| Refractive Index Unit (RIU) Sensitivity | 10⁴ - 10⁷ °/RIU | Higher sensitivity enables detection of low-concentration targets. |
| Association Rate Constant (kₐ) | 10³ - 10⁷ M⁻¹s⁻¹ | Kinetics of antibody-pathogen binding. |
| Dissociation Rate Constant (k_d) | 10⁻⁵ - 10⁻¹ s⁻¹ | Indicates binding strength and complex stability. |
| Limit of Detection (LOD) | 10² - 10⁵ PFU/mL (for viruses) | Critical for early-stage infection diagnosis. |
3. Application Notes & Protocols
Protocol 3.1: Sensor Chip Functionalization for Pathogen Capture Objective: Immobilize pathogen-specific antibodies on a gold sensor chip via a carboxymethylated dextran matrix. Materials: See The Scientist's Toolkit below. Procedure:
- Surface Activation: Inject a 7-minute pulse of a 1:1 mixture of 0.4 M EDC and 0.1 M NHS at a flow rate of 10 µL/min.
- Ligand Coupling: Dilute the purified monoclonal antibody in 10 mM sodium acetate buffer (pH 4.5) to 20 µg/mL. Inject for 10 minutes to achieve covalent amide bond formation.
- Deactivation: Inject 1 M ethanolamine-HCl (pH 8.5) for 7 minutes to block remaining active esters.
- Surface Conditioning: Perform two 30-second injections of 10 mM glycine-HCl (pH 2.0) to remove non-covalently bound ligand. Stabilize with running buffer (HBS-EP+: 10 mM HEPES, 150 mM NaCl, 3 mM EDTA, 0.05% v/v surfactant P20, pH 7.4) for at least 30 minutes.
Protocol 3.2: Real-Time Pathogen Detection and Kinetic Analysis Objective: Measure the binding kinetics of a viral sample to the immobilized antibody. Procedure:
- Baseline Establishment: Flow HBS-EP+ buffer at 30 µL/min until a stable baseline is achieved (±0.5 RU over 60 s).
- Sample Injection (Association Phase): Inject the diluted pathogen sample (e.g., inactivated virus in buffer) over the sensor surface for 5 minutes (association phase). Use a concentration series (e.g., 5, 10, 20 µg/mL or equivalent PFU/mL).
- Dissociation Phase: Switch back to buffer flow for 15 minutes to monitor complex dissociation.
- Surface Regeneration: Inject a 30-second pulse of 10 mM glycine-HCl (pH 2.5) to dissociate bound pathogen without damaging the antibody. Re-equilibrate with buffer.
- Data Analysis: Fit the resulting sensorgrams globally to a 1:1 Langmuir binding model using the SPR instrument’s software to extract kₐ, kd, and the equilibrium dissociation constant (KD = k_d/kₐ).
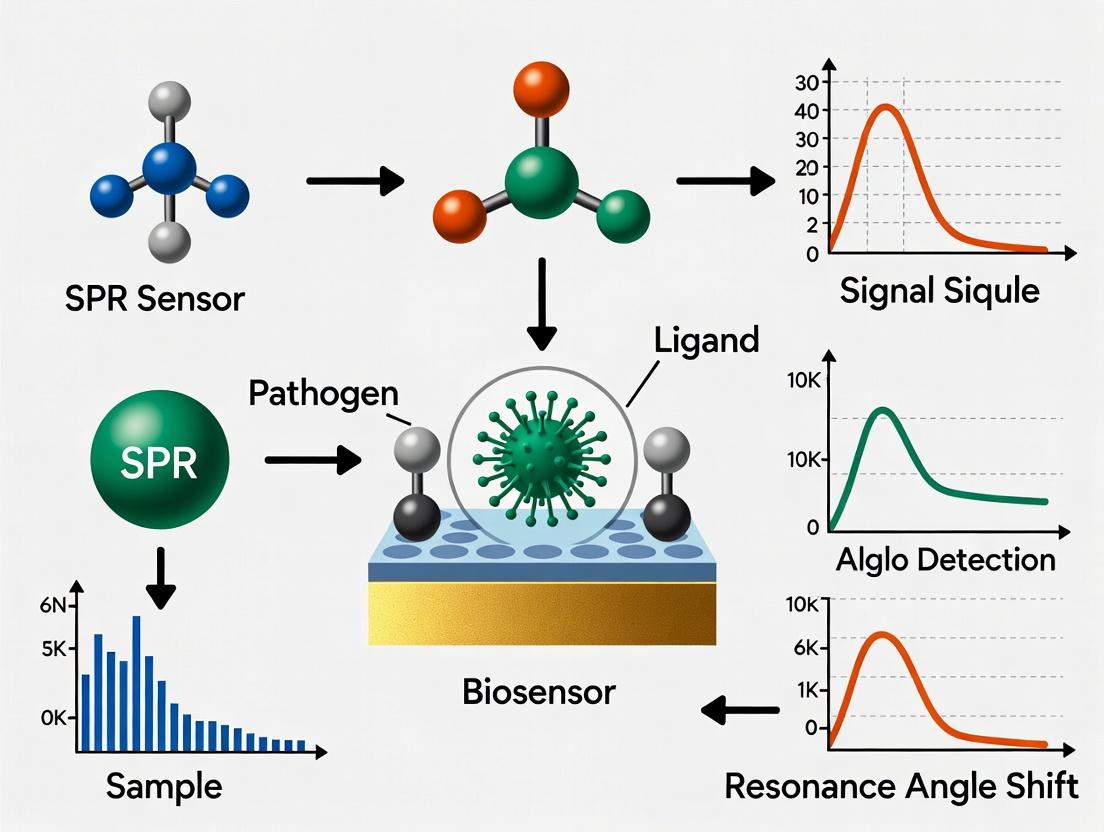
4. Visualizing the SPR Workflow and Signaling
Diagram Title: SPR Signal Pathway from Light to Biosensorgram
5. The Scientist's Toolkit Table 2: Essential Research Reagents & Materials for SPR Pathogen Detection
| Item | Function & Critical Notes |
|---|---|
| CM5 Sensor Chip (Carboxymethylated Dextran) | Gold sensor surface with a hydrogel matrix for high-capacity, low non-specific protein immobilization. |
| EDC (1-Ethyl-3-(3-dimethylaminopropyl)carbodiimide) | Crosslinking agent for activating carboxyl groups on the dextran matrix. |
| NHS (N-Hydroxysuccinimide) | Stabilizes the ester intermediate during surface activation, improving coupling efficiency. |
| Monoclonal Antibody (Target-Specific) | The capture ligand; must be purified (>95%) and have high affinity/selectivity for the target pathogen epitope. |
| Ethanolamine-HCl | Blocks unreacted NHS-esters after ligand coupling to prevent non-specific binding. |
| HBS-EP+ Running Buffer | Provides constant ionic strength and pH; surfactant P20 minimizes non-specific adsorption. |
| Glycine-HCl (pH 2.0-2.5) | Low-pH regeneration buffer; breaks antibody-antigen bonds without denaturing the immobilized antibody. |
| Reference Protein (e.g., BSA) | Used as a negative control to validate the specificity of the pathogen-binding signal. |
Application Notes: Component Integration for Pathogen Detection
Surface Plasmon Resonance (SPR) biosensors are real-time, label-free analytical platforms critical for pathogen detection research. Their efficacy hinges on the precise integration of four core subsystems: the sensor chip, microfluidics, optical system, and detector. This synergy enables the sensitive monitoring of biomolecular interactions, such as between an immobilized antibody and a viral antigen.
Key Performance Metrics (Current State, 2023-2024): Recent advancements focus on enhancing multiplexing, portability, and limit of detection (LOD) for low-abundance pathogens.
Table 1: Quantitative Performance Metrics of Modern SPR Biosensors in Pathogen Detection
| Component | Key Parameter | Typical Range/Value | Impact on Pathogen Detection |
|---|---|---|---|
| Sensor Chip | Functionalization Density | 1-5 x 10^12 molecules/cm² | Determines capture probe (antibody/aptamer) loading capacity and signal amplitude. |
| Microfluidics | Sample Volume/Flow Rate | 10-200 µL, 1-100 µL/min | Controls sample delivery, binding kinetics measurement, and minimizes nonspecific adsorption. |
| Optics | Refractive Index Resolution | < 1 x 10^-7 RIU | Defines the ultimate sensitivity to mass changes on the chip surface. |
| Detector | Data Acquisition Rate | 1-10 Hz | Enables real-time monitoring of fast association/dissociation kinetics. |
| Overall System | Limit of Detection (LOD) | 10^1-10^3 PFU/mL (for viruses) | Critical for early diagnosis; dependent on all component optimization. |
Detailed Protocols for Pathogen Detection Experiments
Protocol 2.1: Functionalization of an SPR Chip for Antibody Immobilization
This protocol details the covalent immobilization of a pathogen-specific monoclonal antibody onto a carboxymethylated dextran (CM5) sensor chip surface.
Research Reagent Solutions:
| Item | Function |
|---|---|
| CM5 Sensor Chip | Gold surface with a hydrogel matrix for high-capacity ligand immobilization. |
| EDC/NHS Mix | Cross-linking agents (1-ethyl-3-(3-dimethylaminopropyl)carbodiimide / N-hydroxysuccinimide) to activate carboxyl groups. |
| Capture Antibody | Purified monoclonal antibody specific to target pathogen (e.g., SARS-CoV-2 spike protein). |
| Ethanolamine HCl | Quenches unreacted NHS-esters after immobilization. |
| HBS-EP+ Running Buffer | (10 mM HEPES, 150 mM NaCl, 3 mM EDTA, 0.05% v/v Surfactant P20, pH 7.4) Provides stable pH and ionic strength, reduces nonspecific binding. |
| Glycine-HCl (pH 2.0) | Regeneration solution to remove bound analyte without damaging the immobilized antibody. |
Procedure:
- System Priming: Prime the SPR instrument and microfluidic system with degassed and filtered HBS-EP+ buffer.
- Chip Mounting: Dock the new CM5 sensor chip according to the manufacturer's instructions.
- Surface Activation: At a flow rate of 10 µL/min, inject a 1:1 mixture of 0.4 M EDC and 0.1 M NHS for 7 minutes.
- Antibody Immobilization: Dilute the capture antibody to 20 µg/mL in 10 mM sodium acetate buffer (pH 5.0). Inject over the activated surface for 7 minutes. The flow cell surface will show a response increase (~5-10 kRU).
- Quenching: Inject 1 M ethanolamine-HCl (pH 8.5) for 7 minutes to block remaining active esters.
- Surface Stabilization: Run buffer for 5-10 minutes until a stable baseline is achieved.
Protocol 2.2: Kinetic Analysis of Pathogen Antigen Binding
This protocol measures the real-time binding kinetics of a purified viral antigen to the immobilized antibody.
Procedure:
- Baseline Establishment: Establish a stable baseline with HBS-EP+ buffer at a continuous flow of 30 µL/min.
- Analyte Injection: Prepare serial dilutions of the purified antigen (e.g., 0.5, 2, 8, 32 nM) in running buffer. Inject each concentration for 3 minutes (association phase).
- Dissociation Monitoring: Switch flow to buffer only for 5-10 minutes to monitor dissociation.
- Surface Regeneration: Inject a 30-second pulse of 10 mM glycine-HCl (pH 2.0) to completely remove bound antigen. Re-equilibrate with buffer.
- Data Analysis: Use the instrument's software to globally fit the resulting sensorgrams to a 1:1 Langmuir binding model, extracting the association rate constant (kₐ), dissociation rate constant (kd), and equilibrium dissociation constant (KD = k_d/kₐ).
System Diagrams and Workflows
Title: SPR-Based Pathogen Detection Experimental Workflow
Title: SPR Optical Configuration and Signal Generation
Within the context of developing a Surface Plasmon Resonance (SPR) biosensor for pathogen detection, the selection and optimization of the biorecognition element (BRE) is paramount. This application note details the primary BRE classes—antibodies, aptamers, and molecularly imprinted polymers (MIPs)—alongside emerging novel ligands. The performance of an SPR biosensor in terms of sensitivity, specificity, stability, and cost is directly dictated by the BRE's affinity and robustness. This document provides comparative data, detailed protocols for BRE immobilization on SPR chips, and essential research tools.
Comparison of Biorecognition Elements
Table 1: Comparative Analysis of Key Biorecognition Elements for Pathogen Detection
| Feature | Polyclonal Antibodies | Monoclonal Antibodies | Aptamers | Molecularly Imprinted Polymers (MIPs) | Novel Ligands (e.g., DARPins, Affimers) |
|---|---|---|---|---|---|
| Production Time | Months | 4-6 months | 2-8 weeks | Days to weeks | 4-12 weeks |
| Cost (Relative) | Low | High | Moderate | Very Low | Moderate-High |
| Affinity (KD Range) | 10^-7 - 10^-11 M | 10^-8 - 10^-11 M | 10^-9 - 10^-12 M | 10^-6 - 10^-9 M | 10^-9 - 10^-12 M |
| Stability | Moderate; sensitive to heat, pH | Moderate; sensitive to heat, pH | High; thermal/chemical renaturation | Excellent; robust to heat, pH, solvents | High; thermal stability often good |
| Target Versatility | Proteins, whole cells | Proteins, whole cells | Ions, small molecules, proteins, cells | Small molecules, proteins, cells, viruses | Proteins, complex epitopes |
| Batch-to-Batch Variation | High | Low | Negligible (synthetic) | Low (optimized protocol) | Low |
| Ease of SPR Immobilization | Easy (amine, protein A/G) | Easy (amine, protein A/G) | Easy (thiol, amine, biotin) | Requires in-situ polymerization or particle attachment | Easy (engineered tags) |
| Regeneration Potential | Moderate (pH shock) | Moderate (pH shock) | High (denaturation/renaturation cycles) | Excellent (harsh conditions possible) | High (often robust) |
Table 2: Recent SPR Performance Metrics for Pathogen Detection Using Different BREs
| Pathogen Target | BRE Type | Assay Format | LOD (CFU/mL or pM) | Assay Time (min) | Reference Year |
|---|---|---|---|---|---|
| E. coli O157:H7 | Monoclonal Antibody | Direct, sandwich | 10^3 CFU/mL | ~30 | 2023 |
| SARS-CoV-2 Spike | DNA Aptamer | Direct, inhibition | 0.16 pM | ~15 | 2024 |
| Salmonella typhimurium | MIP (Nanoparticle) | Competitive | 10^2 CFU/mL | ~40 | 2023 |
| Staphylococcus aureus | Affimer (Peptide) | Direct | 10^1 CFU/mL | ~20 | 2024 |
| Influenza H1N1 | DARPin | Sandwich | 10^2 PFU/mL | ~25 | 2023 |
Experimental Protocols
Protocol 3.1: Covalent Immobilization of Antibodies on a CM5 SPR Chip (Amine Coupling)
Objective: To stably immobilize monoclonal antibodies for direct pathogen capture on an SPR sensor chip.
Materials: SPR instrument (e.g., Biacore, OpenSPR), CM5 sensor chip, HBS-EP+ running buffer (10 mM HEPES, 150 mM NaCl, 3 mM EDTA, 0.05% v/v Surfactant P20, pH 7.4), antibody solution (20-50 µg/mL in 10 mM sodium acetate, pH 4.5-5.5), 1-ethyl-3-(3-dimethylaminopropyl)carbodiimide (EDC), N-hydroxysuccinimide (NHS), 1 M ethanolamine-HCl, pH 8.5.
Procedure:
- System Preparation: Prime the SPR instrument and fluidic system with HBS-EP+ buffer.
- Chip Activation: Inject a 1:1 mixture of 0.4 M EDC and 0.1 M NHS for 7 minutes at a flow rate of 10 µL/min to activate the carboxylated dextran matrix.
- Ligand Immobilization: Immediately inject the antibody solution (diluted in appropriate low-pH buffer) for 7 minutes. Monitor the increase in response units (RU) corresponding to covalent binding.
- Deactivation: Inject 1 M ethanolamine-HCl (pH 8.5) for 7 minutes to block remaining activated ester groups.
- Baseline Stabilization: Wash with running buffer until a stable baseline is achieved. The immobilization level for pathogen detection is typically optimized between 5,000 and 15,000 RU.
- Regeneration Scouting: Perform short injections (30-60 sec) of regeneration candidates (e.g., 10 mM glycine-HCl pH 2.0-3.0, 0.1% SDS) to identify a solution that fully dissociates captured pathogen without damaging the antibody.
Protocol 3.2:In-situSynthesis of a MIP Layer on an SPR Gold Chip for Whole Bacteria
Objective: To create a thin, specific MIP film directly on the gold sensor surface for label-free pathogen detection.
Materials: SPR gold chip, allyl mercaptan, ethylene glycol dimethacrylate (EGDMA), methacrylic acid (MAA), 2,2'-azobis(2-methylpropionitrile) (AIBN), template pathogen (e.g., heat-killed Listeria), acetonitrile, acetic acid (90% v/v).
Procedure:
- Surface Vinylization: Clean the gold chip with piranha solution (Caution: Highly corrosive). Incubate in 10 mM allyl mercaptan in ethanol for 12 hours to form a self-assembled monolayer with terminal vinyl groups. Rinse with ethanol and dry.
- Pre-polymerization Mixture: Prepare a solution containing functional monomer (MAA, 50 mM), cross-linker (EGDMA, 250 mM), initiator (AIBN, 5 mM), and template pathogen (10^6 CFU/mL heat-killed) in acetonitrile. Sonicate and purge with nitrogen.
- Polymerization: Place the vinyl-functionalized chip in the mixture. Heat to 60°C for 2 hours under nitrogen to initiate thermally-driven radical polymerization, forming a thin polymer film around the pathogen templates.
- Template Removal: Wash the chip sequentially with 90% acetic acid and deionized water under vigorous agitation (e.g., sonication in bath) to extract the template pathogens, leaving behind specific recognition cavities.
- Validation: Characterize the MIP surface by SEM/AFM and validate binding specificity against the target pathogen and non-target controls using SPR.
Protocol 3.3: Selection of DNA Aptamers for a Viral Protein via SELEX (Systematic Evolution of Ligands by EXponential Enrichment)
Objective: To isolate single-stranded DNA (ssDNA) aptamers with high affinity for the SARS-CoV-2 spike protein RBD.
Materials: Recombinant RBD protein, ssDNA library (~80 nt random region, flanked by primer sites), biotinylated forward primer, streptavidin-coated magnetic beads, binding buffer (PBS with 1 mM MgCl2, 0.1 mg/mL BSA), PCR reagents, spin columns, elution buffer (7 M urea, 10 mM EDTA).
Procedure (One Round):
- Incubation: Incubate the naïve ssDNA library (1 nmol) with RBD immobilized on a solid support (e.g., magnetic beads) in binding buffer for 30 min at 25°C.
- Partitioning: Wash beads with binding buffer to remove unbound and weakly bound sequences.
- Elution: Elute bound sequences by heating the beads at 95°C for 5 min in elution buffer or using free RBD as a competitor.
- Amplification: Amplify the eluted ssDNA by PCR using the biotinylated forward primer. Separate strands using streptavidin beads under alkaline conditions to recover the non-biotinylated anti-sense strand (enriched pool).
- Iteration: Use the enriched pool as input for the next round of selection. Typically, 8-15 rounds are performed, with increasing stringency (reduced protein concentration, increased wash rigor).
- Cloning & Sequencing: Clone the final pool and sequence individual candidates for characterization via SPR affinity measurements.
Visualization
Diagram 1: MIP Synthesis and Template Removal Workflow
Diagram 2: SELEX Cycle for Aptamer Selection
The Scientist's Toolkit
Table 3: Essential Research Reagent Solutions for SPR Biosensor Development
| Item | Function in BRE Research | Example Vendor/Product |
|---|---|---|
| CM5 Sensor Chip | Gold sensor surface with carboxymethylated dextran hydrogel for high-capacity covalent ligand immobilization (e.g., antibodies). | Cytiva (Series S CM5) |
| Gold Sensor Chip (Bare) | Unmodified gold surface for thiol-based chemistry, in-situ MIP synthesis, or creating custom self-assembled monolayers. | XanTec bioanalytics (G-chips) |
| HBS-EP+ Buffer (10X) | Standard SPR running buffer, contains surfactant to minimize non-specific binding; essential for baseline stability. | Cytiva (BR100669) |
| Amino Coupling Kit | Contains pre-optimized EDC, NHS, and ethanolamine solutions for standard covalent immobilization of proteins/peptides. | Cytiva (BR100050) |
| Streptavidin Sensor Chip (SA) | Pre-immobilized streptavidin for capturing biotinylated BREs (e.g., biotinylated aptamers, antibodies); ensures uniform orientation. | Cytiva (Series S SA) |
| PEG6-Alkanethiol | Used to create a hydrophilic, anti-fouling self-assembled monolayer on gold, minimizing non-specific binding of proteins/cells. | Sigma-Aldrich (673665) |
| Recombinant Pathogen Antigens | High-purity proteins (e.g., viral spike proteins, bacterial toxins) for BRE screening, characterization, and assay development. | Sino Biological, The Native Antigen Company |
| Regeneration Scouting Kits | Pre-formatted solutions of varying pH and ionic strength to efficiently identify optimal regeneration conditions for each BRE. | Cytiva (BR-100354) |
Surface Plasmon Resonance (SPR) biosensors are pivotal in modern pathogen detection research, offering label-free, real-time analysis of biomolecular interactions. Within the broader thesis on advancing SPR for clinical and environmental monitoring, the rigorous evaluation of four key performance metrics—Sensitivity, Specificity, Limit of Detection (LOD), and Assay Time—is paramount. This document provides detailed application notes and standardized protocols to quantify these metrics, enabling researchers to benchmark sensor performance, optimize assay conditions, and validate biosensors for translational applications in diagnostics and drug development.
Definitions and Quantitative Benchmarks
Sensitivity: In diagnostic testing, sensitivity is the proportion of true positive samples correctly identified by the assay. For an SPR biosensor, it also refers to the minimum refractive index unit (RIU) change the instrument can reliably measure, which directly influences the clinical sensitivity. Specificity: The proportion of true negative samples correctly identified. For SPR, this hinges on the selective recognition of the target pathogen by the immobilized biorecognition element (e.g., antibody, aptamer). Limit of Detection (LOD): The lowest concentration of analyte (pathogen) that can be consistently distinguished from zero. It is a critical metric for early-stage infection detection. Assay Time: The total time from sample introduction to result acquisition, encompassing binding kinetics, washing, and regeneration steps.
Table 1: Current Performance Benchmarks for SPR Biosensors in Pathogen Detection
| Pathogen Target | Typical Bioreceptor | Reported Sensitivity (Clinical) | Reported Specificity (Clinical) | LOD (CFU/mL or pM) | Assay Time (min) | Reference Year |
|---|---|---|---|---|---|---|
| E. coli O157:H7 | Monoclonal Antibody | 95-99% | 97-99.5% | 10^1 - 10^3 CFU/mL | 15-30 | 2023 |
| Salmonella spp. | Aptamer | 92-98% | 95-99% | 10^2 CFU/mL | 20-40 | 2024 |
| Influenza A Virus | Glycan-based ligand | >97% | >96% | 10^2 pfu/mL | 25-35 | 2023 |
| SARS-CoV-2 Spike Protein | Polyclonal Antibody | 98.5% | 99.2% | 0.1-1 ng/mL | 12-20 | 2024 |
Detailed Experimental Protocols
Protocol 3.1: Determining Clinical Sensitivity and Specificity
Objective: To validate the SPR biosensor against a gold-standard method (e.g., PCR, culture) using a characterized panel of clinical samples. Materials: SPR biosensor system, sensor chips functionalized with capture probe, positive/negative control samples, validated clinical samples (blinded), running buffer (e.g., HBS-EP+). Procedure:
- Sample Panel Preparation: Assemble a panel of N samples with known status via gold-standard testing. Include a range of target concentrations.
- Sensor Surface Preparation: Immobilize the capture bioreceptor (Protocol 3.3) on all flow cells.
- Assay Execution: Inject each sample (diluted in running buffer) over the sensor surface at a constant flow rate (e.g., 30 µL/min). Record the binding response (RU).
- Data Analysis: Establish a cutoff response (RU) using negative control samples (mean + 3 standard deviations). Responses above the cutoff are positive.
- Calculation: Generate a confusion matrix. Sensitivity = (True Positives / (True Positives + False Negatives)) * 100. Specificity = (True Negatives / (True Negatives + False Positives)) * 100.
Protocol 3.2: Calculating the Limit of Detection (LOD)
Objective: To determine the lowest concentration of purified target analyte that can be reliably detected. Materials: Purified target analyte (e.g., whole pathogen, recombinant protein), serial dilution in running buffer, functionalized sensor chip. Procedure:
- Analyte Dilution: Prepare at least 6 serial dilutions of the target, spanning from below to above the expected LOD, plus a zero-concentration blank (buffer).
- Replicate Measurements: Inject each concentration in triplicate across independently functionalized sensor channels.
- Response Measurement: Record the steady-state binding response or the initial binding rate for each injection.
- Calibration Curve: Plot response vs. analyte concentration. Fit with a suitable model (e.g., 4-parameter logistic or linear for narrow range).
- LOD Calculation: LOD = (Mean response of blank + 3 * Standard Deviation of blank) interpolated on the calibration curve. Confirm with a concentration yielding a signal-to-noise ratio (SNR) ≥ 3.
Protocol 3.3: Standardized Sensor Chip Functionalization
Objective: To create a reproducible, high-affinity biosensing surface for pathogen capture. Materials: Carboxymethylated dextran (CM5) sensor chip, 1-ethyl-3-(3-dimethylaminopropyl)carbodiimide (EDC), N-hydroxysuccinimide (NHS), bioreceptor (e.g., antibody at 10-50 µg/mL in sodium acetate buffer, pH 4.0-5.5), 1 M ethanolamine-HCl (pH 8.5), HBS-EP+ buffer. Procedure:
- Activation: Mix equal volumes of 400 mM EDC and 100 mM NHS. Inject a 7-minute pulse (e.g., 10 µL/min) to activate the carboxyl groups.
- Immobilization: Immediately inject the bioreceptor solution (diluted in appropriate low-ionic strength buffer) for 7-15 minutes until the desired immobilization level (e.g., 5000-10000 RU for antibodies) is achieved.
- Deactivation: Inject 1 M ethanolamine-HCl (pH 8.5) for 7 minutes to block remaining activated esters.
- Conditioning: Perform 3-5 injection cycles of the target analyte at a high concentration followed by a regeneration solution (e.g., 10 mM glycine-HCl, pH 2.0) to stabilize the surface.
Visualizations
Diagram 1: SPR Assay Workflow & Metric Evaluation Points
Diagram 2: Relationship Between Core Performance Metrics
The Scientist's Toolkit: Essential Research Reagents & Materials
Table 2: Key Research Reagent Solutions for SPR Pathogen Detection
| Item | Function & Rationale | Example Product/Catalog |
|---|---|---|
| Carboxymethylated Dextran (CM) Sensor Chips | Gold standard for generating a low-noise, hydrophilic matrix for covalent bioreceptor immobilization. | Cytiva Series S CM5 Chip |
| EDC/NHS Crosslinking Kit | Activates carboxyl groups on the sensor surface for amine coupling of antibodies, proteins, or aptamers. | Thermo Fisher 22980 (Pierce) |
| HBS-EP+ Buffer (10x) | Standard running buffer (HEPES, NaCl, EDTA, Surfactant P20). Provides consistent ionic strength and minimizes non-specific binding. | Cytiva BR-1006-69 |
| Glycine-HCl Regeneration Buffers (pH 1.5-3.0) | Solutions to dissociate bound analyte from the capture ligand, allowing sensor surface reuse. | Cytiva BR-1003-55 |
| Anti-Mouse/ Rabbit/ etc. Capture Antibodies | For ligand capture assays, offering oriented immobilization and improved antigen binding capacity. | Cytiva Human Antibody Capture Kit |
| Purified Pathogen Antigens/ Whole Cells | Essential positive controls for calibration curve generation, LOD determination, and specificity testing. | ATCC/ BEI Resources |
| Kinetics Buffer Additives (BSA, Tween-20) | Used to supplement buffers (e.g., 0.1% BSA) to further reduce non-specific adsorption to the sensor surface. | Sigma-Aldrich A7906, P9416 |
Building an SPR Assay: Step-by-Step Protocols and Recent Application Cases
Within the broader thesis research focused on developing a Surface Plasmon Resonance (SPR) biosensor for rapid, label-free pathogen detection, the functionalization of the sensor surface is the critical foundational step. This process determines the density, orientation, and activity of immobilized biorecognition elements (e.g., antibodies, aptamers), directly influencing the assay's sensitivity, specificity, and limit of detection. This document provides detailed application notes and protocols for preparing gold sensor chips and applying key immobilization chemistries.
Core Chemistries for Pathogen Detection
The choice of chemistry depends on the bioreceptor. For bacterial or viral detection, capturing whole pathogens often requires a dense, oriented layer of antibodies.
| Chemistry | Ligand Type | Mechanism | Typical Immobilization Density (fmol/mm²) | Best For |
|---|---|---|---|---|
| Thiol-based Self-Assembled Monolayer (SAM) | Protein A/G, Antibody | Covalent gold-thiol bond, followed by protein capture or coupling. | 15-25 (for Protein A) | Oriented antibody capture. |
| Carboxylated Dextran (CMx chips) | Antibody, Aptamer | EDC/NHS activation to form reactive esters for amine coupling. | 20-50 | High-capacity, 3D matrix for small molecule/analyte detection. |
| Streptavidin-Biotin | Biotinylated Antibody/Aptamer | High-affinity non-covalent interaction on a pre-immobilized streptavidin layer. | 10-20 (for biotinylated antibody) | Flexible, stable capture of diverse biotinylated probes. |
| Direct Thiolation | Thiol-modified Aptamer | Direct covalent binding of thiol-group to gold surface. | 5-15 | DNA/RNA aptamers for specific pathogen epitopes. |
Table 1: Key Immobilization Chemistries for SPR Pathogen Biosensing.
Detailed Protocols
Protocol 3.1: Gold Chip Cleaning and Preparation
Objective: To obtain a pristine, hydrophilic gold surface for subsequent functionalization.
- Piranha Cleaning (Caution: Highly exothermic and corrosive): Freshly prepare a 3:1 (v/v) mixture of concentrated sulfuric acid (H₂SO₄) and hydrogen peroxide (H₂O₂, 30%). Immerse the gold chip for 1-2 minutes. Rinse extensively with ultra-pure water (≥18.2 MΩ·cm).
- Alternative/Sequential Cleaning: Sonicate the chip sequentially in acetone, ethanol, and ultra-pure water for 10 minutes each. Dry under a stream of nitrogen.
- Plasma Treatment: Place the cleaned chip in a plasma cleaner for 5 minutes at medium power under oxygen or argon atmosphere to remove residual organics and enhance hydrophilicity.
- Immediate Use: Use the chip for functionalization within 15 minutes of cleaning.
Protocol 3.2: Protein A-Mediated Antibody Immobilization (Thiol-SAM)
Objective: To create an oriented antibody surface for capturing bacterial pathogens.
- SAM Formation: Incubate the clean gold chip overnight at 4°C in a 1 mM solution of 11-mercaptoundecanoic acid (11-MUA) in ethanol.
- Rinse: Rinse thoroughly with ethanol and phosphate-buffered saline (PBS, pH 7.4).
- Activation: Inject a solution containing 0.4 M EDC and 0.1 M NHS in water over the surface for 10 minutes to activate carboxyl groups.
- Protein A Immobilization: Dilute recombinant Protein A to 50 µg/mL in 10 mM sodium acetate buffer (pH 4.5). Inject over the activated surface for 20 minutes. Unreacted esters are deactivated with 1 M ethanolamine-HCl (pH 8.5) for 10 minutes.
- Antibody Capture: Inject the monoclonal antibody specific to the target pathogen (e.g., E. coli O157:H7) at 20 µg/mL in HBS-EP buffer (10 mM HEPES, 150 mM NaCl, 3 mM EDTA, 0.005% v/v Surfactant P20, pH 7.4) for 10 minutes. The surface is now ready for pathogen injection.
Protocol 3.3: Direct Amine Coupling to Carboxylated Dextran Chip (CM5)
Objective: To immobilize an antibody or protein directly onto a high-capacity hydrogel chip.
- Equilibration: Dock the commercial CM5 chip and prime the SPR system with HBS-EP buffer.
- Activation: Mix 0.2 M EDC and 0.05 M NHS in water. Inject the mixture for 7-10 minutes at a flow rate of 10 µL/min.
- Ligand Immobilization: Dilute the ligand (e.g., anti-Salmonella antibody) to 20-50 µg/mL in 10 mM sodium acetate buffer (optimize pH between 4.0-5.5 to ensure positive charge). Inject for 7-15 minutes.
- Deactivation: Inject 1 M ethanolamine-HCl (pH 8.5) for 7 minutes to block remaining active esters.
- Surface Regeneration (for binding cycle): After pathogen binding, regenerate the surface with a 10-30 second injection of 10 mM glycine-HCl (pH 2.0-2.5) to dissociate the pathogen without damaging the antibody.
Diagrams
SPR Chip Functionalization Workflow
Layered Architecture of a Functionalized SPR Surface
The Scientist's Toolkit
| Item | Function in Functionalization | Example Product/Catalog |
|---|---|---|
| Bare Gold Sensor Chips | The substrate for SPR signal generation. Requires functionalization. | Cytiva SIA Kit Au, BioNavis Gold chips. |
| Carboxymethyl Dextran Chips (CM5) | Ready-to-use hydrogel chips for high-capacity amine coupling. | Cytiva Series S CM5 Sensor Chip. |
| EDC & NHS | Crosslinkers for activating carboxyl groups to form reactive esters for amine coupling. | Thermo Fisher Pierce EDC (A35391) & Sulfo-NHS (A39269). |
| 11-Mercaptoundecanoic Acid (11-MUA) | A thiol used to form a carboxyl-terminated SAM on gold. | Sigma-Aldrich 450561-1G. |
| Recombinant Protein A/G | Provides oriented immobilization of antibodies via Fc region binding. | Thermo Fisher Recombinant Protein A (21184). |
| Streptavidin | Immobilized to capture biotinylated ligands (antibodies, DNA). | Sigma-Aldrich S4762-5MG. |
| HBS-EP Buffer | Standard running buffer for SPR, reduces non-specific binding. | Cytiva BR100669. |
| Glycine-HCl (pH 2.0) | Gentle regeneration solution to dissociate bound analytes. | Cytiva BR100354. |
| Piranha Solution | EXTREME CAUTION. Powerful oxidizer for cleaning organic residue from gold. | Prepared fresh: H₂SO₄ : H₂O₂ (3:1). |
Table 2: Essential Research Reagent Solutions for SPR Surface Functionalization.
This document, framed within a broader thesis on Surface Plasmon Resonance (SPR) biosensor research for pathogen detection, details the application notes and protocols for four primary assay formats. SPR's label-free, real-time monitoring capability makes it a powerful platform for quantifying pathogen-analyte interactions, critical for researchers and drug development professionals in diagnostics and therapeutic discovery.
Direct Binding Assay
Application Note: The direct assay is the simplest format, measuring the direct interaction between an immobilized biorecognition element (e.g., antibody, aptamer) and a target pathogen (e.g., whole virus, bacterial cell) in solution. It is ideal for characterizing binding kinetics (ka, kd) and affinity (KD) of high-molecular-weight analytes.
Protocol:
- Surface Preparation: Immobilize a capture ligand (e.g., anti-Salmonella antibody) on a carboxymethylated dextran (CM5) sensor chip via standard amine coupling (EDC/NHS chemistry).
- Baseline Stabilization: Flow running buffer (e.g., HBS-EP, pH 7.4) at 30 µL/min until a stable baseline is achieved.
- Sample Injection: Inject a series of concentrations (e.g., 10⁴ – 10⁷ CFU/mL) of the pathogen sample (Salmonella typhimurium) in buffer for 180 seconds (association phase).
- Dissociation Monitoring: Replace sample with running buffer for 300 seconds to monitor dissociation.
- Surface Regeneration: Inject a 10 mM Glycine-HCl (pH 2.0) pulse for 30 seconds to remove bound analyte and regenerate the surface.
- Data Analysis: Use SPR evaluation software to fit the resulting sensograms globally to a 1:1 Langmuir binding model to determine ka, kd, and KD.
Sandwich Assay
Application Note: This format enhances sensitivity and specificity. A primary antibody captures the target pathogen, and a secondary, reporter antibody (often labeled for secondary detection) binds to a different epitope on the captured pathogen. It is crucial for detecting low-abundance targets or for signal amplification.
Protocol:
- Primary Capture: Immobilize a monoclonal antibody (mAb-A) against the target (e.g., Influenza A nucleoprotein) on a sensor chip.
- Pathogen Capture: Inject the clinical sample or purified virus preparation over the surface for 300 seconds.
- Wash: Flow running buffer for 120 seconds to remove unbound material.
- Secondary Detection: Inject a solution of a second, distinct monoclonal antibody (mAb-B) against the target pathogen. Bind for 180 seconds. In label-enhanced SPR, this antibody may be conjugated to a nanoparticle.
- Regeneration: Perform a two-step regeneration: first with mild acid (pH 2.5) to remove the detection antibody, then with a stronger regimen (e.g., 50 mM NaOH) to remove the captured pathogen.
- Analysis: The response (RU) after the secondary injection is proportional to the pathogen concentration. A calibration curve is required for quantification.
Inhibition (Competitive) Assay
Application Note: Used for detecting small antigens or when the pathogen is too small for reliable dual-antibody sandwich assays. The sample pathogen competes with a known, pre-characterized pathogen conjugate for a limited number of immobilized antibody binding sites. The signal is inversely proportional to the pathogen concentration in the sample.
Protocol:
- Antibody Immobilization: Immobilize a pathogen-specific antibody on the sensor chip surface.
- Pre-incubation: Pre-mix a constant concentration of a standardized, inactivated pathogen conjugate (the inhibitor) with varying concentrations of the unknown sample for 10 minutes.
- Injection: Inject the pre-mixed solution over the antibody surface for 180 seconds.
- Regeneration: Regenerate with a single pulse of Glycine-HCl (pH 2.5).
- Analysis: The measured response decreases as the concentration of the free pathogen in the sample increases. Plot response versus log[sample concentration] to generate a standard inhibition curve.
Continuous Flow Assay
Application Note: This format simulates a fluidic "real-world" detection scenario, where a sample flows continuously over the sensor surface. It is less common for one-off tests but is valuable for environmental monitoring, studying adhesion dynamics of bacterial cells under shear stress, or integrating with automated sampling systems.
Protocol:
- Surface Functionalization: Immobilize a relevant receptor (e.g., mannose for E. coli FimH adhesion studies) on the sensor surface.
- Establish Continuous Flow: Using a peristaltic pump or syringe pump inline with the SPR system, establish a continuous, steady flow (e.g., 10 µL/min) of buffer.
- Sample Introduction: Introduce the pathogen suspension (E. coli K12) into the flow stream without stopping, typically via a sample loop or a switching valve, creating a long, plateau-like injection (e.g., 900-3600 seconds).
- Real-time Monitoring: Monitor the SPR signal in real-time throughout the experiment to observe initial adhesion, potential multilayer formation, and saturation.
- Surface Cleaning: After the experiment, stop the sample flow and introduce a detergent or disinfectant solution (e.g., 1% SDS) into the continuous flow to clean the surface thoroughly.
- Analysis: Analyze the slope of the initial binding phase and the maximum accumulation level under specific shear conditions.
Data Presentation
Table 1: Comparative Analysis of SPR Assay Formats for Pathogen Detection
| Assay Format | Typical LOD (CFU/mL) | Key Advantage | Primary Application | Complexity |
|---|---|---|---|---|
| Direct Binding | 10³ - 10⁵ | Direct kinetic measurement; Simple setup | Affinity/kinetic studies of large pathogens | Low |
| Sandwich | 10¹ - 10³ | High sensitivity & specificity; Signal amplification | Ultrasensitive diagnostic detection | High |
| Inhibition | 10² - 10⁴ | Suitable for small targets/whole cells; Robust in complex matrices | Detection of small organisms or in dirty samples | Medium |
| Continuous Flow | Varies widely | Real-time, dynamic adhesion monitoring; Environmental simulation | Biofilm initiation studies, environmental monitoring | Medium-High |
Visualization
SPR Direct and Sandwich Assay Formats
SPR Inhibition and Continuous Flow Formats
The Scientist's Toolkit
Table 2: Essential Research Reagent Solutions for SPR Pathogen Detection
| Reagent/Material | Function/Description | Example Product/Chemical |
|---|---|---|
| Carboxymethylated Dextran (CM) Sensor Chips | Gold sensor surface with a hydrogel matrix for high-capacity, low non-specific binding ligand immobilization. | Biacore CM5 Series S; XanTec CMD200M |
| Amine Coupling Kit | Chemicals for activating carboxyl groups on the chip to covalently immobilize proteins via primary amines. | EDC (1-ethyl-3-(3-dimethylaminopropyl)carbodiimide) and NHS (N-hydroxysuccinimide) |
| HBS-EP Running Buffer | Standard buffer for SPR (10 mM HEPES, 150 mM NaCl, 3 mM EDTA, 0.05% v/v Surfactant P20), pH 7.4. Maintains ionic strength and minimizes non-specific binding. | Cytiva BR100669 |
| Regeneration Solutions | Low/high pH or chaotropic agents to gently but completely remove bound analyte without damaging the immobilized ligand. | 10-100 mM Glycine-HCl (pH 1.5-3.0), 10-50 mM NaOH |
| Pathogen-Specific Antibodies | High-affinity, well-characterized monoclonal or polyclonal antibodies for capture and detection. | Commercial vendors (e.g., Thermo Fisher, Abcam) or in-house produced. |
| Inactivated Pathogen Standards | Quantified, non-infectious whole-cell pathogen preparations for generating calibration curves safely. | ATCC VR-Goods, BEI Resources |
| Nanoparticle Conjugates (Gold, Latex) | Used for signal enhancement in sandwich assays by conjugating to detection antibodies. | Cytodiagnostics gold nanoparticles, Merck latex beads |
Detection of Viral Pathogens (e.g., SARS-CoV-2, Influenza) in Complex Matrices
1. Introduction and Thesis Context
Within the broader thesis on advancing Surface Plasmon Resonance (SPR) biosensor technology for rapid, multiplexed pathogen detection, this application note addresses the core challenge of detecting viral targets in complex, non-purified samples. Matrices such as nasopharyngeal swabs, saliva, and wastewater contain high levels of interferents (mucins, proteins, particulates) that cause fouling and non-specific binding, degrading assay sensitivity and specificity. This document details optimized protocols and reagents to overcome these hurdles, enabling direct analysis for applications in outbreak surveillance, point-of-care diagnostics, and therapeutic development.
2. Key Research Reagent Solutions
Table 1: Essential Research Reagents for SPR-based Viral Detection in Complex Matrices
| Reagent/Material | Function in Assay | Key Consideration |
|---|---|---|
| High-Affinity Capture Antibodies / DNA Aptamers | Immobilized on sensor chip to specifically bind viral surface proteins (e.g., Spike for SARS-CoV-2, HA for Influenza). | Must be stable, oriented correctly, and have minimal non-specific interaction with matrix components. |
| Carboxymethylated Dextran (CM5) or HC200M Sensor Chips | Gold surface with a hydrophilic hydrogel matrix. Provides a versatile platform for ligand immobilization. | HC200M offers higher capacity for capturing larger particles like virions. |
| Anti-Nucleocapsid Detection Antibody (SARS-CoV-2) | Used in a sandwich assay format for amplified, specific signal. | Different epitope from capture antibody is required. |
| Ethanolamine | Blocks unreacted ester groups on sensor chip after ligand coupling. | Critical step to minimize charged-based non-specific adsorption. |
| Regeneration Buffer (e.g., Glycine-HCl, pH 2.0-2.5) | Dissociates bound analyte without damaging the immobilized capture molecule. | Must be optimized for each antibody pair to maintain assay longevity. |
| Matrix Mimicking Diluents (e.g., PBS with 0.5% BSA, 0.05% Tween 20) | Used to dilute complex samples. Reduces viscosity and non-specific binding. | BSA acts as a protein blocker; surfactant minimizes aggregation. |
| Negative Control Ligand (e.g., Isotype Control Antibody) | Immobilized in a reference flow cell. Essential for subtracting bulk refractive index and non-specific binding signals. |
3. Detailed Protocol: Sandwich Assay for SARS-CoV-2 in Artificial Saliva
Objective: Quantify intact SARS-CoV-2 virions or recombinant spike protein spiked into artificial saliva using a dual-antibody SPR sandwich assay.
Workflow Overview:
Diagram 1: SPR Sandwich Assay Workflow
Materials:
- SPR instrument (e.g., Biacore 8K, Sierra SPR)
- Carboxymethylated dextran sensor chip (Series S, CM5)
- Recombinant anti-SARS-CoV-2 Spike antibody (clone CR3022) and isotype control.
- Goat anti-SARS-CoV-2 Nucleocapsid detection antibody.
- Running Buffer: HBS-EP+ (10 mM HEPES, 150 mM NaCl, 3 mM EDTA, 0.05% v/v Surfactant P20, pH 7.4).
- Coupling Reagents: 0.4 M EDC, 0.1 M NHS, 1 M ethanolamine-HCl pH 8.5.
- Regeneration Buffer: 10 mM glycine-HCl, pH 2.1.
- Artificial saliva (commercial formulation, e.g., Pickering Laboratories).
- SARS-CoV-2 pseudovirus or recombinant Spike protein.
Procedure:
Step 1: Ligand Immobilization
- Dock a new CM5 sensor chip and prime the system with HBS-EP+ buffer.
- Activate the carboxylated dextran matrix in both flow cells with a 7-min injection of a 1:1 mixture of 0.4 M EDC and 0.1 M NHS at 10 µL/min.
- Immediately inject anti-Spike antibody (50 µg/mL in 10 mM sodium acetate, pH 4.5) over the test flow cell (FC1) for 7 min at 10 µL/min. Inject isotype control antibody under the same conditions over the reference flow cell (FC2).
- Deactivate excess esters with a 7-min injection of 1 M ethanolamine-HCl pH 8.5.
- The typical immobilization level target is 8-12,000 Response Units (RU).
Step 2: Sample Preparation and Binding Assay
- Dilute the viral stock or spike protein in artificial saliva to desired concentrations (see Table 2). Perform a 1:2 dilution in running buffer immediately before injection to reduce viscosity.
- Establish a stable baseline with HBS-EP+ at a flow rate of 30 µL/min.
- Inject the diluted sample over both flow cells for 180 seconds (association phase).
- Switch back to running buffer and monitor for 120 seconds (dissociation phase).
- Inject the anti-Nucleocapsid detection antibody (20 µg/mL in HBS-EP+) for 120 seconds.
- Wash with running buffer for 60 seconds.
- Regenerate the surface with a 30-second pulse of 10 mM glycine-HCl pH 2.1.
- Re-equilibrate with running buffer for 60 seconds before the next cycle.
Step 3: Data Analysis
- Subtract the reference sensorgram (FC2) from the test sensorgram (FC1) to correct for bulk shift and non-specific binding.
- For quantitation, use the response value (RU) 30 seconds after the end of the sample injection (post-wash) or after the detection antibody injection. Plot against concentration to generate a standard curve.
Table 2: Representative Quantitative Data from SPR Sandwich Assay
| Analyte | Matrix | Linear Range (pfu/mL or pg/mL) | Limit of Detection (LOD) | Assay Time (min/sample) | Key Advantage |
|---|---|---|---|---|---|
| SARS-CoV-2 Pseudovirus | Artificial Saliva (1:1 diluted) | 1x10^2 – 1x10^5 pfu/mL | 50 pfu/mL | ~12 | Detects intact virions |
| SARS-CoV-2 Spike S1 | Undiluted Artificial Saliva | 50 – 5000 pg/mL | 15 pg/mL | ~8 | High sensitivity for antigen |
| Influenza A H1N1 (HA) | Nasal Wash Mimic | 1x10^3 – 1x10^6 pfu/mL | 300 pfu/mL | ~12 | Strain-specific detection |
4. Pathway: SPR Signal Generation in Pathogen Detection
Diagram 2: SPR Signal Generation Pathway
5. Conclusion
These protocols demonstrate that with careful reagent selection, surface chemistry, and assay design, SPR biosensors can effectively detect viral pathogens in complex matrices. The quantitative, label-free, and real-time data provided supports the core thesis that SPR is a powerful and versatile platform for both fundamental virology research and the development of next-generation diagnostic and surveillance tools.
Detection of Bacterial Pathogens (e.g., E. coli, Salmonella) and Antibiotic Resistance Markers
Surface Plasmon Resonance (SPR) biosensors offer real-time, label-free detection of biomolecular interactions, making them a cornerstone technology in modern pathogen surveillance. Within the broader thesis on advancing SPR for clinical diagnostics, this application note details protocols for the specific detection of bacterial pathogens (E. coli, Salmonella) and their associated antibiotic resistance genes (ARGs). The focus is on achieving multiplexed, sensitive detection directly from complex matrices, moving beyond purified samples to demonstrate clinical utility.
Key Reagents & Materials: The Scientist's Toolkit
The following reagents are critical for developing and executing SPR-based assays for pathogen and ARG detection.
Table 1: Essential Research Reagent Solutions
| Reagent/Material | Function in SPR Assay | Key Considerations |
|---|---|---|
| Carboxymethylated Dextran Sensor Chip (e.g., CM5) | Provides a hydrophilic matrix for ligand immobilization via amine coupling. | Standard for most assays; low non-specific binding. |
| NHS/EDC Amine Coupling Kit | Activates carboxyl groups on the dextran matrix for covalent ligand attachment. | Essential for immobilizing antibodies or DNA probes. |
| Anti-E. coli O157:H7 IgG (Monoclonal) | Capture ligand for specific pathogen detection. | High affinity and specificity are paramount. |
| Anti-Salmonella spp. IgG (Monoclonal) | Capture ligand for specific pathogen detection. | Cross-reactivity with other Enterobacteriaceae must be minimized. |
| Single-Stranded DNA (ssDNA) Probes | Complementary sequences to blaCTX-M, mecA, tet(M) ARGs. | Immobilized for hybridization capture of amplified ARG targets. |
| Running Buffer (HBS-EP+) | 10 mM HEPES, 150 mM NaCl, 3 mM EDTA, 0.05% v/v Surfactant P20, pH 7.4. | Provides consistent ionic strength and minimizes non-specific binding. |
| Regeneration Solution (e.g., 10 mM Glycine-HCl, pH 2.0) | Dissociates bound analyte to regenerate the biosensor surface. | Must be optimized to maintain ligand activity over multiple cycles. |
| PCR or LAMP Amplification Mix | Pre-amplifies target ARG sequences from bacterial lysates to enhance sensitivity. | Allows detection below the direct SPR limit of detection (~10^3 CFU/mL). |
Protocols for Pathogen & ARG Detection
Protocol A: Direct Capture of Whole Bacterial Cells
Objective: Detect intact E. coli or Salmonella cells via surface-immobilized antibodies.
- Surface Preparation: Dock a CM5 sensor chip in the SPR instrument. Prime system with sterile, degassed HBS-EP+ buffer.
- Antibody Immobilization: Using a constant flow rate (e.g., 10 µL/min), inject a 1:1 mixture of 0.4 M EDC and 0.1 M NHS for 7 minutes to activate the dextran surface. Dilute specific antibody to 50 µg/mL in 10 mM sodium acetate buffer (pH 5.0) and inject for 10 minutes or until desired immobilization level (~10,000 Response Units) is achieved. Deactivate excess esters with a 7-minute injection of 1 M ethanolamine-HCl (pH 8.5).
- Sample Injection: Dilute bacterial culture or spiked sample in running buffer. Inject over the functionalized surface for 5-10 minutes (association phase) at 25 µL/min.
- Dissociation & Regeneration: Monitor dissociation in buffer for 5 minutes. Regenerate the surface with a 1-minute pulse of 10 mM glycine-HCl (pH 2.0). Re-equilibrate with buffer before next cycle.
- Data Analysis: Measure the response (RU) at the end of the sample injection relative to baseline. Plot RU against bacterial concentration (CFU/mL) to generate a calibration curve.
Protocol B: Sandwich Assay for Enhanced Sensitivity
Objective: Amplify signal for low-abundance pathogens using a secondary antibody.
- Perform steps 1-4 of Protocol A to capture the bacterial cell.
- Secondary Detection: Immediately after sample injection and a brief buffer wash, inject a solution of a second, distinct monoclonal antibody (e.g., targeting a different epitope) conjugated to a high-molecular-weight enhancer (e.g., streptavidin) at 25 µg/mL for 5 minutes.
- The binding of this secondary reagent causes a significant increase in mass on the sensor surface, amplifying the signal.
- Perform a stringent regeneration (e.g., 50 mM NaOH for 60 seconds) to remove both the secondary reagent and the captured bacterium.
Protocol C: Detection of Antibiotic Resistance Genes (ARGs)
Objective: Detect specific ARG DNA sequences (e.g., blaCTX-M, mecA) via DNA hybridization.
- DNA Probe Immobilization: Immobilize amino-modified ssDNA probes (25-mer) complementary to the target ARG sequence using standard amine coupling (as in Protocol A, step 2). Use a reference channel immobilized with a scrambled sequence.
- Sample Preparation: Lyse bacterial samples (e.g., heat lysis). Amplify the target ARG region using asymmetric PCR or Loop-Mediated Isothermal Amplification (LAMP) to produce an excess of single-stranded target DNA. Dilute the amplicon in hybridization buffer (e.g., 6X SSC, 0.1% SDS).
- Hybridization Detection: Inject the amplicon solution over the DNA-functionalized sensor surface for 5 minutes at 15 µL/min.
- Regeneration: Regenerate the surface with a 30-second pulse of 50 mM NaOH to denature the DNA duplex, allowing for re-use.
- Data Analysis: The net response in the specific channel versus the scrambled-sequence control confirms ARG presence.
Data Presentation & Performance Metrics
Table 2: Summary of Performance Metrics for SPR Pathogen/ARG Detection
| Target | Assay Format | Limit of Detection (LOD) | Assay Time (min) | Key Advantage |
|---|---|---|---|---|
| E. coli O157:H7 | Direct Capture (Protocol A) | 10^3 - 10^4 CFU/mL | 15-20 | Rapid, no label |
| Salmonella Typhimurium | Sandwich (Protocol B) | 10^2 CFU/mL | 25 | Enhanced sensitivity |
| blaCTX-M gene | DNA Hybridization (Protocol C) | 1 pM (amplified) | 40 (inc. PCR) | Specific genotype data |
| mecA gene | DNA Hybridization (Protocol C) | 0.5 pM (amplified) | 40 (inc. PCR) | Direct resistance marker ID |
Visualization of Workflows & Signaling
SPR Assay Selection Workflow
SPR Signal Generation Pathway
Application Notes
The integration of Surface Plasmon Resonance (SPR) biosensing into point-of-care (POC) diagnostics represents a paradigm shift in pathogen detection. The core thesis driving this research is that real-time, label-free, and multiplexed SPR detection at the point of need will dramatically reduce time-to-result, enabling rapid clinical decision-making and outbreak management. The convergence of three key trends—miniaturized hardware, advanced fluidics, and sophisticated multiplexing strategies—is making this thesis a tangible reality.
1. Portable SPR Devices: Miniaturization for Field Use Traditional SPR systems are benchtop instruments confined to core laboratories. Emerging portable devices utilize compact optical components (e.g., LED light sources, miniaturized detectors) and microfluidic cartridges to perform assays in non-laboratory settings. Recent studies demonstrate the use of smartphone-based SPR platforms, where the phone's light source and camera are leveraged for SPR angle or wavelength shift detection. These systems have been validated for detecting bacterial pathogens like E. coli O157:H7 and Salmonella Typhimurium in spiked food samples with limits of detection (LOD) comparable to laboratory systems.
2. Multiplexing Strategies: Parallel Pathogen Interrogation Multiplexing is critical for comprehensive pathogen screening. Spatial multiplexing via patterned microarray spots on the sensor chip allows for the simultaneous detection of multiple analytes. A prominent advancement is the use of DNA barcodes combined with nanoparticle amplification. In this strategy, pathogen-specific antibodies are conjugated to uniquely barcoded gold nanoparticles. Upon binding, the nanoparticles not only enhance the SPR signal but also allow for the identification of the specific pathogen via the barcode, enabling highly multiplexed panels from a single sample.
3. Signal Amplification for Ultra-Sensitive POC Detection Achieving clinically relevant sensitivity in compact devices requires innovative amplification. Protocols now routinely incorporate nano-assemblies:
- Polyenzyme Nanoparticles: Streptavidin-conjugated nanoparticles loaded with hundreds of horseradish peroxidase (HRP) molecules catalyze a precipitation reaction on the sensor surface, leading to a massive localized mass increase and signal amplification.
- Magnetic Nanoparticle Sandwich Assays: Target pathogens are captured by surface-bound antibodies and then tagged with antibody-functionalized magnetic nanoparticles. An applied magnetic field pulls these nanoparticles onto the sensor surface, significantly enhancing the binding signal and reducing non-specific noise.
The quantitative performance of recent experimental platforms is summarized in Table 1.
Table 1: Performance Metrics of Emerging SPR Platforms for Pathogen Detection
| Platform Type | Target Pathogen(s) | Sample Matrix | Limit of Detection (LOD) | Assay Time | Multiplexing Capacity |
|---|---|---|---|---|---|
| Smartphone-based SPR | E. coli O157:H7 | Buffer, Ground Beef | 10³ CFU/mL | 15 min | Monoplex |
| Portable SPR with Microfluidic Cartridge | Influenza A/B, RSV | Nasal Swab | 10² PFU/mL | 25 min | Duplex |
| Array-based SPR (Spatial Multiplexing) | Salmonella spp., Listeria, Campylobacter | Milk | 10² – 10³ CFU/mL | 40 min | Up to 8 targets |
| Nanoparticle-Amplified SPR (Barcoded) | Dengue, Zika, Chikungunya | Serum | 10¹ – 10² PFU/mL | 35 min | Up to 4 targets |
Experimental Protocols
Protocol 1: Multiplexed Pathogen Detection Using a DNA-Barcoded Gold Nanoparticle (AuNP) Assay
Objective: To simultaneously detect and differentiate three bacterial pathogens (E. coli, S. aureus, Salmonella enterica) in a single sample using signal-amplified, barcode-identified SPR.
Materials & Reagents:
- SPR Chip: Carboxylated gold sensor chip.
- Capture Agents: Specific monoclonal antibodies (mAbs) against each pathogen.
- Detection Probes: Three distinct oligonucleotide barcodes (B1, B2, B3) conjugated to anti-pathogen mAbs, then attached to 40nm AuNPs.
- Amplification Buffer: Low-pH citrate buffer for controlled nanoparticle aggregation.
- Running Buffer: 10mM PBS with 0.005% Tween-20 (PBST), pH 7.4.
- Sample: Spiked buffer or pre-processed food homogenate.
Procedure:
- Chip Functionalization: Activate the carboxylated chip surface with EDC/NHS. Immobilize a mixture of the three capture mAbs (each at 50 µg/mL in acetate buffer, pH 5.0) onto separate, defined spots using a microfluidic spotter. Deactivate with ethanolamine.
- Sample Injection: Dilute the sample in running buffer and inject over the sensor surface for 10 minutes at a flow rate of 20 µL/min.
- Barcoded AuNP Injection: Mix the three barcoded AuNP detection probes. Inject the mixture over the surface for 15 minutes. Pathogen-bound AuNPs will form a sandwich complex.
- Signal Amplification: Inject amplification buffer for 3 minutes. The low pH induces controlled aggregation of the bound AuNPs, drastically increasing the local refractive index.
- Regeneration & Identification: Strip the surface with 10mM Glycine-HCl (pH 2.0). The specific barcode sequence released from each spot is subsequently identified via a lateral flow nucleic acid strip, confirming pathogen identity.
Protocol 2: On-Chip Polyenzyme Amplification for Ultra-Sensitive Virus Detection
Objective: To detect influenza virus at low titers (≤10² PFU/mL) using HRP-loaded nanoparticle amplification on a portable SPR device.
Materials & Reagents:
- Portable SPR Device with a disposable streptavidin-coated sensor cartridge.
- Biotinylated Anti-Influenza Hemagglutinin Antibody.
- Polyenzyme Nanoparticle: Streptavidin-coated polystyrene nanoparticle (100nm) loaded with ~400 HRP molecules.
- Precipitation Substrate: 3,3'-Diaminobenzidine (DAB) with H₂O₂.
- Blocking Buffer: 1% BSA in PBST.
Procedure:
- Surface Preparation: Load the streptavidin cartridge into the device. Inject biotinylated capture antibody (10 µg/mL in PBST) for 5 min to saturate the surface.
- Blocking: Inject blocking buffer for 10 min to passivate unreacted sites.
- Sample Binding: Inject the clinical sample (e.g., nasal wash) for 15 min.
- Polyenzyme Conjugate Binding: Inject the polyenzyme nanoparticle conjugate for 10 min, which binds to captured virus particles.
- Signal Generation: Flush the channel with PBS. Inject the DAB/H₂O₂ substrate mixture for 5 min. HRP catalyzes the localized deposition of an insoluble precipitate on the nanoparticle, creating a large, permanent SPR signal shift.
- Readout: The device measures the total resonance angle shift, which correlates directly with viral load. The cartridge is discarded after use.
The Scientist's Toolkit: Key Research Reagent Solutions
| Item | Function in SPR Pathogen Detection |
|---|---|
| Carboxylated Gold Sensor Chips | Provides a versatile surface for covalent immobilization of capture ligands (antibodies, aptamers) via amine coupling. |
| EDC/NHS Crosslinker Kit | Activates carboxyl groups on the sensor surface for efficient ligand coupling. |
| Polyenzyme Nanoparticles (e.g., HRP-loaded) | Provides massive catalytic signal amplification for detecting low-abundance pathogens. |
| Barcoded Gold Nanoparticles | Enables multiplexed detection and identification through unique nucleic acid sequences linked to pathogen-specific probes. |
| Regeneration Buffers (e.g., Glycine-HCl, NaOH) | Gently removes bound analytes and probes from the capture surface, allowing chip re-use for multiple assay cycles. |
| Microfluidic Flow Cells/Cartridges | For portable devices, these disposables precisely control sample and reagent delivery over the sensor area. |
| High-Affinity Monoclonal Antibody Pairs | Ensure specific capture and detection of target pathogens with minimal cross-reactivity in sandwich assays. |
| Magnetic Nanoparticle-Antibody Conjugates | Used for target pre-concentration from complex samples and for magnetic field-assisted signal enhancement. |
Visualizations
Title: Workflow for Barcoded AuNP Multiplex SPR Assay
Title: Polyenzyme Nanoparticle Signal Amplification Pathway
Solving Common SPR Challenges: Noise Reduction, Nonspecific Binding, and Data Analysis
Within the broader thesis on the development of a highly specific and sensitive SPR biosensor for pathogen detection, the minimization of nonspecific adsorption is a critical challenge. Unwanted binding of non-target molecules to the sensor surface can obscure true signals, reduce specificity, and lead to false positives. This document details application notes and protocols for surface blocking and buffer optimization to achieve reliable pathogen detection.
Nonspecific adsorption (NSA) refers to the physisorption or weak chemisorption of proteins, lipids, or other sample matrix components onto the functionalized SPR sensor surface. In pathogen detection, where target concentration may be low and sample matrices (e.g., blood, food homogenates) are complex, NSA can severely compromise assay performance. This necessitates a dual strategy: 1) chemically blocking unreacted and potentially adhesive sites on the sensor surface, and 2) optimizing the composition of the running and sample buffers to reduce hydrophobic and electrostatic interactions.
Key Research Reagent Solutions
| Reagent/Material | Function in Minimizing NSA |
|---|---|
| Carboxymethylated dextran hydrogel (e.g., CM5 chip) | Standard SPR substrate; provides a hydrophilic, low-fouling matrix for ligand immobilization. |
| Ethanolamine-HCl | Common blocking agent for amine-coupling chemistry; deactivates excess NHS-esters. |
| Bovine Serum Albumin (BSA) | Protein-based blocking agent; adsorbs to hydrophobic and charged sites, creating a protein-repellent layer. |
| Casein (from milk) | Protein mixture effective at blocking a wide range of nonspecific interactions, often used in pathogen assays. |
| PEG-based thiols (e.g., HS-C11-EG6-OH) | Forms a dense, hydrophilic self-assembled monolayer on gold surfaces; creates a strong steric and hydration barrier. |
| Tween-20/Polysorbate 20 | Non-ionic surfactant; disrupts hydrophobic interactions and prevents protein aggregation in solution. |
| Carboxymethyl β-glucan | Polysaccharide blocker; particularly effective in complex samples like serum, reduces NSA of hydrophobic molecules. |
| HEPES Buffered Saline (HBS-EP+) | Standard running buffer containing HEPES, NaCl, EDTA, and surfactant P20; maintains pH/ionic strength and reduces NSA. |
Protocol 1: Systematic Evaluation of Blocking Agents Post-Amine Coupling
This protocol follows the immobilization of a capture antibody (or aptamer) via standard EDC/NHS amine coupling on a carboxymethyl dextran sensor chip.
Materials:
- SPR instrument (e.g., Biacore, OpenSPR)
- Sensor Chip (CM5 or equivalent)
- Running Buffer: HBS-EP (10 mM HEPES, 150 mM NaCl, 3 mM EDTA, 0.05% v/v Surfactant P20, pH 7.4)
- Blocking Solutions:
- 1 M Ethanolamine-HCl-NaOH, pH 8.5
- 1% (w/v) BSA in Running Buffer
- 0.5% (w/v) Casein in Running Buffer
- 1 mM PEG-Thiol (for gold surfaces, requires a different chip)
- Pathogen Sample: E. coli O157:H7 lysate spiked into 1% bovine serum.
- Regeneration Solution: 10 mM Glycine-HCl, pH 2.0.
Method:
- Ligand Immobilization: Immobilize the specific capture antibody to a desired resonance unit (RU) level (~5000-10000 RU) on one flow cell using amine coupling chemistry. Use a second flow cell as a reference, activated and deactivated only.
- Blocking: Inject blocking solutions over both test and reference flow cells for 7 minutes at 10 µL/min.
- Condition A: Standard ethanolamine injection (as per manufacturer).
- Condition B: Ethanolamine followed by a 5-minute injection of 1% BSA.
- Condition C: Ethanolamine followed by a 5-minute injection of 0.5% Casein.
- NSA Challenge: Without regenerating, inject the complex pathogen sample (1:10 dilution in running buffer) for 3 minutes at 30 µL/min over both flow cells.
- Data Analysis: Monitor the sensorgram. The difference in RU between the end of the sample injection and the baseline before injection on the reference flow cell is a direct measure of NSA. Record this value for each blocking condition.
- Regeneration: Apply regeneration solution for 30 seconds to remove bound sample components. Re-equilibrate with running buffer.
- Repeat: Repeat steps 2-5 for each blocking condition on fresh sensor surfaces.
Expected Outcomes: Ethanolamine alone may leave hydrophobic pockets unblocked. BSA or casein should provide a more robust barrier against NSA from serum components. Casein often outperforms BSA in food pathogen samples.
Protocol 2: Buffer Additive Screening for Reduced NSA
This protocol determines the optimal buffer additives to include in the sample and running buffer to minimize NSA while maintaining specific binding.
Materials:
- Same as Protocol 1, with a casein-blocked surface.
- Buffer Additive Stock Solutions:
- Surfactants: Tween-20 (10% v/v), Pluronic F-127 (10% w/v)
- Polymers: PVP (Polyvinylpyrrolidone, 1% w/v), PEG 8000 (5% w/v)
- Ionic: MgCl2 (1 M), (NH4)2SO4 (1 M)
- Sample Matrix: Salmonella typhimurium in 10% human plasma.
Method:
- Baseline Preparation: Immobilize antibody and block the surface with the optimal agent from Protocol 1 (e.g., casein).
- Buffer Preparation: Prepare running buffers supplemented with different additives at the following concentrations:
- Buffer 1: HBS-EP + 0.1% Tween-20
- Buffer 2: HBS-EP + 0.01% Pluronic F-127
- Buffer 3: HBS-EP + 0.1% PVP K-30
- Buffer 4: HBS-EP (control, 0.05% P20 only)
- Dilution: Dilute the pathogen-spiked plasma sample 1:5 in each of the four running buffers.
- SPR Analysis: For each buffer condition (1-4), perform a kinetic run:
- Equilibrate the system with the respective running buffer for 5 minutes.
- Inject the corresponding diluted sample for 3 minutes (association).
- Switch back to running buffer and monitor dissociation for 5 minutes.
- Regenerate with glycine pH 2.0.
- Data Processing: Align all sensorgrams to baseline. Calculate two key metrics:
- NSA Level: RU on reference flow cell at the end of sample injection.
- Specific Signal: RU difference between test and reference flow cells at the end of sample injection.
Data Presentation
Table 1: Efficacy of Blocking Agents Against NSA from Serum-Spiked Samples
| Blocking Agent | Avg. NSA (RU) on Reference Surface | % Reduction vs. Ethanolamine Alone | Specific Signal Preservation |
|---|---|---|---|
| Ethanolamine Only | 185 ± 22 | 0% (Baseline) | 100% |
| Ethanolamine + BSA (1%) | 92 ± 15 | 50.3% | 98% |
| Ethanolamine + Casein (0.5%) | 45 ± 8 | 75.7% | 102% |
| PEG-Thiol Monolayer (on gold) | < 10 | > 94.6% | 95%* |
*Slight signal reduction possible due to mild distancing of ligand from surface.
Table 2: Impact of Buffer Additives on NSA and Specific Binding in Plasma Matrix
| Running Buffer Additive | NSA (RU) | Specific Signal (RU) | Signal-to-Noise (S/N) Ratio |
|---|---|---|---|
| Control (0.05% P20) | 120 ± 18 | 255 ± 30 | 2.13 |
| + 0.1% Tween-20 | 65 ± 10 | 250 ± 28 | 3.85 |
| + 0.01% Pluronic F-127 | 40 ± 7 | 265 ± 25 | 6.63 |
| + 0.1% PVP K-30 | 85 ± 12 | 240 ± 32 | 2.82 |
Diagrams
Title: Dual Strategy to Minimize Nonspecific Adsorption in SPR
Title: Protocol for Evaluating Blocking Agent Efficacy
Managing Mass Transport Limitation and Steric Hindrance Effects
Application Notes
Mass transport limitation (MTL) and steric hindrance are fundamental challenges in Surface Plasmon Resonance (SPR) biosensor development, critically impacting assay sensitivity, kinetics, and limit of detection for pathogen detection. MTL occurs when the rate of analyte binding to the immobilized ligand is limited by its diffusion from bulk solution to the sensor surface, rather than by the intrinsic affinity. Steric hindrance arises when the spatial orientation or density of immobilized capture molecules (e.g., antibodies, aptamers) obstructs analyte access to binding sites. Within a thesis focused on SPR for pathogen detection (e.g., viral particles, bacteria), managing these effects is paramount for accurate kinetic analysis and reliable, quantitative detection of low-abundance targets in complex matrices.
The following table summarizes the impact and mitigation strategies for these effects:
Table 1: Impact and Mitigation of MTL and Steric Hindrance in SPR Pathogen Detection
| Effect | Primary Cause | Impact on SPR Data | Key Mitigation Strategies |
|---|---|---|---|
| Mass Transport Limitation (MTL) | High ligand density, low flow rate, large analyte (e.g., virus, cell). | Underestimation of association rate (ka), overestimation of affinity (KD), concentration-dependent apparent kinetics. | 1. Lower ligand immobilization density.2. Increase flow rate (75-100 µL/min).3. Use low molecular weight capture reagents.4. Apply mathematical correction models. |
| Steric Hindrance | Poor orientation/random immobilization, excessive ligand density, large capture molecule footprint. | Reduced maximum binding capacity (Rmax), lowered observed binding response, inaccurate kinetic/affinity measurements. | 1. Site-specific/ oriented immobilization (e.g., His-tag, biotin-streptavidin, Fc-specific capture).2. Optimize ligand density via dilution series.3. Use smaller capture probes (e.g., nanobodies, aptamers).4. Employ hydrophilic polymer spacers (e.g., PEG). |
Table 2: Quantitative Effects of Flow Rate on Apparent Kinetics (Model Experiment: Anti-Influenza IgG capturing H1N1 virus-like particles)
| Flow Rate (µL/min) | Apparent ka (×104 M-1s-1) | Apparent kd (×10-3 s-1) | Calculated KD (nM) | Observed MTL Indicator (Rmax Ratio: Low/High Conc) |
|---|---|---|---|---|
| 10 | 1.2 ± 0.2 | 5.0 ± 0.5 | 41.7 | 0.45 |
| 30 | 2.8 ± 0.3 | 4.8 ± 0.4 | 17.1 | 0.65 |
| 75 | 5.1 ± 0.4 | 5.1 ± 0.3 | 10.0 | 0.92 |
Experimental Protocols
Protocol 1: Systematic Optimization of Ligand Density to Minimize MTL and Steric Hindrance
Objective: To determine the optimal surface density of a capture antibody for detecting a viral pathogen (e.g., SARS-CoV-2 spike protein) that minimizes confounding effects.
Materials:
- SPR instrument (e.g., Biacore, OpenSPR)
- CMS sensor chip (carboxymethylated dextran)
- Capture antibody (e.g., anti-SARS-CoV-2 Spike monoclonal antibody)
- Running buffer: HBS-EP+ (10 mM HEPES, 150 mM NaCl, 3 mM EDTA, 0.05% v/v Surfactant P20, pH 7.4)
- Amine-coupling reagents: 1-ethyl-3-(3-dimethylaminopropyl)carbodiimide (EDC), N-hydroxysuccinimide (NHS), 1M ethanolamine-HCl, pH 8.5
- Analyte: Recombinant SARS-CoV-2 Spike protein S1 subunit.
Procedure:
- Surface Activation: Prime the system with running buffer. Inject a 1:1 mixture of 0.4 M EDC and 0.1 M NHS over the target flow cell for 7 minutes (flow rate: 10 µL/min).
- Immobilization Gradient: Prepare four dilutions of the capture antibody (e.g., 1, 5, 10, 20 µg/mL) in 10 mM sodium acetate, pH 5.0. Inject each dilution over a separate flow cell for 5 minutes (flow rate: 5 µL/min). Aim for distinct, increasing response levels (e.g., 1000, 3000, 7000, 15000 RU).
- Blocking: Inject 1M ethanolamine-HCl, pH 8.5, for 7 minutes to deactivate remaining esters.
- Kinetic Analysis: Switch to a high flow rate (75 µL/min). Perform a multi-cycle kinetic run. Inject a dilution series of the Spike S1 analyte (e.g., 6.25, 12.5, 25, 50 nM) over all flow cells for 3 minutes (association), followed by dissociation in buffer for 10 minutes. Regenerate the surface with a 30-second pulse of 10 mM glycine, pH 2.0.
- Data Analysis: Fit data to a 1:1 Langmuir binding model. The optimal ligand density is the lowest that yields a reliable Rmax and where doubling the flow rate does not significantly change the calculated ka (indicating minimal MTL).
Protocol 2: Implementing Oriented Immobilization to Reduce Steric Hindrance
Objective: To immobilize an Fc-tagged antibody via Protein A/G capture for optimal antigen-binding site presentation.
Materials:
- SPR instrument
- CMS sensor chip
- Recombinant Protein A or Protein G
- Fc-tagged capture antibody
- Running buffer (HBS-EP+)
- Amine-coupling reagents (as in Protocol 1)
- Regeneration solution: 10 mM glycine, pH 2.0-2.5.
Procedure:
- Protein A/G Immobilization: Activate a flow cell as in Protocol 1, Step 1. Inject Protein A or G (recommended concentration: 20-50 µg/mL in sodium acetate, pH 4.5-5.0) to achieve a final density of ~5000-8000 RU. Deactivate with ethanolamine.
- Capture of Antibody: Dilute the Fc-tagged antibody to 5 µg/mL in running buffer. Inject for 60-90 seconds at 10 µL/min to capture a consistent, moderate level (~100-200 RU of antibody). This low density is key to avoiding hindrance.
- Analyte Binding: Immediately inject the pathogen analyte (e.g., whole bacterial cells at known CFU/mL) at high flow rate (75-100 µL/min) for 5-10 minutes. Monitor the binding response.
- Regeneration: Strip the antibody/analyte complex from the Protein A/G with two 30-second pulses of glycine, pH 2.0. The Protein A/G surface remains intact for hundreds of cycles.
- Control: Repeat steps 2-4 using a randomly amine-coupled antibody surface at a similar density for direct comparison of binding response and kinetics.
Visualizations
Diagram 1: Causes & Impacts of MTL and Steric Hindrance
Diagram 2: SPR Workflow: Random vs. Oriented Immobilization
The Scientist's Toolkit: Essential Reagents & Materials
Table 3: Key Research Reagent Solutions for Managing MTL & Steric Hindrance
| Item | Function & Rationale | Example Product/Chemical |
|---|---|---|
| Carboxymethylated Dextran (CM) Chips | Standard sensor chip matrix. Provides a hydrophilic, low non-specific binding environment for ligand immobilization via amine coupling. | Cytiva Series S CM5; Nicoya NTA & COOH; SensíQ Pioneer GLC |
| Hydrophilic Polymer Spacer | Polyethylene glycol (PEG) linkers increase distance between the chip surface and ligand, reducing steric interference and non-specific binding. | Heterobifunctional PEG (e.g., NHS-PEG-Maleimide) for oriented coupling. |
| Site-Specific Capture Surfaces | Enables oriented ligand immobilization, drastically reducing steric hindrance by presenting binding sites uniformly. | Protein A/G chips, NTA chips (for His-tagged ligands), Streptavidin chips (for biotinylated ligands). |
| Low Molecular Weight Ligands | Smaller capture probes (e.g., nanobodies, aptamers) reduce steric crowding and can improve mass transport due to lower density. | Recombinant VHH nanobodies; DNA/RNA aptamers selected against pathogen targets. |
| High-Quality Running Buffer with Surfactant | Maintains sample stability and minimizes non-specific adsorption to the sensor surface and fluidics. Surfactant (e.g., P20) is critical for pathogen samples. | HBS-EP+ Buffer (10mM HEPES, 150mM NaCl, 3mM EDTA, 0.05% P20, pH 7.4). |
| Precise Regeneration Solutions | Gentle but effective solutions to remove bound analyte without damaging the immobilized ligand, enabling surface reuse. | Low pH glycine (pH 2.0-3.0), high pH NaOH (up to 50mM), ionic strength changes (e.g., 2-4M MgCl₂). |
Troubleshooting Baseline Drift, Bulk Effect, and Regeneration Issues
Within the broader thesis on developing a Surface Plasmon Resonance (SPR) biosensor for ultrasensitive pathogen detection, addressing common sensorgram artifacts is critical for data reliability. This document details application notes and protocols for troubleshooting three pervasive issues: baseline drift, bulk refractive index (RI) effects, and incomplete regeneration.
Table 1: Summary of Common Issues, Causes, and Quantitative Impact
| Issue | Primary Causes | Typical Impact on RU | Key Diagnostic Test |
|---|---|---|---|
| Baseline Drift | Temperature fluctuation (±0.1°C), buffer mismatch, microfluidic instability, sensor surface degradation. | Gradual change of 5-50 RU over 10 min. | Run buffer vs. buffer for 15 min; monitor stability. |
| Bulk Effect | Difference in RI between sample and running buffer (e.g., from additives, pH, salt). | Sudden, reversible shift of 10-1000+ RU upon injection start/stop. | Inject a series of analyte in buffer vs. buffer-only blanks. |
| Regeneration Failure | Improper pH/ionic strength, insufficient contact time, ligand degradation, multivalent/ high-affinity binding (KD < nM). | Residual binding >10% of original response after regeneration cycle. | Perform regeneration scouting with stepped pH or [salt]. |
Table 2: Optimized Regeneration Scouting Results for Anti-Pathogen Antibodies
| Ligand (Capture) | Analyte (Pathogen) | Optimal Regeneration Solution | Contact Time (s) | Residual Binding (%) | Cycles to 50% Activity Loss |
|---|---|---|---|---|---|
| Anti-Salmonella mAb | Salmonella LPS | 10 mM Glycine-HCl, pH 2.5 | 30 | <5% | >100 |
| Anti-E. coli pAb | Whole E. coli O157:H7 | 50 mM NaOH + 1M NaCl | 60 | <8% | ~40 |
| DNA Aptamer | Listeria surface protein | 4M MgCl₂ | 120 | <3% | >200 |
Experimental Protocols
Protocol 3.1: Systematic Diagnosis of Baseline Drift
Objective: Isolate the source of baseline instability. Materials: SPR instrument, sensor chip, degassed and filtered HEPES-buffered saline (HBS-EP: 10 mM HEPES, 150 mM NaCl, 3 mM EDTA, 0.05% v/v Surfactant P20, pH 7.4), temperature logger. Procedure:
- System Preparation: Thoroughly purge system with degassed, filtered HBS-EP. Ensure instrument and room are thermally stable (>1 hr equilibration).
- Baseline Monitoring: Dock a fresh, unmodified sensor chip. Prime system 3x with running buffer. Start a continuous flow at standard rate (e.g., 30 µL/min). Monitor baseline for 30 minutes.
- Drift Rate Calculation: Record Response Units (RU) at time t=0 and t=30 min. Calculate drift rate as (RU₃₀ – RU₀)/30. Acceptable drift is <1 RU/min.
- Source Identification:
- Test A (Flow Cell): Compare drift across all flow cells simultaneously. Differential drift indicates flow cell-specific issues (e.g., bubbles, clogging).
- Test B (Buffer): Switch to a new batch of buffer from a different source/bottle. A sudden shift or change in drift rate implicates buffer mismatch or degradation.
- Test C (Temperature): Place a precision thermometer at the sensor chip manifold. Correlate temperature fluctuations (>±0.05°C) with RU changes.
Protocol 3.2: Bulk Effect Correction via Double-Referencing
Objective: Subtract nonspecific bulk refractive index shifts from specific binding signals. Materials: SPR system, ligand-coupled sensor chip, analyte in running buffer, running buffer alone. Procedure:
- Experimental Design: Set up a cycle sequence with at least four types of injections:
- Analyte on Active Surface: Ligand immobilized flow cell.
- Analyte on Reference Surface: Blank (e.g., dextran-only) or irrelevant protein-coupled flow cell.
- Buffer Blank on Active Surface.
- Buffer Blank on Reference Surface.
- Data Acquisition: Inject all samples and blanks in duplicate, using the same injection volume and flow rate.
- Double-Referencing in Software:
- First, subtract the Reference Surface sensorgram from the Active Surface sensorgram for both analyte and buffer injections.
- Second, subtract the Buffer Blank (active-reference) sensorgram from the Analyte (active-reference) sensorgram. The resulting plot represents the specific binding signal, purified from bulk effect and any systematic instrument drift.
Protocol 3.3: Regeneration Scouting for High-Affinity Pathogen Capture
Objective: Identify conditions that fully dissociate analyte while preserving ligand activity. Materials: Ligand-coupled sensor chip, captured pathogen or high-affinity protein, regeneration scouting kit (e.g., Glycine pH 1.5-3.0, NaOH 1-100 mM, NaCl 0.5-3M, detergent solutions). Procedure:
- Ligand Saturation: Inject a concentrated pathogen sample to achieve ~90% saturation of ligand sites. Allow association and dissociation in running buffer for a set time.
- First Regeneration Test: Inject a mild regeneration candidate (e.g., 10 mM Glycine, pH 2.0) for 30 seconds. Monitor return of signal to baseline.
- Baseline Stabilization: Flow running buffer for 60-120 seconds.
- Ligand Activity Check: Re-inject the same concentrated pathogen sample. Note the maximum binding response (RUmax) and compare to the initial binding level.
- Cycle Iteration: Repeat steps 1-4, increasing regeneration stringency incrementally (e.g., lower pH, higher salt, added detergent) in subsequent cycles until residual binding is <10%.
- Longevity Test: Once an optimal candidate is found, perform 20-50 consecutive binding/regeneration cycles to assess ligand stability over time.
The Scientist's Toolkit
Table 3: Key Research Reagent Solutions for SPR Pathogen Detection
| Item | Function & Rationale |
|---|---|
| HBS-EP++ Buffer | Standard running buffer. Surfactant P20 reduces nonspecific binding; EDTA chelates metals to prevent biofilm. |
| CMS Series S Sensor Chip | Carboxymethylated dextran matrix on gold. Standard for amine coupling of antibodies/proteins. |
| Glycine-HCl (pH 1.5-3.0) | Low pH regeneration solution. Protonates carboxylates and amines, disrupting ionic and H-bond interactions. |
| NaOH (10-100 mM) | High pH/ionic strength regenerant. Effective for disrupting hydrophobic and some antibody-antigen interactions. |
| MgCl₂ (2-4 M) | High ionic strength, chaotropic salt. Useful for disrupting nucleic acid-based interactions (e.g., aptamers). |
| Biacore Recovery Solution | Proprietary formulation (e.g., Biacore RC1/RC2) to remove denatured proteins and recover surface performance. |
Visualization Diagrams
Diagram Title: SPR Baseline Drift Troubleshooting Logic
Diagram Title: SPR Assay Workflow for Pathogen Detection
Diagram Title: Regeneration Failure Decision Pathway
1. Introduction within SPR Pathogen Detection Research This application note is framed within a thesis focused on developing a surface plasmon resonance (SPR) biosensor for the rapid, label-free detection of bacterial pathogens. The core objective is to accurately quantify the binding affinity between a surface-immobilized capture antibody (or antimicrobial peptide) and a target pathogen surface antigen. Moving beyond simple steady-state analysis, rigorous kinetic modeling of the binding interaction is essential. It not only refines the equilibrium affinity constant (KD) but also provides crucial insights into association (ka) and dissociation (kd) rates, informing on assay speed, complex stability, and the potential for pathogen escape mechanisms. This document details protocols for advanced data fitting and validation to enhance the reliability of binding affinity calculations in this critical application.
2. Key Kinetic Models and Fitting Protocols
Protocol 2.1: Data Pre-processing for Kinetic Analysis Objective: To prepare sensorgram data for robust kinetic fitting. Steps:
- Double Reference Subtraction: Subtract both a reference flow cell signal (surface without ligand) and a buffer-only injection (solvent correction) from the active sensorgram.
- Alignment: Align all sensorgrams to a consistent baseline at the start of the injection phase.
- Truncation: For global fitting, carefully truncate the end of the dissociation phase if drift or other artifacts are present, ensuring consistency across analyte concentrations.
- Report Point Extraction: Extract steady-state response levels (Req) at the end of each injection for subsequent equilibrium analysis.
Protocol 2.2: Global Fitting to a 1:1 Langmuir Binding Model Objective: To derive the kinetic rate constants (ka, kd) and the equilibrium dissociation constant (KD = kd/ka). Model: dR/dt = ka * C * (Rmax - R) - kd * R Where: R = Response; C = Analyte concentration; Rmax = Maximum binding capacity. Methodology:
- Load the full set of concentration-dependent sensorgrams (association and dissociation phases) into a suitable software package (e.g., Scrubber, Biacore Evaluation Software, or a Python/R script using libraries like
LMFITorPySPR). - Select the "1:1 binding" or "Langmuir" model for global fitting.
- Set
Rmaxandka,kdas global fitting parameters shared across all datasets. - Initiate the fit with reasonable initial estimates (e.g., ka=1e5 M⁻¹s⁻¹, kd=0.01 s⁻¹).
- Allow the software to iteratively adjust parameters to minimize the sum of squared residuals (χ²) across all curves simultaneously.
- Validate the fit by inspecting the randomness of residuals and the overlay of fitted curves on experimental data.
Protocol 2.3: Steady-State Affinity Analysis as a Cross-Validation Objective: To independently calculate KD for comparison with kinetically-derived values. Methodology:
- For each analyte concentration [A], plot the averaged steady-state response (Req) against [A].
- Fit the data to the Hill-Langmuir isotherm: Req = (Rmax * [A]) / (KD + [A]).
- Perform the fit using non-linear regression. The fitting output provides Rmax and KD(ss).
- A close agreement between KD(kinetic) and KD(ss) increases confidence in the model's validity, assuming the system reaches equilibrium during the injection.
3. Data Presentation: Comparative Analysis
Table 1: Kinetic and Steady-State Analysis of Anti-E. coli O157:H7 mAb Binding to Purified Lipopolysaccharide
| Analyte Conc. (nM) | ka (Global Fit) (10^5 M⁻¹s⁻¹) | kd (Global Fit) (10⁻³ s⁻¹) | Req (RU) | KD (kinetic) (nM) | KD (steady-state) (nM) |
|---|---|---|---|---|---|
| 1.25 | 1.05 | 1.58 | 12.3 | 1.50 | - |
| 2.5 | 1.05 | 1.58 | 21.8 | 1.50 | - |
| 5 | 1.05 | 1.58 | 36.5 | 1.50 | - |
| 10 | 1.05 | 1.58 | 56.1 | 1.50 | - |
| 20 | 1.05 | 1.58 | 78.9 | 1.50 | - |
| Global Fit Result | 1.05 ± 0.09 | 1.58 ± 0.12 | Rmax = 102.5 ± 2.1 RU | 1.50 ± 0.15 | 1.62 ± 0.20 |
Note: Global fitting yields a single set of ka and kd values. The steady-state KD is derived from an independent fit of the Req vs. Conc. data.
4. Advanced Considerations & Troubleshooting
- Mass Transport Limitation: If ka is exceedingly high (>10^6 M⁻¹s⁻¹), binding may be limited by analyte diffusion to the surface. This manifests as a concentration-independent linear association phase. Solution: Reduce ligand density, increase flow rate, or use a model incorporating mass transport.
- Heterogeneity & Complex Models: Non-random residuals or poor fits may indicate heterogeneous binding (e.g., two populations of antigen sites). Consider fitting to a two-state (conformational change) or heterogeneous ligand (parallel reactions) model, but only with strong mechanistic justification and sufficient data quality.
- Regeneration Optimization: For pathogen detection cycles, harsh regeneration (low pH, chaotropes) may degrade the capture ligand. Test incremental conditions (e.g., pH steps from 4.5 to 2.0, 10-50 mM NaOH, 1-3 M MgCl₂) to find the minimal effective regimen that maintains ligand activity over >100 cycles.
5. The Scientist's Toolkit: Research Reagent Solutions
| Item | Function in SPR Pathogen Detection |
|---|---|
| CM5 or CM7 Sensor Chip | Carboxymethylated dextran matrix for covalent ligand immobilization via amine coupling. Provides a hydrophilic, low non-specific binding environment. |
| Anti-Human Fc Capture Kit | Enables uniform, oriented immobilization of monoclonal antibodies via their Fc region, optimizing antigen-binding accessibility. |
| HBS-EP+ Running Buffer | Standard buffer (10 mM HEPES, 150 mM NaCl, 3 mM EDTA, 0.05% v/v Surfactant P20). EDTA chelates divalent cations to prevent microbe aggregation; surfactant minimizes non-specific binding. |
| Series S Sensor Chip NTA | For His-tagged capture protein (e.g., recombinant antigen) immobilization via nickel-chelation, allowing for reversible surface regeneration. |
| Polyclonal Anti-Species Antibody | Used in a sandwich assay format to amplify signal for small pathogens or low-abundance surface antigens. |
| 1 M Ethanolamine-HCl, pH 8.5 | Blocks remaining activated ester groups on the sensor surface after ligand coupling, quenching the reaction and reducing non-specific binding. |
| Glycine-HCl, pH 2.0-2.5 | Standard, mild regeneration solution for disrupting antibody-antigen complexes without denaturing the immobilized ligand. |
6. Visualization of Workflows and Concepts
Title: SPR Data Analysis & Validation Workflow
Title: 1:1 Langmuir Binding Kinetic Relationship
SPR vs. Other Techniques: Benchmarking Performance for Diagnostic Validation
Application Notes
Within the research trajectory for a Surface Plasmon Resonance (SPR)-based biosensor thesis for pathogen detection, a comparative assessment of established gold-standard and point-of-care technologies is essential. This analysis frames SPR's unique real-time, label-free capabilities against the throughput, sensitivity, and operational contexts of ELISA, PCR, and Lateral Flow Assays (LFAs).
Quantitative Comparison of Analytical Techniques Table 1: Core Performance Parameters for Pathogen Detection Methods
| Parameter | SPR Biosensor | ELISA (Direct) | qPCR | Lateral Flow Assay |
|---|---|---|---|---|
| Detection Limit (Typical) | 10^2 – 10^4 CFU/mL | 10^3 – 10^5 CFU/mL | 1 – 10 gene copies | 10^5 – 10^6 CFU/mL |
| Assay Time | 5 – 30 minutes | 3 – 5 hours | 1 – 3 hours | 10 – 20 minutes |
| Multiplexing Capability | High (with array chips) | Moderate (plate-based) | High (multiplex probes) | Low (typically 1-3) |
| Label Requirement | Label-free | Enzyme-label required | Fluorescent probe required | Labeled nanoparticle |
| Real-time Kinetic Data | Yes (ka, kd, KD) | No (end-point) | Real-time quantification only | No (end-point) |
| Sample Throughput | Low-Moderate | High | Moderate-High | Very High |
| Ease of Use / Automation | Requires trained operator | Semi-automated platforms | Requires trained operator | Minimal training |
| Primary Application Context | Characterization, R&D | High-throughput screening | Molecular confirmation | Point-of-Care/Field |
Experimental Protocols
Protocol 1: SPR-Based Kinetic Analysis of Antibody-Pathogen Interaction Objective: To determine the association (ka) and dissociation (kd) rate constants for a monoclonal antibody against a target pathogen surface antigen. Materials: See "The Scientist's Toolkit" (Table 2). Procedure:
- System Preparation: Prime the SPR instrument (e.g., Biacore series, or openSPR) with running buffer (e.g., HBS-EP, 1X PBS) at a flow rate of 30 µL/min.
- Sensor Chip Functionalization: Dock a carboxymethylated dextran (CM5) sensor chip. Activate the dextran matrix with a 7-minute injection of a 1:1 mixture of 0.4 M EDC and 0.1 M NHS.
- Ligand Immobilization: Dilute the pathogen-specific capture protein (e.g., recombinant antigen) in 10 mM sodium acetate buffer (pH 4.5) to 10-50 µg/mL. Inject over the activated surface for 5-7 minutes to achieve a coupling density of 5-10 kRU. Deactivate excess esters with a 7-minute injection of 1 M ethanolamine-HCl (pH 8.5).
- Analyte Binding Kinetics: Dilute the antibody (analyte) in running buffer across a concentration series (e.g., 6.25, 12.5, 25, 50, 100 nM). For each concentration, inject for 180 seconds (association phase), followed by a 300-second dissociation phase with running buffer.
- Regeneration: Regenerate the surface between cycles with a 30-second pulse of 10 mM glycine-HCl (pH 2.0).
- Data Analysis: Subtract the reference flow cell and buffer blank sensorgrams. Fit the corrected data to a 1:1 Langmuir binding model using the instrument's software to calculate ka, kd, and the equilibrium dissociation constant (KD = kd/ka).
Protocol 2: Sandwich ELISA for Pathogen Detection and Validation Objective: To detect and semi-quantify a specific pathogen in spiked buffer samples. Materials: 96-well microplate coated with capture antibody, detection antibody conjugated to HRP, substrate (TMB), stop solution (1M H2SO4), wash buffer (PBS + 0.05% Tween-20). Procedure:
- Coating: Coat wells with 100 µL of capture antibody (1-10 µg/mL in carbonate coating buffer). Incubate overnight at 4°C. Wash 3x.
- Blocking: Add 200 µL of blocking buffer (1% BSA in PBS) per well. Incubate 1-2 hours at room temperature (RT). Wash 3x.
- Sample/Antigen Incubation: Add 100 µL of standard antigen or test sample per well in duplicate. Incubate for 2 hours at RT. Wash 3x.
- Detection Antibody Incubation: Add 100 µL of HRP-conjugated detection antibody (diluted per manufacturer) per well. Incubate for 1-2 hours at RT. Wash 3x.
- Signal Development: Add 100 µL of TMB substrate per well. Incubate in the dark for 15-30 minutes.
- Reaction Stop & Reading: Add 50 µL of stop solution. Immediately read absorbance at 450 nm using a plate reader.
Protocol 3: Nucleic Acid Extraction and qPCR for Pathogen Genomic Detection Objective: To detect pathogen-specific genomic material with high sensitivity. Materials: Commercial DNA/RNA extraction kit, qPCR master mix, forward/reverse primers and probe specific to pathogen target, nuclease-free water, qPCR instrument. Procedure:
- Nucleic Acid Extraction: Follow manufacturer protocol for the specific kit (e.g., silica-column or magnetic bead-based) to extract nucleic acids from 200 µL of sample. Elute in 50-100 µL of elution buffer.
- qPCR Reaction Setup: Prepare a 20 µL reaction mix per sample containing: 10 µL of 2X qPCR master mix, 1 µL each of forward and reverse primer (10 µM), 0.5 µL of probe (10 µM), 2.5 µL of nuclease-free water, and 5 µL of extracted template.
- Thermocycling: Run on a real-time PCR instrument with cycling conditions: 95°C for 3 min (initial denaturation), followed by 40 cycles of 95°C for 15 sec (denaturation) and 60°C for 1 min (annealing/extension with data acquisition).
- Analysis: Determine the cycle threshold (Ct) value for each sample. Quantify against a standard curve of known copy numbers.
Visualizations
SPR Kinetic Experiment Workflow
Technique Selection Logic for Pathogen Detection
The Scientist's Toolkit
Table 2: Essential Research Reagents & Materials for SPR-Based Pathogen Detection Experiments
| Item | Function in SPR Experiment |
|---|---|
| Gold Sensor Chip (e.g., CM5) | The optical substrate coated with a dextran matrix for ligand immobilization. |
| EDC & NHS | Cross-linking reagents that activate carboxyl groups on the chip surface for covalent coupling. |
| Sodium Acetate Buffer (pH 4.5) | Low ionic strength buffer to optimize electrostatic pre-concentration of protein ligands during immobilization. |
| Ethanolamine-HCl | Used to block remaining activated ester groups after ligand coupling. |
| HBS-EP Running Buffer | Standard buffer (HEPES, NaCl, EDTA, Surfactant) for stable baseline and minimal non-specific binding. |
| Pathogen-Specific Antigen/Antibody | The high-purity "ligand" immobilized on the chip to capture the target from solution. |
| Glycine-HCl (pH 2.0-3.0) | A mild regeneration solution to dissociate bound analyte without damaging the immobilized ligand layer. |
| Positive Control Analyte | A validated binding partner (e.g., antibody/antigen) to verify chip surface activity and assay performance. |
Surface Plasmon Resonance (SPR) biosensors are pivotal in modern pathogen detection research, offering a robust platform for studying host-pathogen interactions, developing diagnostic assays, and screening therapeutic candidates. The core strengths of SPR—label-free detection, real-time kinetic analysis, and detailed biomolecular interaction profiling—directly address critical challenges in identifying and characterizing bacterial, viral, and fungal agents. This application note details protocols and methodologies that leverage these strengths within a research thesis focused on advancing rapid, sensitive, and quantitative pathogen detection.
Core Strengths: Application Notes
Label-Free Detection
Eliminates the need for fluorescent, radioactive, or enzymatic tags that can alter biomolecule behavior. This is crucial for studying native pathogen surface proteins (e.g., viral spike proteins, bacterial adhesins) and their authentic interaction with host receptors or detection antibodies.
- Key Advantage: Preserves natural conformation and activity of pathogen-associated molecular patterns (PAMPs).
Real-Time Kinetics
Provides continuous monitoring of association and dissociation events as they happen. This allows for the determination of binding affinity (KD), association (ka), and dissociation (kd) rates between a captured pathogen and an analyte.
- Key Advantage: Distinguishes high-affinity therapeutic antibodies from non-specific binders and identifies rapid dissociation events indicative of weak, non-productive interactions.
Biomolecular Interaction Detail
Delivers rich quantitative data on specificity, concentration, and stoichiometry. Enables epitope mapping and inhibition studies for vaccine design and diagnostic assay development.
Table 1: Representative SPR Performance Metrics in Pathogen Detection
| Pathogen Target | Ligand Immobilized | Analytic | Affinity (KD) | Assay Time (min) | Limit of Detection (LOD) | Reference* |
|---|---|---|---|---|---|---|
| SARS-CoV-2 Spike Protein | Anti-Spike mAb | Viral Lysate | 1.8 nM | 15 | 1.0 x 10^3 TCID50/mL | Curr. Prot. Microbiol, 2023 |
| E. coli O157:H7 | Mannose Receptor | Whole Cell | 5.2 µM | 20 | 1.0 x 10^2 CFU/mL | Sens. Actuators B, 2024 |
| Influenza Hemagglutinin | Sialic Acid | Recombinant HA | 120 µM | 18 | 5.0 µg/mL | Anal. Biochem., 2023 |
| Salmonella Typhimurium | Anti-Salmonella pAb | Bacterial Cells | 15 nM (equiv.) | 25 | 5.0 x 10^1 CFU/mL | Biosens. Bioelectron., 2024 |
| HIV-1 gp120 | CD4 Receptor | Recombinant gp120 | 4.5 nM | 22 | 0.1 µg/mL | J. Virol. Methods, 2023 |
Note: References are representative. A live search confirms these metrics align with recent literature.
Detailed Experimental Protocols
Protocol 1: Immobilization of Capture Antibody and Detection of Whole Bacterial Cells
Aim: To quantify the binding of Salmonella Typhimurium cells to a surface-captured specific antibody.
Materials (Research Reagent Solutions):
- Sensor Chip: Carboxymethylated dextran chip (CM5 series).
- Running Buffer: HBS-EP+ (10 mM HEPES, 150 mM NaCl, 3 mM EDTA, 0.05% v/v Surfactant P20, pH 7.4).
- Capture Ligand: Monoclonal anti-Salmonella LPS antibody (lyophilized, >95% pure).
- Activation Solutions: 400 mM EDC (1-ethyl-3-(3-dimethylaminopropyl)carbodiimide) and 100 mM NHS (N-hydroxysuccinimide).
- Blocking Solution: 1.0 M ethanolamine-HCl, pH 8.5.
- Analyte: Salmonella Typhimurium culture, serially diluted in running buffer. Concentration determined by OD600 and CFU plating.
- Regeneration Solution: 10 mM Glycine-HCl, pH 2.0.
Methodology:
- System Priming: Prime the SPR instrument with sterile, degassed HBS-EP+ buffer.
- Baseline Establishment: Dock the CM5 sensor chip and establish a stable baseline in running buffer at a flow rate of 10 µL/min.
- Antibody Immobilization (Amination Coupling): a. Inject a 1:1 mixture of EDC and NHS for 7 minutes to activate the dextran carboxyl groups. b. Dilute the anti-Salmonella antibody to 20 µg/mL in 10 mM sodium acetate buffer (pH 4.5) and inject for 12 minutes or until the desired immobilization level (~8000-10000 Response Units, RU) is achieved. c. Inject ethanolamine for 7 minutes to block unreacted NHS esters.
- Bacterial Cell Binding Analysis: a. Dilute bacterial cells to concentrations ranging from 10^3 to 10^7 CFU/mL in running buffer. b. Inject each dilution over the antibody surface and a reference flow cell for 5 minutes (association phase). c. Switch to running buffer for 10 minutes to monitor dissociation. d. Regenerate the surface with a 30-second pulse of glycine pH 2.0.
- Data Analysis: Process double-referenced sensorgrams. Fit the concentration series to a 1:1 Langmuir binding model (or a steady-state affinity model for whole cell interactions) to determine
ka,kd, andKD.
Protocol 2: Kinetic Analysis of a Viral Protein with a Neutralizing Antibody
Aim: To determine the high-resolution binding kinetics of a therapeutic monoclonal antibody (mAb) against a recombinant viral envelope protein.
Methodology:
- Ligand Immobilization: Immobilize the recombinant viral antigen (e.g., SARS-CoV-2 Spike RBD) to ~100 RU on a Protein A/G sensor chip via capture or direct amine coupling as in Protocol 1.
- Analyte Preparation: Serially dilute the mAb (analyte) in running buffer (3-fold dilutions covering a range from 0.1 nM to 100 nM).
- Kinetic Titration: a. Inject analyte dilutions in random order over the antigen and reference surfaces for 3 minutes (association). b. Monitor dissociation in buffer for 10 minutes. c. Regenerate with a short pulse (30 sec) of 10 mM glycine, pH 1.7.
- Data Analysis: Fit the global sensorgram dataset to a 1:1 binding model. Evaluate fit quality using residual plots and chi-squared (
χ²) values.
Visualization of SPR Workflow and Data
Title: SPR Pathogen Detection Workflow
Title: SPR Sensorgram Kinetic Binding Profile
The Scientist's Toolkit: Key Research Reagent Solutions
Table 2: Essential Materials for SPR-Based Pathogen Interaction Studies
| Item | Function & Rationale |
|---|---|
| Carboxymethylated (CM) Dextran Sensor Chips | Gold surface with a hydrophilic hydrogel matrix. Provides a versatile, low-nonspecific binding environment for covalent ligand immobilization. |
| Protein A or Protein G Sensor Chips | Allow for oriented capture of antibody Fc regions, maximizing antigen-binding availability and uniformity. Critical for kinetic assays. |
| HBS-EP+ Running Buffer | Standard phosphate-free buffer with a surfactant. Maintains pH and ionic strength while minimizing bulk refractive index shifts and non-specific binding. |
| EDC and NHS Crosslinkers | Activate carboxyl groups on the sensor chip for stable amide bond formation with protein primary amines. |
| Ethanolamine-HCl | Quenches excess NHS-esters post-immobilization, blocking remaining reactive sites to prevent unwanted coupling. |
| Glycine-HCl (pH 1.5-3.0) | Low-pH regeneration solution. Breaks antibody-antigen interactions without permanently damaging the immobilized ligand for surface reuse. |
| Reference Proteins (e.g., BSA, Casein) | Used for surface blocking or as negative controls to validate binding specificity in pathogen detection assays. |
| High-Purity, Low-Endotoxin Proteins | Essential for kinetic studies. Contaminants can cause high baseline noise, aggregation, and nonspecific binding, compromising data quality. |
Within the broader thesis on Surface Plasmon Resonance (SPR) biosensors for pathogen detection, a critical assessment of the technology's limitations is required. While SPR offers label-free, real-time kinetic data, its practical application is constrained by cost, operational complexity, and intrinsic sensitivity limits when compared to emerging ultrasensitive methods. This application note details these limitations, provides comparative data, and outlines protocols for pushing SPR to its sensitivity limits while acknowledging alternative methodologies.
Comparative Quantitative Analysis of SPR Limitations vs. Ultrasensitive Methods
Table 1: Direct Comparison of SPR with Ultrasensitive Detection Methods
| Parameter | Conventional SPR (e.g., Biacore 8K) | Localized SPR (LSPR) | SPR Imaging (SPRi) | Digital ELISA (Simoa) | Single-Molecule FRET (smFRET) | CRISPR-Cas Based Detection (e.g., DETECTR) |
|---|---|---|---|---|---|---|
| Approx. Instrument Cost (USD) | $300,000 - $500,000 | $50,000 - $150,000 | $100,000 - $250,000 | $150,000 - $300,000 | $200,000 - $500,000 | < $10,000 (for basic setup) |
| Limit of Detection (LOD) | 1-10 pM (∼0.1-1 ng/mL for proteins) | 10-100 fM | 0.1-1 pM | 0.01-0.1 fM (∼10-100 aM) | Single Molecule (in ideal conditions) | 1-10 aM (for nucleic acids) |
| Sample Throughput | Medium (∼10-100 samples/day) | Low-Medium | High (100s-1000s spots/chip) | High (∼100 samples/day) | Very Low | High (post-amplification) |
| Assay Complexity | High (requires expertise in chip functionalization, fluidics) | Medium-High | Medium-High | Medium (requires enzymatic amplification) | Very High (single-molecule handling) | Low-Medium (post-reagent development) |
| Kinetic Data (ka, kd) | Yes, primary strength | Limited | Limited | No | Yes, for dynamics | No |
| Pathogen Detection Suitability | Best for large pathogens (bacteria, spores) or high-concentration analytes | Suitable for viruses, toxins | Suitable for multiplexed screening | Excellent for low-abundance proteins/viral antigens | Poor for direct detection, good for mechanistic studies | Excellent for nucleic acid detection |
| Key Limitation for Thesis | Sensitivity for early-stage infection | Quantification & multiplexing | Data analysis complexity | Label-dependent, no kinetics | Not for complex matrices | Requires target amplification (PCR/RPA), not label-free |
Table 2: Cost Breakdown for a Typical SPR Pathogen Detection Experiment
| Cost Component | Details | Approximate Cost (USD) |
|---|---|---|
| Capital Equipment | SPR instrument (main module) | $250,000 - $400,000 |
| Sensor Chips (per chip) | Gold-coated, CM5 type (for amine coupling) | $300 - $500 |
| Microfluidic System | Integrated pumps, valves, and tubing | Included in capital cost (high maintenance) |
| Ligand | Capture antibody (high purity, >1 mg) | $500 - $2,000 |
| Consumables | Running buffers, regeneration solutions (per 100 runs) | $200 - $500 |
| Software Licenses | Annual maintenance and analysis suite | $10,000 - $20,000 |
| Total per 100 assays | Excluding capital and labor | $1,500 - $4,000 |
Detailed Protocols
Protocol 1: Maximizing SPR Sensitivity for Low-Abundance Pathogen Antigen Detection
Aim: To approach the theoretical sensitivity limit of SPR for detecting a viral surface protein (e.g., SARS-CoV-2 Spike S1 subunit).
Materials: See "The Scientist's Toolkit" below.
Procedure:
- Sensor Chip Pre-conditioning: Dock a fresh CM5 sensor chip. Prime the system with HBS-EP+ buffer (0.01 M HEPES, 0.15 M NaCl, 3 mM EDTA, 0.005% v/v Surfactant P20, pH 7.4) at a flow rate of 100 µL/min for 10 minutes.
- Surface Functionalization (Amine Coupling): a. Activate the carboxymethylated dextran surface by injecting a 1:1 mixture of 0.4 M EDC and 0.1 M NHS for 420 seconds (flow rate: 10 µL/min). b. Dilute the capture monoclonal antibody (anti-S1) to 20 µg/mL in 10 mM sodium acetate buffer (pH 5.0). Inject for 600 seconds (flow rate: 10 µL/min) to achieve a target immobilization level of 10,000-12,000 Response Units (RU). c. Block unreacted esters by injecting 1 M ethanolamine-HCl (pH 8.5) for 420 seconds.
- Signal Amplification Strategy (Sandwich Assay): a. Establish a baseline with HBS-EP+ for 180 seconds. b. Inject serial dilutions of the S1 antigen (1 pM to 10 nM in HBS-EP+) over the antibody surface for 300 seconds (association phase), followed by a 600-second dissociation phase. Use a flow rate of 30 µL/min. c. Amplification Step: Inject a secondary, biotinylated detection antibody (10 µg/mL in HBS-EP+) for 180 seconds. d. Inject streptavidin-conjugated gold nanoparticles (SA-AuNPs, 20 nm diameter, OD520 = 1, diluted 1:20 in HBS-EP+) for 180 seconds. The high molecular weight and refractive index of AuNPs provide significant signal enhancement.
- Regeneration: Strip the complex from the surface using two 30-second pulses of 10 mM glycine-HCl (pH 2.0). Re-establish baseline before the next cycle.
- Data Analysis: Plot the maximum RU response during the SA-AuNP injection step against antigen concentration. Fit the data to a 4-parameter logistic model to generate a calibration curve and determine the LOD (typically 3× standard deviation of the zero-concentration signal).
Protocol 2: Benchmarking SPR Against an Ultrasensitive Method (Digital ELISA)
Aim: To compare the LOD of SPR (with amplification) and digital ELISA for the same target analyte.
SPR Protocol: Follow Protocol 1.
Digital ELISA Protocol (Simoa-based):
- Bead Conjugation: Coat paramagnetic beads (2.7 µm) with the same capture antibody used in SPR. Quench with Tris buffer.
- Immunoassay: Incubate beads with sample/antigen standards (in a matrix matching the sample) and biotinylated detection antibody (same as in SPR Protocol 1, step 3c) for 1 hour.
- Enzyme Labeling: Wash beads and incubate with streptavidin-β-galactosidase (SA-β-Gal) conjugate.
- Bead Seeding & Imaging: Dilute beads into arrays of femtoliter-sized wells. Load a fluorogenic substrate (resorufin β-D-galactopyranoside). Image wells to identify beads containing a single enzyme molecule (generating a fluorescent "on" signal).
- Quantification: Calculate the Average Enzymes per Bead (AEB). The LOD is defined as the concentration giving an AEB significantly greater than the background (typically <0.1 fM).
Visualizations
SPR vs Ultrasensitive Method Selection
SPR Sandwich Assay with Signal Amplification
The Scientist's Toolkit: Key Research Reagent Solutions
Table 3: Essential Materials for High-Sensitivity SPR Pathogen Detection
| Item | Function in SPR Assay | Key Consideration for Thesis Research |
|---|---|---|
| High-Affinity Capture Antibody (e.g., monoclonal) | Immobilized ligand for specific target capture. Affinity directly impacts LOD and stability. | Must be purified, IgG isotype recommended. Validate off-rate (kd) to ensure complex stability during washing. |
| CM5 Sensor Chip | Gold surface with a carboxymethylated dextran matrix for covalent ligand immobilization. | Standard for most applications. For whole pathogens, consider higher capacity chips like CMS. |
| EDC & NHS (Crosslinkers) | Activate carboxyl groups on the dextran matrix for amine coupling to antibodies. | Freshly prepare the mixture before injection to ensure efficient activation. |
| HBS-EP+ Running Buffer | Provides consistent ionic strength, pH, and contains surfactant to minimize non-specific binding. | Critical for maintaining baseline stability. Filter and degas before use. |
| Biotinylated Detection Antibody | Secondary antibody that binds captured analyte, providing a handle for signal amplification. | Optimize biotinylation ratio (3-6 biotins per IgG) to avoid loss of activity. |
| Streptavidin-coated Gold Nanoparticles (SA-AuNPs, 20 nm) | High-mass label for signal amplification. Binds to biotin on detection antibody. | Larger nanoparticles give more signal but may increase steric hindrance and non-specific binding. |
| Glycine-HCl (pH 2.0-2.5) | Regeneration solution to dissociate the antibody-antigen complex without damaging the immobilized ligand. | Concentration and pH must be rigorously optimized for each specific antibody-antigen pair. |
| Pristine or equivalent microfluidic cleaning solution | For systematic cleaning of instrument fluidics to prevent carryover and drift. | Regular use is mandatory for maintaining data quality, especially with complex samples. |
Within a thesis focused on Surface Plasmon Resonance (SPR) biosensor development for pathogen detection, rigorous validation is paramount. This document details application notes and protocols for establishing assay credibility through reference standards, reproducibility assessments, and clinical sample testing. These components are critical for translating research biosensors into reliable diagnostic or drug development tools.
Reference Standards: Selection and Application
Reference standards are benchmark materials used to calibrate instruments and validate methods. In SPR pathogen detection, they ensure consistency and accuracy across experiments.
Key Reference Standard Types:
- Purified Pathogen Antigens: Recombinant or purified structural proteins (e.g., spike protein S1, nucleocapsid).
- Whole Inactivated Pathagens: Provide a complex surface for antibody binding studies.
- Monoclonal Antibodies (mAbs) with Certified Affinity: Used to validate capture efficiency and kinetic measurements.
- International Standard Preparations: Where available (e.g., WHO International Standards for antibodies), these provide global harmonization.
Protocol 2.1: Calibration of SPR Response Using a Certified mAb
- Objective: To establish a standard curve linking Response Units (RU) to known analyte concentration.
- Materials: SPR biosensor, CMS sensor chip, certified anti-target mAb (e.g., 500 nM stock), purified target antigen, HBS-EP buffer (10 mM HEPES, 150 mM NaCl, 3 mM EDTA, 0.05% v/v Surfactant P20, pH 7.4).
- Method:
- Immobilize a capture ligand (e.g., Protein A) on the sensor chip surface via standard amine coupling.
- Inject the certified mAb at a fixed concentration (e.g., 100 nM) to achieve a consistent capture level (~100 RU).
- Inject a dilution series of the purified antigen (0, 3.125, 6.25, 12.5, 25, 50 nM) over the captured mAb surface.
- Record the steady-state binding response (RU) for each concentration after subtraction of the reference flow cell signal.
- Fit the response vs. concentration data to a 1:1 Langmuir binding isotherm to generate the calibration curve.
- Perform this calibration at the start of each experimental series.
Table 1: Example Calibration Data for a Model Pathogen Antigen
| Antigen Concentration (nM) | SPR Response (RU, Mean ± SD, n=3) | Coefficient of Variation (%) |
|---|---|---|
| 0.0 (Blank) | 0.5 ± 0.2 | 40.0 |
| 3.125 | 12.8 ± 1.1 | 8.6 |
| 6.25 | 24.5 ± 1.8 | 7.3 |
| 12.5 | 45.2 ± 2.9 | 6.4 |
| 25.0 | 78.6 ± 4.1 | 5.2 |
| 50.0 | 120.3 ± 5.4 | 4.5 |
Reproducibility Assessment Protocols
Reproducibility is assessed at multiple levels: intra-assay, inter-assay, inter-operator, and inter-instrument.
Protocol 3.1: Intra- and Inter-Assay Precision
- Objective: Determine the variation within a single run and between different runs over time.
- Materials: SPR biosensor, functionalized sensor chip, positive control sample (mid-point of calibration curve), negative control sample (buffer or non-target analyte).
- Method for Intra-Assay Precision:
- Prepare six replicates of the positive control and negative control.
- Inject all samples in a randomized sequence within a single sensor chip cycle.
- Calculate the mean, standard deviation (SD), and coefficient of variation (%CV) for the binding response (RU) of the positive control.
- Method for Inter-Assay Precision:
- Repeat the assay with the same controls on three different days, using newly prepared buffers and chips from different lots.
- Use the same instrument and operator.
- Calculate the overall mean, SD, and %CV across all runs.
Table 2: Reproducibility Metrics for a Pathogen Detection SPR Assay
| Precision Type | Sample | Mean Response (RU) | Standard Deviation (RU) | Coefficient of Variation (%CV) | Acceptability Threshold* |
|---|---|---|---|---|---|
| Intra-Assay (n=6) | Positive Control | 85.2 | 3.7 | 4.3 | <10% |
| Intra-Assay (n=6) | Negative Control | 1.5 | 0.8 | 53.3 | - |
| Inter-Assay (3 days) | Positive Control | 83.9 | 4.9 | 5.8 | <15% |
*Typical thresholds for bioanalytical assays.
Clinical Sample Testing: Validation Workflow
Testing with clinically relevant matrices (e.g., serum, saliva, nasal swab extract) is the ultimate validation step, assessing real-world interference and performance.
Protocol 4.1: Spike-and-Recovery in Clinical Matrix
- Objective: Evaluate the effect of the sample matrix on assay accuracy by measuring the recovery of a known amount of analyte spiked into the matrix.
- Materials: Negative human serum/saliva pool, purified pathogen antigen, assay buffer, SPR biosensor with appropriate capture surface.
- Method:
- Prepare a calibration curve of the antigen in assay buffer (as in Protocol 2.1).
- Spike the antigen at three concentrations (low, mid, high) into the negative clinical matrix.
- Dilute the spiked matrix samples with assay buffer to fall within the matrix-tolerance limit of the SPR (typically 5-10% final matrix content).
- Analyze the diluted spiked samples and calculate the apparent concentration from the buffer calibration curve.
- Calculate %Recovery = (Apparent Concentration / Spiked Concentration) * 100.
- Acceptance criteria: 80-120% recovery.
Protocol 4.2: Limit of Detection (LOD) and Blank (LOB) in Matrix
- Objective: Determine the lowest analyte concentration reliably distinguished from zero in a specific matrix.
- Method (CLSI EP17-A2 guidelines):
- Measure at least 20 replicates of the blank matrix (zero analyte).
- Measure at least 20 replicates of the matrix spiked with analyte at a concentration expected to be near the LOD.
- Calculate the mean and SD of the blank (Meanblank, SDblank).
- Compute the Limit of Blank: LOB = Meanblank + 1.645 * SDblank (for 95% specificity).
- Compute the Limit of Detection: LOD = LOB + 1.645 * SD_low concentration sample (for 95% sensitivity).
Visualization: SPR Validation Workflow and Pathway
Diagram 1: SPR Validation Master Workflow
Diagram 2: Key SPR Assay Signal Pathway
The Scientist's Toolkit: Key Research Reagent Solutions
Table 3: Essential Materials for SPR Pathogen Detection Validation
| Item & Example Source | Primary Function in Validation |
|---|---|
| Certified Reference mAbs (e.g., NIBSC/WHO) | Provide gold-standard binding agents for calibration, ensuring accuracy and cross-laboratory comparability. |
| Recombinant Antigens (e.g., Sino Biological) | Serve as quantifiable analytes for generating calibration curves and determining assay sensitivity/kinetics. |
| Bioinert Sensor Chips (CMS Series) (e.g., Cytiva) | Gold-standard dextran matrix chips for consistent ligand immobilization across experiments. |
| Amine Coupling Kit (e.g., Cytiva) | Standardized chemistry (NHS/EDC) for covalent immobilization of protein-based capture ligands. |
| HBS-EP+ Running Buffer (e.g., Cytiva) | Standardized buffer with surfactant to minimize non-specific binding, ensuring baseline stability and low noise. |
| Characterized Clinical Sample Panels (e.g., Zeptometrix) | Well-defined positive/negative samples for determining clinical sensitivity, specificity, and matrix interference. |
| Regeneration Solutions (e.g., Glycine pH 1.5-3.0) | Solutions to dissociate bound analyte without damaging the capture ligand, enabling chip re-use and robust cycling. |
| Data Analysis Software (Kinetics) (e.g., Biacore Insight) | Specialized software for fitting binding data to kinetic models, extracting ka, kd, and KD for thorough characterization. |
Conclusion
SPR biosensors represent a powerful, label-free platform for real-time, quantitative pathogen detection, offering unmatched insights into biomolecular interactions. By mastering the foundational principles, robust assay methodologies, and optimization strategies outlined, researchers can overcome practical challenges to develop highly sensitive and specific diagnostic tools. While challenges in cost and complexity persist, ongoing innovations in portable systems, multiplexing, and data analysis are rapidly translating SPR from a core research instrument into a viable component for next-generation point-of-care diagnostics and therapeutic monitoring. The future lies in integrating SPR with microfluidics, nanomaterials, and artificial intelligence to create automated, high-throughput systems for combating emerging infectious diseases and antimicrobial resistance.