SPR vs LSPR: A Complete Guide for Researchers on Plasmonic Biosensing Technologies
This comprehensive guide explains the critical differences between Surface Plasmon Resonance (SPR) and Localized Surface Plasmon Resonance (LSPR) for researchers and drug development professionals.
SPR vs LSPR: A Complete Guide for Researchers on Plasmonic Biosensing Technologies
Abstract
This comprehensive guide explains the critical differences between Surface Plasmon Resonance (SPR) and Localized Surface Plasmon Resonance (LSPR) for researchers and drug development professionals. We explore the foundational physics of propagating and localized plasmons, compare methodologies and real-world applications in biomolecular interaction analysis, provide troubleshooting and optimization strategies for both platforms, and validate performance through comparative analysis of sensitivity, throughput, and cost. The article concludes with future directions for integrated plasmonic technologies in biomedical research.
The Physics Behind the Plasmons: Understanding SPR and LSPR at the Core
Surface plasmons (SPs) represent a fundamental phenomenon in nanophotonics and plasmonics, lying at the heart of advanced sensing, imaging, and catalytic technologies. Understanding SPs is critical for a thesis distinguishing between two primary manifestations: Surface Plasmon Resonance (SPR) and Localized Surface Plasmon Resonance (LSPR). SPR refers to coherent electron oscillations propagating along a continuous metal-dielectric interface, while LSPR describes non-propagating oscillations confined to nanostructures. This whitepaper provides an in-depth technical guide to the core physics, excitation mechanisms, and experimental interrogation of surface plasmons, framed explicitly within comparative SPR vs. LSPR research relevant to drug development and biosensing.
Fundamental Physics of Surface Plasmons
A surface plasmon is a collective oscillation of free electrons at the interface between a conductive material (typically a noble metal like gold or silver) and a dielectric (e.g., air, water, or glass). These oscillations are coupled to electromagnetic waves, creating a surface electromagnetic wave that propagates along the interface. The wave is transverse-magnetic (TM) polarized and decays evanescently into both media.
The defining condition is given by the dispersion relation for a metal-dielectric interface:
ω_{SP} = (ω_p / √(1 + ε_d)) where ω_p is the bulk plasma frequency of the metal and ε_d is the dielectric constant of the adjacent medium. The SP wavevector k_{SP} is greater than the wavevector of light in the dielectric k_d, necessitating momentum-matching techniques (e.g., prism coupling, grating coupling) for excitation.
Localized Surface Plasmons (LSPs) arise in metallic nanoparticles (size << incident wavelength) where the conduction electrons oscillate coherently against the restoring force of the positive ionic core. The resonance condition is approximated for a small spherical particle by the Fröhlich condition: Re[ε_m(ω)] = -2ε_d, where ε_m is the complex dielectric function of the metal.
Quantitative Data Comparison: SPR vs. LSPR
Table 1: Core Characteristics of SPR and LSPR
| Parameter | Surface Plasmon Resonance (SPR) | Localized Surface Plasmon Resonance (LSPR) |
|---|---|---|
| Spatial Extent | Propagating wave (tens to hundreds of µm) | Localized to nanoparticle (1-100 nm) |
| Dispersion | Has a dispersion relation (ω vs. k) | Discrete resonance peaks |
| Excitation Requirement | Momentum matching required (prism, grating) | Direct illumination possible |
| Field Enhancement | Moderate (~10-100x) | Very high (>1000x possible) |
| Sensing Volume | ~200 nm evanescent field depth | ~5-30 nm from particle surface |
| Typical Spectral Feature | Resonance angle/depth shift | Resonance wavelength (λ_max) shift |
| Key Sensitivity Metric | Refractive Index Unit (RIU) per angle shift | RIU per nm wavelength shift |
| Typical Figure of Merit (FOM) | ~10^2 - 10^3 RIU⁻¹ | ~10^1 - 10^2 RIU⁻¹ |
| Instrumentation Commonality | Specialized angular/spectral systems | Common UV-Vis-NIR spectrophotometer |
Table 2: Typical Experimental Performance Metrics (Gold-based)
| System | Detection Limit (RIU) | Bulk Sensitivity (nm/RIU) | Application in Drug Development |
|---|---|---|---|
| SPR (Kretschmann) | 10⁻⁶ - 10⁻⁷ | 2,000 - 10,000 (angle) | Label-free binding kinetics (KD, kon, koff) |
| LSPR (Nanospheres, d=50nm) | 10⁻³ - 10⁻⁴ | 200 - 400 | End-point affinity screening, intracellular sensing |
| LSPR (Nanostars/Rods) | 10⁻⁴ - 10⁻⁵ | 400 - 1,000 | High-throughput compound screening, biomarker detection |
Experimental Protocols
Protocol 4.1: Exciting Propagating SPR via the Kretschmann Configuration (for Kinetic Binding Analysis)
Objective: Measure real-time binding kinetics between a drug candidate (analyte) and an immobilized protein target (ligand) on a thin gold film. Materials: See "The Scientist's Toolkit" below. Method:
- Substrate Preparation: Clean a BK7 glass prism with piranha solution (3:1 H₂SO₄:H₂O₂). CAUTION: Extremely corrosive. Rinse with DI water and dry under N₂.
- Metal Deposition: Sputter-deposit a 2 nm chromium adhesion layer, followed by a 50 nm gold film onto the prism face.
- Ligand Immobilization: Mount the prism in the SPR instrument flow cell. Prime the system with running buffer (e.g., PBS, pH 7.4).
- Surface Functionalization: a. Inject a 1 mM solution of thiolated capture molecules (e.g., carboxylated alkane thiol) for 1 hour to form a self-assembled monolayer (SAM). b. Activate carboxyl groups by injecting a 1:1 mixture of 0.4 M EDC and 0.1 M NHS for 10 minutes. c. Inject the purified ligand (e.g., receptor protein at 10-50 µg/mL in acetate buffer, pH 5.0) for 10-15 minutes. d. Deactivate remaining esters and block non-specific sites by injecting 1 M ethanolamine-HCl (pH 8.5) for 10 minutes.
- Kinetic Measurement: Establish a stable baseline with running buffer. Inject drug candidate solutions at varying concentrations (serial dilutions) at a constant flow rate (e.g., 30 µL/min) for an association phase (2-5 min), followed by running buffer for dissociation (5-10 min). Regenerate the surface with a mild regeneration buffer (e.g., 10 mM Glycine-HCl, pH 2.0) between cycles.
- Data Analysis: Fit the resulting sensorgrams (response vs. time) for each concentration globally using a 1:1 Langmuir binding model to extract association (
k_on) and dissociation (k_off) rate constants, and calculate the equilibrium dissociation constantK_D = k_off / k_on.
Protocol 4.2: Characterizing LSPR of Synthesized Gold Nanoparticles (AuNPs)
Objective: Synthesize citrate-capped AuNPs and characterize their LSPR peak for use as a biosensing platform. Method:
- Synthesis (Turkevich Method): a. Bring 100 mL of 1 mM HAuCl₄ to a rolling boil in a round-bottom flask with vigorous stirring. b. Rapidly add 10 mL of 38.8 mM trisodium citrate. c. Continue heating and stirring until the color changes from pale yellow to deep red (~10 min). d. Cool to room temperature while stirring.
- LSPR Spectral Characterization:
a. Dilute the colloid 1:10 in DI water.
b. Load into a quartz cuvette and acquire an extinction (absorbance + scattering) spectrum from 400-900 nm using a UV-Vis-NIR spectrophotometer.
c. Record the wavelength of maximum extinction (
λ_max). For ~50 nm spheres,λ_max~530 nm. - Biosensing Functionalization & Measurement:
a. Functionalize AuNPs by adding a thiolated probe molecule (e.g., DNA aptamer or antibody) to the colloid and incubating for 24 hours. Purify via centrifugation.
b. Incubate functionalized AuNPs with varying concentrations of the target analyte.
c. Measure the
λ_maxshift (Δλ) for each concentration. A red shift typically indicates binding-induced local refractive index increase. d. PlotΔλvs. concentration to generate a calibration curve.
Visualization: Mechanisms & Workflows
Title: SPR Excitation via Kretschmann Configuration & Sensing Principle
Title: LSPR Sensing Mechanism via Spectral Shift
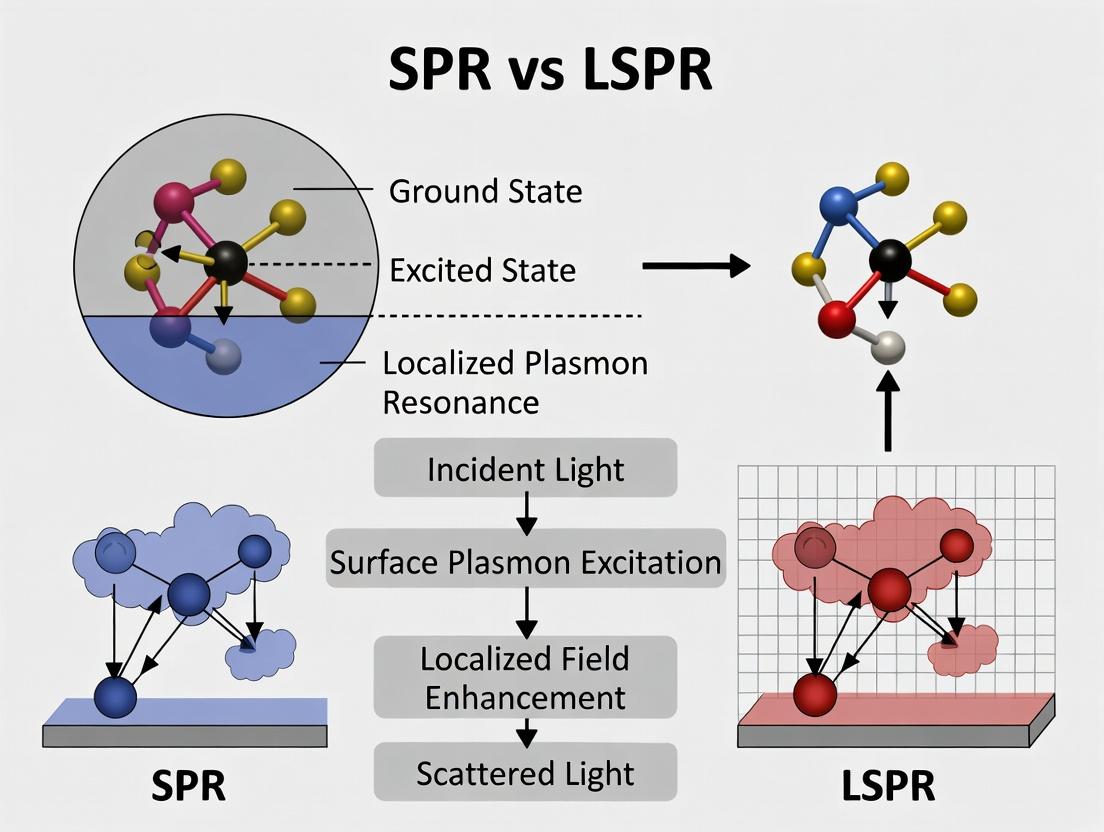
Title: Logical Breakdown of SPR vs. LSPR from Core Phenomenon
The Scientist's Toolkit: Key Research Reagent Solutions
Table 3: Essential Materials for SPR & LSPR Experiments in Drug Development
| Item | Function & Relevance | Example Product/Specification |
|---|---|---|
| SPR Chip (Gold Film) | Sensor substrate for SPR. A glass slide with a thin, precise gold layer. | Cytiva SIA Kit Au (≈50 nm gold on glass with adhesion layer). |
| Carboxymethylated Dextran | Hydrogel matrix for ligand immobilization on SPR chips; increases binding capacity and reduces non-specific binding. | Cytiva CM5 Sensor Chip. |
| EDC & NHS Crosslinkers | Activate carboxyl groups for covalent amine coupling of proteins/ligands to the sensor surface. | Thermo Fisher EDC (#PG82071) & Sulfo-NHS (#PG82071). |
| HBS-EP+ Running Buffer | Standard SPR running buffer; provides ionic strength and pH stability, contains surfactant to minimize non-specific binding. | Cytiva BR100669 (10x HEPES pH 7.4, NaCl, EDTA, Surfactant P20). |
| Regeneration Buffers | Dissociate bound analyte without damaging the immobilized ligand for chip re-use. | Low pH (Glycine-HCl, pH 2.0-3.0), High pH (NaOH, pH 10-12), High Salt (MgCl₂). |
| Citrate-capped Gold Nanoparticles | Standard LSPR substrates; easily functionalized via thiol chemistry. | Cytodiagnostics 40, 60, 80 nm gold nanospheres. |
| PEGylated Thiols | Used to create mixed SAMs on AuNPs/SPR chips to resist non-specific protein adsorption. | HS-(CH₂)₁₁-EG₆-COOH (e.g., ProChimia SAMs). |
| Spectrophotometer Cuvettes | For measuring LSPR extinction spectra; must be UV-Vis compatible. | Hellma Analytics SUPRASIL Quartz Cuvettes. |
This technical guide provides a detailed exploration of Surface Plasmon Resonance (SPR) at planar interfaces, with a specific focus on its propagating and delocalized nature. This discussion is framed within a critical thesis distinguishing SPR from its nanoscale counterpart, Localized Surface Plasmon Resonance (LSPR). The core distinction lies in the spatial extent and confinement of the resonant oscillations. SPR on planar films supports propagating electromagnetic waves bound to the metal-dielectric interface, typically over tens to hundreds of micrometers. In contrast, LSPR involves non-propagating, localized oscillations confined to nanostructures with dimensions smaller than the wavelength of light, resulting in highly enhanced but spatially restricted fields. Understanding this fundamental difference is essential for selecting the appropriate plasmonic phenomenon for applications ranging from biosensing to photonics.
Core Physics: Propagation and Delocalization
The SPR Condition
Surface Plasmon Polaritons (SPPs) are electromagnetic surface waves that propagate along the interface between a metal (e.g., gold, silver) and a dielectric (e.g., glass, water, air). Their generation requires momentum matching, typically achieved using a prism (Kretschmann or Otto configuration) or a grating. The resonance condition is given by:
[ k{SPP} = k0 \sqrt{\frac{\epsilonm \epsilond}{\epsilonm + \epsilond}} = k0 np \sin(\theta_{SPR}) ]
Where (k{SPP}) is the SPP wavevector, (k0) is the free-space wavevector, (\epsilonm) and (\epsilond) are the complex dielectric constants of the metal and dielectric, (np) is the prism refractive index, and (\theta{SPR}) is the resonance angle.
Key Propagation Characteristics
- Delocalization: The SPR electromagnetic field extends significantly into both the metal (skin depth, ~10-50 nm) and the dielectric medium (evanescent decay, ~100-300 nm). This creates a sensing volume orders of magnitude larger than that of LSPR.
- Propagation Length: SPPs propagate along the interface before decaying due to ohmic losses in the metal. This length ranges from ~10 to 100 µm for visible/near-IR light on gold.
Table 1: Quantitative Comparison of Key SPR vs. LSPR Parameters
| Parameter | Planar SPR (Propagating) | LSPR (Localized) |
|---|---|---|
| Spatial Extent | Propagating wave (10s-100s µm) | Confined to nanostructure (< wavelength) |
| Field Penetration Depth (Dielectric) | ~100-300 nm | ~5-30 nm |
| Propagation Length | 10 - 100 µm | 0 (non-propagating) |
| Sensitivity (Bulk RI) | High (10²–10³ nm/RIU) | Moderate (10¹–10² nm/RIU) |
| Figure of Merit (FOM) | ~10² | Can be higher for sharp nanostructures |
| Typical Spectral Region | Visible to Near-IR | Visible (tunable by shape/size) |
| Measurement Readout | Angle shift, Intensity, Phase | Wavelength shift, Scattering Intensity |
| Device Footprint | Millimeter-scale | Micro/Nano-scale |
Experimental Protocols
Standard Kretschmann Configuration SPR Experiment Protocol
Objective: To measure real-time binding kinetics of a ligand-analyte interaction on a planar gold sensor chip.
Materials: See "The Scientist's Toolkit" section below.
Protocol Steps:
- Sensor Chip Preparation: A glass substrate is cleaned, and a 2 nm chromium or titanium adhesion layer is deposited via magnetron sputtering, followed by a 47-50 nm gold film.
- Surface Functionalization: The gold chip is mounted in the SPR instrument prism coupler using matching index oil. The chip surface is cleaned with a series of injections (e.g., SDS, NaOH). A self-assembled monolayer (SAM) of alkanethiols (e.g., 11-Mercaptoundecanoic acid) is formed by flowing the solution for 12-18 hours or using an accelerated protocol. The carboxyl groups are activated using a mixture of EDC and NHS for 7 minutes.
- Ligand Immobilization: The target ligand (e.g., an antibody) in sodium acetate buffer (pH 4.5-5.0) is injected over the activated surface for a set time, leading to covalent amide bond formation. Excess reactive esters are quenched with ethanolamine.
- Baseline Stabilization: Running buffer (e.g., PBS with 0.005% Tween 20, pH 7.4) is flowed at a constant rate (20-30 µL/min) until a stable baseline (in Resonance Units, RU) is achieved.
- Association Phase: A series of analyte solutions at varying concentrations are injected (contact time: 60-300 s). Binding events increase the local refractive index, causing a shift in the SPR angle (measured in real-time as RU change).
- Dissociation Phase: Running buffer is reintroduced, and the decrease in signal due to complex dissociation is monitored.
- Regeneration: A brief injection of a regeneration solution (e.g., 10 mM glycine-HCl, pH 2.0) is used to break the ligand-analyte interaction without denaturing the ligand, returning the signal to baseline.
- Data Analysis: Sensorgrams (RU vs. Time) for each concentration are globally fitted to a 1:1 Langmuir binding model or other appropriate kinetic models using the instrument's software to extract association ((ka)) and dissociation ((kd)) rate constants, and the equilibrium dissociation constant ((KD = kd/k_a)).
SPR Spectroscopy for Material Characterization Protocol
Objective: To characterize the dielectric constant and thickness of a thin film deposited on a planar gold surface.
Protocol Steps:
- Baseline Measurement: Angular or wavelength SPR scans are performed on the bare gold sensor chip in a controlled environment (e.g., air or buffer).
- Sample Deposition: The thin film of interest is deposited onto the gold surface (via spin-coating, Langmuir-Blodgett transfer, or adsorption).
- Post-Deposition Scan: SPR scans are repeated under identical conditions.
- Data Fitting: The shift and shape change of the SPR curve (angle or wavelength) are analyzed using a Fresnel multilayer reflection model. Software (e.g., WinSpall, SCOUT) is used to fit the optical model (prism/Au/film/ambient) to the experimental data, extracting the film's thickness and complex refractive index (n, k).
Key Signaling Pathways and Workflows
Title: SPR Biosensing Workflow from Excitation to Data
Title: Key Differences Between Propagating SPR and Localized LSPR
The Scientist's Toolkit
Table 2: Essential Research Reagent Solutions for SPR Biosensing
| Item | Function | Typical Example/Note |
|---|---|---|
| SPR Sensor Chip (Planar) | Provides the gold-coated substrate for SPP generation and ligand immobilization. | CM5 Chip (carboxymethylated dextran matrix on gold), NTA Chip (for His-tagged capture), bare gold chip. |
| Coupling Prism | Enables momentum matching (Kretschmann). Typically high-index glass. | SF10 or BK7 glass hemisphere or trapezoid. |
| Index Matching Oil | Ensures optical contact between prism and sensor chip, eliminating air gaps. | n_D = 1.515 ± 0.0005, non-fluorescent, non-drying. |
| Alkanethiol SAM Reagents | Form a self-assembled monolayer on gold for surface chemistry and to prevent non-specific binding. | 11-Mercaptoundecanoic acid (COOH terminal), HS-C11-EG6 (oligoethylene glycol, anti-fouling). |
| Carboxyl Activators (EDC/NHS) | Activate carboxyl groups on the SAM or chip surface for covalent amine coupling to ligands. | Freshly prepared mix of 0.4 M EDC and 0.1 M NHS in water. |
| Running Buffer | Provides a stable, biocompatible fluidic environment. Minimizes non-specific binding. | PBS (pH 7.4) with 0.005% surfactant (e.g., Tween 20). Must be degassed. |
| Ligand Immobilization Buffer | Optimizes ligand orientation and binding efficiency during surface capture. | Low ionic strength, pH slightly below ligand's pI (e.g., 10 mM sodium acetate, pH 4.5-5.0). |
| Regeneration Solution | Gently breaks ligand-analyte bonds without damaging the immobilized ligand for chip reuse. | 10-100 mM Glycine-HCl (pH 1.5-3.0), NaOH (10-50 mM), or SDS (0.01-0.1%). Must be optimized. |
| Reference Analyte | Used for system calibration and validation of assay performance. | Bovine serum albumin (BSA) or a well-characterized protein-protein interaction pair. |
Localized Surface Plasmon Resonance (LSPR) is a phenomenon where conduction electrons in metallic nanoparticles collectively oscillate when excited by incident light at resonant frequencies. Unlike propagating Surface Plasmon Resonance (SPR), LSPR is confined to nanoscale volumes, creating intense, localized electromagnetic fields. This guide, framed within the broader thesis contrasting SPR and LSPR, details the principles of confinement, key experimental methods, and applications relevant to researchers and drug development professionals.
Core Physics: Confinement vs. Propagation
The fundamental difference between SPR and LSPR lies in electron oscillation confinement.
- SPR: A propagating charge-density wave along a continuous metal-dielectric interface (e.g., a gold film). It requires momentum-matching optics (prism, grating) and probes bulk refractive index changes over ~200 nm.
- LSPR: A non-propagating, localized oscillation confined to nanoparticles smaller than the wavelength of light. The resonance is sensitive to the local dielectric environment within ~10-30 nm of the nanoparticle surface.
The condition for LSPR is given by: ε_m(ω) = -2ε_d, where ε_m is the complex dielectric function of the metal and ε_d is the dielectric constant of the surrounding medium.
Key Parameters Governing LSPR
The LSPR spectral position and strength are controlled by multiple factors.
Table 1: Quantitative Parameters Governing LSPR Properties
| Parameter | Typical Range/Value | Effect on LSPR Peak (λ_max) | Effect on Field Enhancement |
|---|---|---|---|
| Material | Au, Ag, Cu, Al, Pt | Au:~520-580 nm; Ag:~400-450 nm (in water) | Ag typically provides highest enhancement |
| Particle Size | 10 nm - 200 nm (diameter) | Red-shifts with increasing size (for sizes >~30 nm) | Increases with size up to radiation damping limit |
| Particle Shape | Spheres, rods, triangles, stars, cubes | Spheres: shortest λ; Rods: tunable via aspect ratio; Sharp tips: significant red-shift | Highly concentrated at sharp tips and vertices |
| Local Dielectric Environment | Refractive Index (n) = 1.33 (water) to ~1.5 (glass/protein) | Linear red-shift with increasing n: Δλmax = m * Δn * [1-exp(-2d/Ld)] | Higher n reduces field contrast, slightly diminishing enhancement |
| Inter-Particle Coupling | Gap distance (d) < particle diameter | Significant red-shift as d decreases (exponential decay) | Massive enhancement ("hot spot") in nanogaps (d < 10 nm) |
Key: m = sensitivity factor (nm/RIU), d = adsorbate thickness, L_d = electromagnetic field decay length (~10-30 nm).
Experimental Protocols for LSPR Characterization
Synthesis of Anisotropic Gold Nanorods (Seed-Mediated Growth)
Purpose: To produce nanoparticles with tunable longitudinal LSPR in the NIR region. Materials: CTAB, HAuCl4, NaBH4, AgNO3, Ascorbic acid. Protocol:
- Seed Solution: Mix 5 mL 0.2 M CTAB with 5 mL 0.5 mM HAuCl4. Add 0.6 mL ice-cold 10 mM NaBH4 under vigorous stirring. Stir for 2 min. Age at 27°C for 30 min.
- Growth Solution: Combine 40 mL 0.2 M CTAB, 1.8 mL 10 mM HAuCl4, 240 µL 10 mM AgNO3, and 260 µL 0.1 M Ascorbic acid. Gently mix until clear.
- Initiation: Add 64 µL of seed solution to the growth solution, mix gently, and let sit undisturbed at 27°C for 3 hours.
- Purification: Centrifuge at 12,000 rpm for 15 min. Decant supernatant and re-suspend pellet in deionized water.
LSPR Extinction Spectroscopy
Purpose: To measure the collective oscillation strength of a nanoparticle ensemble. Protocol:
- Place nanoparticle colloid or substrate in a UV-Vis-NIR spectrophotometer.
- Measure extinction (absorbance + scattering) across a wavelength range (e.g., 300-1100 nm).
- Identify peak wavelength (λ_max) and full width at half maximum (FWHM). FWHM is inversely related to plasmon damping.
- For sensitivity measurement: Acquire spectra in different refractive index standards (e.g., water, glycerol solutions). Plot Δλ_max vs. Δn to determine bulk refractive index sensitivity (nm/RIU).
Single-Nanoparticle Scattering Spectroscopy
Purpose: To characterize heterogeneity and properties of individual nanoparticles. Protocol:
- Use a darkfield microscope coupled to a spectrophotometer.
- Sparsely deposit nanoparticles on a glass substrate.
- Isolate light from a single nanoparticle using an adjustable aperture.
- Collect the scattered light spectrum via a spectrometer.
- Analyze λ_max and linewidth for individual particles.
Diagram 1: Core LSPR Experimental Workflow (85 chars)
The Scientist's Toolkit: Essential Research Reagents & Materials
Table 2: Key Research Reagent Solutions for LSPR Studies
| Item | Function in LSPR Research | Example Product/Chemical |
|---|---|---|
| Metal Precursors | Source of metal ions for nanoparticle synthesis. | Hydrogen tetrachloroaurate(III) trihydrate (HAuCl4·3H2O), Silver nitrate (AgNO3) |
| Shape-Directing Surfactants | Control crystal facet growth, determining final nanoparticle morphology. | Cetyltrimethylammonium bromide (CTAB), Polyvinylpyrrolidone (PVP) |
| Reducing Agents | Reduce metal ions to form metallic nuclei and nanoparticles. | Sodium borohydride (NaBH4), Ascorbic acid, Citrate |
| Functionalization Thiols | Form self-assembled monolayers on Au/Ag for bioconjugation. | Poly(ethylene glycol) thiol (PEG-SH), 11-Mercaptoundecanoic acid (11-MUA) |
| Refractive Index Standards | Calibrate the bulk refractive index sensitivity of LSPR sensors. | Glycerol/Water solutions, Sucrose/Water solutions |
| Spectroscopic Substrates | Provide a low-background, functionalizable surface for nanoparticle immobilization. | ITO-coated glass, Aminosilane-coated glass, UV-Ozone treated substrates |
Signaling & Sensing Pathways
LSPR biosensing operates by transducing a local refractive index change into a measurable spectral shift.
Diagram 2: LSPR Spectral Shift Biosensing Pathway (46 chars)
Advanced Nanostructures and Hot Spots
Engineered nanostructures create intense electromagnetic "hot spots" crucial for single-molecule sensing (SERS, SEIRA).
Table 3: Nanostructures for Enhanced Localization
| Nanostructure Type | Hot Spot Location | Typical Enhancement Factor (EF) | Key Application |
|---|---|---|---|
| Single Nanosphere | At poles along polarization axis. | 10¹ - 10³ | Fundamental studies, simple biosensors. |
| Dimer (Coupled Particles) | In the nanogap (gap < 10 nm). | 10⁵ - 10⁹ | SERS, nonlinear optics, single-molecule detection. |
| Nanoshell | In the dielectric core and at outer surface. | 10³ - 10⁵ | Photothermal therapy, tunable NIR sensors. |
| Nanorod | At the two tips of the long axis. | 10³ - 10⁶ | Polarization-sensitive sensing, in vivo applications. |
| Nano-star/Urchin | At the multiple sharp tips. | 10⁵ - 10⁸ | Multiplexed sensing, high-sensitivity detection. |
Understanding the fundamental differences between Surface Plasmon Resonance (SPR) and Localized Surface Plasmon Resonance (LSPR) is pivotal for advancing nanophotonics and biosensing applications. A core aspect of this distinction lies in two critical theoretical and experimental parameters: Propagation Length and Local Field Enhancement. This whitepaper delineates these concepts, framing them within the broader thesis that SPR is characterized by propagating, long-range electromagnetic waves confined at a metal-dielectric interface, while LSPR is defined by non-propagating, localized resonances in nanostructures. The propagation length is a defining metric for SPR, governing sensor design and performance, whereas the local field enhancement is the hallmark of LSPR, enabling applications in nonlinear optics and single-molecule spectroscopy.
Core Theoretical Definitions and Quantitative Comparison
Propagation Length (Lₚ)
Definition: The distance over which the intensity of a propagating surface plasmon polariton (SPP) wave decays to 1/e of its initial value along the metal-dielectric interface. It is a measure of the SPP's attenuation, primarily due to ohmic losses in the metal. Governing Equation: ( L_p = \frac{1}{2k''} ), where ( k'' ) is the imaginary part of the complex SPP wave vector. Primary Context: SPR. Critical for designing planar waveguide sensors and integrated photonic circuits.
Local Field Enhancement (F)
Definition: The ratio of the electric field intensity (|E|²) at a "hot spot" near a metallic nanostructure under resonant excitation to the incident field intensity. It quantifies the nanofocusing capability of plasmonic nanoparticles. Governing Factor: Geometrical parameters (sharp tips, nanogaps), material properties, and excitation wavelength. Primary Context: LSPR. Drives surface-enhanced spectroscopies (SERS, SEIRA) and enhanced fluorescence.
Table 1: Quantitative Comparison of Key Parameters
| Parameter | Typical System (SPR) | Typical System (LSPR) | Key Dependencies | ||||
|---|---|---|---|---|---|---|---|
| Propagation Length (Lₚ) | ~10 - 100 µm (Au, 633 nm) | Not applicable (non-propagating) | Metal (Im(ε)), wavelength, dielectric constant | ||||
| Local Field Enhancement ( | E | ²/ | E₀ | ²) | Moderate (~10²) at interface | Extremely high (10³ - 10¹¹) in gaps/tips | Particle geometry, material, inter-particle gap |
| Resonance Linewidth | Narrow (tens of nm) | Broader (hundreds of nm) | Radiative vs. non-radiative damping | ||||
| Sensing Volume | Long, evanescent ~100-200 nm depth | Highly confined (<10 nm from surface) | Decay length of near-field | ||||
| Primary Application | Bulk refractive index sensing, biomolecular kinetics | Near-field sensing, single-molecule detection, photocatalysis | Derived from field confinement |
Experimental Methodologies for Measurement
Protocol: Measuring Propagation Length via Leakage Radiation Microscopy
Objective: To directly image and quantify the decay of propagating SPPs on a thin metal film. Materials: Au or Ag film (~50 nm) on a glass substrate, prism coupler (Kretschmann configuration), laser source (e.g., 633 nm He-Ne), high-NA oil immersion objective, CCD camera. Procedure:
- Couple laser light into SPP mode using a prism and match wavevectors via angle adjustment.
- Use a high-NA objective placed above the metal film to collect the light leaked by the SPP due to surface roughness.
- Capture a high-resolution image of the propagating SPP wavefront.
- Plot the intensity profile along the propagation direction.
- Fit the exponential decay curve: ( I(x) = I0 \exp(-x/Lp) ) to extract ( L_p ).
Protocol: Measuring Local Field Enhancement via Single-Molecule SERS
Objective: To empirically estimate field enhancement factors by counting photon emissions from single molecules. Materials: Colloidal Au nanodimers (with ~1 nm gap), bi-analyte SERS tagging molecules (e.g., BPT and TPT), Raman spectrometer with confocal microscopy. Procedure:
- Functionalize synthesized Au nanodimers with a precise, sub-monolayer coverage of two distinct Raman reporter molecules.
- Disperse dimers onto a substrate to isolate single nanostructures.
- Acquire Raman spectra from individual dimer particles using a tightly focused laser.
- The SERS enhancement factor (EF) is calculated using: ( EF = (I{SERS} / N{surf}) / (I{bulk} / N{bulk}) ), where ( I{SERS} ) and ( I{bulk} ) are the Raman intensities under SERS and non-plasmonic conditions, and ( N{surf} ) and ( N{bulk} ) are the number of molecules probed.
- Relate the SERS EF to the local field enhancement: ( EF{SERS} \approx |E/E0|^4 ) (for electromagnetic enhancement).
Visualization of Concepts and Workflows
Title: SPR vs LSPR: Core Metrics and Characteristics
Title: Propagation Length Measurement Workflow
Title: Local Field Enhancement Mechanism
The Scientist's Toolkit: Research Reagent Solutions
Table 2: Essential Materials for SPR/LSPR Experiments
| Item | Function | Example/Supplier |
|---|---|---|
| High-Purity Metal Targets (Au, Ag) | Thermal evaporation or sputtering to create uniform thin films for SPR substrates. | Kurt J. Lesker, 99.999% Au wire. |
| Functionalized Nanoparticles | Ready-to-use colloidal Au/Ag spheres, rods, or dimers with controlled geometry for LSPR. | nanoComposix, Cytodiagnostics. |
| Self-Assembled Monolayer (SAM) Kits | Provide consistent surface chemistry for biomolecule immobilization on Au/Ag. | Sigma-Aldrich (alkanethiols), ProteoChem (carboxyl, amine, NHS ester kits). |
| Refractive Index Matching Oils | For prism coupling in Kretschmann configuration SPR setups. | Cargille Labs, specified for laser wavelength. |
| Biomolecular Coupling Reagents | Facilitate covalent linking of ligands to sensor surfaces (e.g., EDC/NHS for carboxyl groups). | Thermo Fisher Scientific Crosslinker Kits. |
| Raman Reporter Dyes | Small, resonant molecules for SERS tagging and field enhancement calibration (e.g., BPT, TPT). | Sigma-Aldrich, 4-mercaptobenzoic acid. |
| Index Calibration Standards | Solutions with precise, known refractive index for sensor calibration and benchmarking. | Reichert SPR Certified Refractive Index Liquids. |
| PDMS & Microfluidic Chips | For integrated, flow-based sensing experiments in both SPR and LSPR platforms. | Microfluidic ChipShop, Dolomite. |
Thesis Context: This technical guide details the experimental core for investigating the fundamental differences between Surface Plasmon Resonance (SPR) and Localized Surface Plasmon Resonance (LSPR). While SPR, typically excited in continuous thin films via the Kretschmann configuration, yields propagating waves sensitive to bulk refractive index changes, LSPR is confined to nanostructures like gold nanostars, generating intense, localized fields sensitive to local molecular binding and nanostructure geometry.
Kretschmann Configuration for SPR
The Kretschmann configuration is the predominant method for exciting propagating surface plasmons on a thin metal film for SPR biosensing.
Experimental Protocol: Kretschmann Angle Scan
- Substrate Preparation: A clean glass prism (e.g., SF10) is coated with a 2 nm chromium adhesion layer followed by a 47-50 nm gold film via electron-beam physical vapor deposition.
- Fluidics Assembly: A flow cell is sealed against the gold film, forming a microfluidic channel for sample delivery.
- Optical Alignment: A polarized (p-polarized), monochromatic light source (e.g., 633 nm He-Ne laser) is collimated and directed toward the prism-gold interface.
- Angle-Resolved Intensity Measurement: The detector (e.g., photodiode array or rotating goniometer with single photodiode) measures reflected light intensity as a function of incident angle (θ).
- Data Acquisition: The reflectivity curve (R vs. θ) is plotted. The angle of minimum reflectivity (the SPR dip, θ_SPR) is identified.
- Sensing Measurement: Buffer is flowed to establish a baseline θSPR. Analyte introduction causes a refractive index change at the gold surface, shifting θSPR. The shift Δθ_SPR (in resonance units, RU) is measured in real-time.
Table 1: Representative Parameters for Kretschmann SPR Setup
| Component | Specification | Typical Value/Range | Purpose |
|---|---|---|---|
| Prism | Material, Refractive Index (n) | SF10 glass, n=1.723 @ 633 nm | Provides total internal reflection condition. |
| Metal Film | Material, Thickness | Gold, 47-50 nm | Supports propagating surface plasmon wave. |
| Adhesion Layer | Material, Thickness | Chromium or Titanium, 1-2 nm | Promotes Au adhesion to glass. |
| Light Source | Type, Wavelength (λ) | p-polarized Laser, λ=633 nm | Provides coherent, polarized excitation. |
| SPR Dip | Angular Width (FWHM) | ~0.3° - 1.0° | Related to plasmon propagation length and damping. |
| Bulk Sensitivity | Δθ_SPR / Δn | ~80-120 °/RIU | Response to bulk refractive index unit (RIU) change. |
Nanostar Fabrication for LSPR
Gold nanostars (AuNS) are synthesized via a seed-mediated, surfactant-directed method to produce anisotropic particles with sharp tips, which are critical for high LSPR sensitivity and surface-enhanced Raman scattering (SERS).
Experimental Protocol: Gold Nanostar Synthesis
- Seed Solution: 10 mL of 0.25 mM HAuCl₄ is mixed with 10 mL of 0.1 M CTAB under stirring. 1.2 mL of ice-cold 10 mM NaBH₄ is rapidly injected, causing a color change from yellow to brownish-yellow. Stir for 2 minutes, then incubate at 28°C for 30 mins.
- Growth Solution: 40 mL of 0.2 mM HAuCl₄ is mixed with 400 μL of 10 mM AgNO₃ and 40 mL of 0.1 M CTAB. 1.6 mL of 100 mM ascorbic acid (a mild reducing agent) is added, turning the solution colorless.
- Nanostar Growth: 96 μL of the seed solution is added to the growth solution and gently mixed for 30 seconds. The solution is left undisturbed overnight at 28°C. The final solution color is bluish-gray.
- Purification: Centrifuge at 8000 rpm for 10 minutes. Discard supernatant and resuspend pellet in deionized water. Repeat twice to remove excess CTAB.
- Characterization: Analyze using UV-Vis-NIR spectroscopy (showing a strong longitudinal LSPR peak >700 nm), TEM (for morphology), and DLS (for hydrodynamic size).
Table 2: Key Synthesis Parameters & LSPR Properties of Gold Nanostars
| Parameter | Role/Effect | Typical Value/Observation |
|---|---|---|
| AgNO₃ | Shape-directing agent; promotes anisotropic growth. | 10-100 μM in growth solution. |
| CTAB | Surfactant & stabilizing agent; binds to specific crystal facets. | 0.1 M in growth solution. |
| Ascorbic Acid | Mild reducing agent; reduces Au³⁺ to Au⁰ on seed surfaces. | 1-4 mM in growth solution. |
| LSPR Peak | Depends on core size, branch length, and tip sharpness. | Tunable from ~650 nm to >1200 nm. |
| Purification | Removes reactants and controls colloidal stability. | Centrifugation at 6000-10,000 rpm. |
| FOM (LSPR) | Figure of Merit (Sensitivity/FWHM) | 3-6 for well-defined nanostars. |
Critical Materials: Gold vs. Silver
The choice between gold and silver is fundamental and dictated by the specific plasmonic application.
Table 3: Comparative Properties of Gold and Silver for Plasmonics
| Property | Gold (Au) | Silver (Ag) | Implication for SPR/LSPR |
|---|---|---|---|
| Plasmon Resonance | Visible to NIR (520 nm & beyond) | Visible (~400 nm) | Au better for biological "tissue window" (650-900 nm). |
| Plasmon Quality (Q) | Moderate (higher damping) | Higher (sharper resonances) | Ag yields narrower LSPR peaks and higher local fields. |
| Chemical Stability | Excellent (inert, biocompatible) | Poor (tarnishes/oxidizes) | Au preferred for long-term/biomedical applications. |
| Functionalization | Excellent via Au-S chemistry | Good (requires careful surface control) | Au offers robust, stable bioreceptor immobilization. |
| Cost | High | Lower | Ag is more cost-effective for some disposable sensors. |
| Typical SPR Film | 47-50 nm thickness | 50-55 nm thickness | Ag film requires protective layer (e.g., alumina, SAM). |
The Scientist's Toolkit: Key Research Reagent Solutions
Table 4: Essential Materials and Reagents for SPR/LSPR Experiments
| Item | Function in Experiment | Typical Specification/Notes |
|---|---|---|
| HAuCl₄·3H₂O | Gold precursor for film deposition or nanoparticle synthesis. | ≥99.9% trace metals basis. Stored as 10-50 mM stock in water. |
| CTAB (Cetyltrimethylammonium bromide) | Surfactant for anisotropic nanoparticle synthesis (e.g., nanostars, nanorods). | Critical for shape control; requires purification. |
| AgNO₃ | Silver precursor for nanostar shape-directing or Ag film/nanostructure synthesis. | Light-sensitive; stored in dark. |
| 11-Mercaptoundecanoic acid (11-MUA) | Forms self-assembled monolayer (SAM) on Au for carboxyl-based biomolecule conjugation. | Enables EDC/NHS chemistry for ligand immobilization. |
| Piranha Solution | Cleans and hydroxylates glass/prism surfaces prior to metal deposition. | Caution: Highly corrosive, exothermic. H₂SO₄:H₂O₂ (3:1). |
| PBS with Surfactant (e.g., Tween 20) | Running buffer for SPR biosensing to reduce non-specific binding. | Commonly 0.01M phosphate, 0.138M NaCl, 0.0027M KCl, 0.05% Tween 20, pH 7.4. |
| PDMS (Sylgard 184) | Elastomer for fabricating microfluidic flow cells for SPR chips or LSPR sensing wells. | Mixed 10:1 base:curing agent, degassed, cured at 65°C. |
From Theory to Bench: Experimental Setups and Cutting-Edge Applications
Within a comprehensive thesis comparing Surface Plasmon Resonance (SPR) and Localized Surface Plasmon Resonance (LSPR), a precise understanding of conventional SPR instrumentation is foundational. SPR measures biomolecular interactions in real-time without labels, and its core hardware dictates its performance and applications in drug discovery and basic research. This guide details the essential components.
Core Instrumentation Components
Prism Couplers
The prism coupler enables the excitation of surface plasmons on a thin metal film (typically gold) using the Kretschmann configuration. Light is directed through the prism, undergoing total internal reflection at the prism-metal interface, generating an evanescent wave that couples with the electron oscillations in the metal film at a specific resonance angle.
Flow Cells
The flow cell is a microfluidic chamber mounted on the sensor chip. It delivers analyte in a continuous, pulse-free laminar flow over the ligand-functionalized surface. Key designs include:
- Single-channel: For basic kinetics.
- Dual-channel or Multi-channel: A reference channel subtracts bulk refractive index changes and instrument drift.
- Staggered or Serial flow: For concentration analysis or saving analyte.
Angle/Shift Detection Systems
The resonance condition is observed as a sharp dip in reflected light intensity. Two primary detection methods track changes in this condition due to biomolecular binding:
- Angle Interrogation: Monitors the angle of incidence at which resonance (minimum intensity) occurs. Binding events cause a measurable angular shift (Δθ).
- Wavelength Interrogation (Spectral): Uses a fixed angle and polychromatic light, monitoring the wavelength shift (Δλ) of the resonance dip.
- Intensity Interrogation: Measures intensity changes at a fixed angle near resonance.
Table 1: Comparison of SPR Interrogation Methods
| Interrogation Method | Measured Parameter | Typical Resolution | Advantages | Limitations |
|---|---|---|---|---|
| Angle | Δθ (Resonance Angle) | ~0.0001° | High sensitivity, well-established | Mechanically moving parts, slower scan |
| Wavelength | Δλ (Resonance Wavelength) | ~0.1 pm | No moving parts, robust alignment | Lower scan rates than fixed-angle |
| Intensity | ΔI (Reflected Intensity) | N/A | Simple, low-cost, fast | Non-linear, limited dynamic range |
Experimental Protocol: Standard Ligand-Amine Kinetics Analysis
Objective: Determine the kinetic rate constants (ka, kd) and affinity (KD) for an antibody-antigen interaction.
Materials (Scientist's Toolkit):
Table 2: Key Research Reagent Solutions
| Item | Function & Specification |
|---|---|
| CM5 Sensor Chip | Carboxymethylated dextran matrix on gold for covalent ligand immobilization. |
| HBS-EP Buffer | Running buffer (10mM HEPES, 150mM NaCl, 3mM EDTA, 0.05% v/v Surfactant P20, pH 7.4). Provides stable pH and ionic strength, reduces non-specific binding. |
| NHS/EDC Mix | 1-ethyl-3-(3-dimethylaminopropyl)carbodiimide (EDC) and N-hydroxysuccinimide (NHS). Activates carboxyl groups on the chip surface. |
| Ethanolamine-HCl | Quenches unreacted NHS-esters and deactivates the chip surface after ligand coupling. |
| 10 mM Glycine-HCl, pH 2.0 | Regeneration solution. Dissociates bound analyte to regenerate the ligand surface without denaturing it. |
Procedure:
- System Startup: Prime the instrument with filtered, degassed HBS-EP buffer.
- Baseline Establishment: Flow buffer over reference and sample flow cells at 10-30 µL/min until a stable baseline is achieved.
- Surface Activation: Inject a 1:1 mixture of NHS and EDC for 7 minutes.
- Ligand Immobilization: Immediately inject the antibody (ligand), diluted in 10 mM sodium acetate buffer (pH 4.5-5.5), over the sample flow cell for 5-10 minutes. Aim for a response unit (RU) increase of 5-100 RU (kinetics) or higher (affinity).
- Surface Deactivation: Inject 1M ethanolamine-HCl (pH 8.5) for 7 minutes to block remaining active esters.
- Kinetic Experiment:
- Association: Inject a series of antigen (analyte) concentrations (e.g., 0.78 nM to 100 nM) over both reference and ligand surfaces at 30 µL/min for 3 minutes.
- Dissociation: Switch back to buffer flow and monitor dissociation for 10 minutes.
- Regeneration: Inject Glycine-HCl (pH 2.0) for 30-60 seconds to remove all bound analyte.
- Re-equilibrate with buffer before the next concentration cycle.
- Data Analysis: Subtract reference cell data. Fit the resultant sensograms globally to a 1:1 Langmuir binding model using instrument software to calculate ka (association rate constant), kd (dissociation rate constant), and KD (kd/ka).
SPR Signal Generation and Detection Workflow
Diagram Title: SPR Signal Generation Pathway
SPR vs. LSPR: Instrumental Contrast
A key distinction in the SPR vs. LSPR thesis lies in instrumentation. SPR uses a continuous thin metal film and requires precise optical coupling (prisms, gratings) for plasmon excitation. LSPR utilizes nanostructured metal particles (e.g., nanospheres, triangles) where plasmons are excited by direct light illumination without the need for complex coupling optics. This fundamental difference leads to simpler, potentially miniaturizable systems for LSPR but generally higher sensitivity and more established quantitative models for conventional SPR.
Table 3: Core Instrumental Differences: SPR vs. LSPR
| Feature | Standard SPR | LSPR |
|---|---|---|
| Active Element | Planar, thin (~50 nm) gold film | Colloidal or fabricated nanoparticles (Au/Ag) |
| Excitation | Requires coupling (Prism, Grating) | Direct illumination (UV-Vis spectrometer) |
| Detection | Angle or wavelength shift of reflected light | Wavelength shift/extinction peak in transmission |
| Field Decay | ~200-300 nm into medium | ~10-30 nm (highly localized) |
| Typical Setup | Bench-top, integrated microfluidics | Can be plate-reader format or on-chip |
Experimental Protocol: LSPR Nanoparticle Shift Assay
Objective: Perform a label-free binding assay using gold nanosphere LSPR.
Procedure:
- Nanoparticle Functionalization: Incubate citrate-capped Au nanospheres (~40-80 nm) with a thiolated capture ligand (e.g., HS-PEG-X) overnight. Purify via centrifugation.
- Baseline Measurement: Load functionalized nanoparticles into a cuvette or well plate. Acquire a UV-Vis extinction spectrum (400-800 nm) to determine the initial LSPR peak wavelength (λ_max).
- Analyte Binding: Introduce the target analyte at varying concentrations to the nanoparticle solution.
- Incubation & Measurement: Incubate for a defined period (e.g., 15-30 min). Measure the UV-Vis spectrum after each addition.
- Data Analysis: Plot the shift in λ_max (Δλ) versus analyte concentration. Fit data to a binding isotherm (e.g., Langmuir) to determine apparent affinity.
Diagram Title: SPR vs LSPR Instrument Architecture
Thesis Context: SPR vs. LSPR Surface Plasmon Resonance (SPR) and Localized Surface Plasmon Resonance (LSPR) are pivotal label-free biosensing techniques. While SPR relies on propagating plasmon waves on thin metal films, measuring refractive index changes over micrometers, LSPR exploits the collective electron oscillations in metallic nanostructures (e.g., nanoparticles), confining the electromagnetic field to nanoscale volumes. This fundamental difference leads to distinct operational characteristics, making LSPR particularly suited for high spatial resolution, lower molecular weight detection, and simpler, cost-effective instrumentation compared to the bulk sensitivity and complex optics of traditional SPR.
Core Principles and Comparative Performance
LSPR sensing transduces a local refractive index change—caused by molecular binding at the nanoparticle surface—into a quantifiable shift in the extinction peak wavelength ((\Delta\lambda_{max})). The sensitivity ((S), nm/RIU) and figure of merit (FOM) are key metrics.
Table 1: Quantitative Comparison of SPR and LSPR Platforms
| Parameter | Conventional SPR (Biacore-type) | Colloidal Nanoparticle LSPR | Nanofabricated Chip LSPR |
|---|---|---|---|
| Sensing Volume | ~200 nm from surface (propagating wave) | <10 nm from particle surface (local field) | <20 nm from structure surface |
| Typical Sensitivity (S) | 2,000 - 10,000 nm/RIU | 100 - 500 nm/RIU | 200 - 1,000 nm/RIU |
| FOM (S/FWHM) | ~10-50 | ~1-5 | ~2-10 |
| Instrument Cost | Very High ($100k+) | Low ($10k-$50k) | Medium-High ($50k-$150k) |
| Sample Throughput | Moderate (multi-flow cell) | High (plate reader compatible) | High (array formats) |
| Detection Limit (Protein) | ~0.1-1 pM | ~1-10 pM | ~0.5-5 pM |
| Multiplexing Potential | Low-Moderate | Very High (spectral encoding) | High (spatial encoding) |
| Footprint | Benchtop | Microplate, portable | Chip, modular |
Key Experimental Protocols
Protocol 2.1: Synthesis and Functionalization of Colloidal Gold Nanospheres for LSPR
- Objective: To produce stable, citrate-capped Au nanoparticles (~40 nm) and functionalize them with a self-assembled monolayer (SAM) for biosensing.
- Materials: Hydrogen tetrachloroaurate(III) trihydrate (HAuCl₄·3H₂O), trisodium citrate dihydrate, thiolated polyethylene glycol (SH-PEG-COOH), ethanol, phosphate-buffered saline (PBS).
- Method:
- Synthesis (Turkevich method): Bring 100 mL of 1 mM HAuCl₄ to a boil under reflux. Rapidly add 10 mL of 38.8 mM sodium citrate. Continue heating and stirring until color stabilizes (ruby red, ~10 min). Cool to room temperature.
- Characterization: Verify size and monodispersity via TEM and UV-Vis spectroscopy ((\lambda_{max}) ~530 nm).
- Functionalization: Concentrate nanoparticles by centrifugation (8,000 RCF, 10 min). Resuspend in 1 mM SH-PEG-COOH in ethanol. Incubate overnight. Purify via two cycles of centrifugation and resuspension in PBS (pH 7.4).
- Activation: Prior to assay, activate terminal carboxyl groups with a 1:1 mixture of 0.4 M EDC and 0.1 M NHS in water for 15 minutes.
Protocol 2.2: Fabrication of Nanodisk LSPR Chips via Hole-Mask Colloidal Lithography
- Objective: To create periodic arrays of Au nanodisks on a glass substrate for chip-based LSPR sensing.
- Materials: Glass coverslips, polystyrene nanospheres (diameter ~100 nm), oxygen plasma etcher, thermal evaporator, positive photoresist, adhesion promoter.
- Method:
- Substrate Preparation: Clean glass coverslips in piranha solution (3:1 H₂SO₄:H₂O₂) CAUTION: Highly corrosive, rinse, and apply adhesion promoter.
- Mask Formation: Deposit a monolayer of polystyrene nanospheres via spin-coating. Use oxygen plasma etching to reduce sphere size, defining the mask "holes."
- Metal Deposition: Thermally evaporate a 2 nm Ti adhesion layer followed by a 20 nm Au layer.
- Lift-off: Dissolve the polystyrene mask and residual layers in solvent (e.g., acetone), leaving an array of isolated Au nanodisks.
- Functionalization: Immerse chip in 1 mM 11-mercaptoundecanoic acid (11-MUA) in ethanol overnight to form a carboxyl-terminated SAM.
Protocol 2.3: Standardized Binding Assay on a Nanofabricated Chip
- Objective: To quantify the binding kinetics of an antibody-antigen interaction using a functionalized LSPR chip.
- Materials: Functionalized LSPR chip, LSPR spectrometer/imaging system, target antibody, antigen solution, PBS-T (0.005% Tween-20), ethanolamine-HCl, glycine-HCl (pH 2.0).
- Method:
- Baseline: Mount chip in flow cell. Establish a stable baseline with PBS-T flow (20 µL/min) while monitoring (\lambda{max}).
- Ligand Immobilization: Inject EDC/NHS-activated antibody solution (10 µg/mL in sodium acetate buffer, pH 5.0) for 7 minutes. Deactivate with 1 M ethanolamine-HCl (pH 8.5) for 3 minutes.
- Analyte Binding: Inject antigen at varying concentrations (serial dilution in PBS-T) for 5-10 minutes per injection, followed by PBS-T wash.
- Regeneration: Strip bound analyte with 10 mM glycine-HCl (pH 2.0) for 30 seconds to regenerate the surface.
- Analysis: Fit real-time (\Delta\lambda{max}) data to a Langmuir binding model to extract association ((ka)) and dissociation ((kd)) rate constants.
Visualization: Signaling Pathways and Workflows
LSPR Biosensing Transduction Pathway
Comparative Experimental Workflows
The Scientist's Toolkit: Essential Research Reagents & Materials
Table 2: Key Reagent Solutions for LSPR Experiments
| Item | Function / Role | Key Consideration / Example |
|---|---|---|
| Gold Chloride (HAuCl₄) | Precursor for synthesis of Au nanoparticles & films. | High-purity (>99.9%) for reproducible nanostructure morphology. |
| Shape-Directing Agents | Control nanoparticle morphology during growth. | CTAB for nanorods; ascorbic acid as a mild reducing agent. |
| Functional Thiols | Form self-assembled monolayers (SAMs) on Au surfaces. | 11-MUA (COOH), SH-PEG (anti-fouling), biotin-terminated thiol. |
| Crosslinker Chemistry | Covalently immobilize biomolecules on SAMs. | EDC/NHS for carboxyl-amine coupling. Fresh preparation required. |
| Blocking Buffers | Minimize non-specific adsorption to sensor surface. | BSA (1%), casein, or commercial protein-free blockers. |
| Regeneration Buffers | Dissociate bound analyte without damaging the ligand. | Low pH (Glycine-HCl), high pH (NaOH), or high salt. |
| Index-Matching Oils/Fluids | For prism-coupled LSPR chip setups. | Must match substrate RI to minimize scattering losses. |
| Calibration Standards | Determine bulk refractive index sensitivity (S). | Aqueous glycerol or sucrose solutions of known RI. |
Surface Plasmon Resonance (SPR) is a label-free, real-time biosensing technology central to quantifying biomolecular interactions. Its core strength lies in directly measuring the association (kon) and dissociation (koff) rate constants, from which the equilibrium dissociation constant (KD = koff/kon) is derived with high accuracy. This capability must be understood in contrast to Localized Surface Plasmon Resonance (LSPR). While both exploit plasmonic phenomena, traditional SPR employs a continuous thin metal film, generating an evanescent field extending hundreds of nanometers, ideal for monitoring large macromolecular complexes and detailed kinetic profiling. LSPR, based on nanostructured metal surfaces, has a shorter decay length (<50 nm), making it more sensitive to smaller molecules and refractive index changes closer to the surface but generally less established for rigorous, high-accuracy kinetic analysis. This whitepaper details the technical foundations of SPR for precise kinetic measurement.
Core Principles: From Sensorgram to Kinetic Parameters
An SPR experiment measures the change in the angle of reflected light (resonance angle) as molecules bind to or dissociate from a functionalized sensor surface. This signal, plotted as response units (RU) versus time, yields a sensorgram.
- Association Phase: Analyte is flowed over the immobilized ligand. The binding curve's shape depends on kon, analyte concentration, and mass transport.
- Dissociation Phase: Buffer alone is flowed, and the decay of the signal informs koff.
- Equilibrium Analysis: The plateau response at different analyte concentrations is used to calculate KD independently.
The 1:1 binding model is described by the differential equation: dR/dt = kon * C * (Rmax - R) - koff * R where R is the response, Rmax is the maximum binding capacity, and C is the analyte concentration.
Experimental Protocols for Kinetic Characterization
Protocol 1: Immobilization of Ligand (e.g., an Antibody) via Amine Coupling
- Surface Activation: Inject a 1:1 mixture of 0.4 M EDC and 0.1 M NHS over the carboxymethylated dextran sensor chip for 7 minutes.
- Ligand Injection: Dilute ligand to 10-50 µg/mL in 10 mM sodium acetate buffer (pH 4.5-5.5). Inject for 7 minutes to achieve a desired immobilization level (typically 5-10 kRU for kinetics).
- Blocking: Inject 1 M ethanolamine-HCl (pH 8.5) for 7 minutes to deactivate remaining ester groups.
- Conditioning: Perform 2-3 injection cycles of regeneration solution (e.g., 10 mM Glycine-HCl, pH 2.0) to stabilize the surface.
Protocol 2: Multi-Cycle Kinetic Analysis
- Sample Preparation: Prepare a 3-5-fold serial dilution of analyte in running buffer (HBS-EP+: 10 mM HEPES, 150 mM NaCl, 3 mM EDTA, 0.05% v/v Surfactant P20, pH 7.4). Include a zero-concentration (buffer) sample for double-referencing.
- Binding Cycles:
- Baseline: Equilibrate with running buffer for 60-120 sec.
- Association: Inject analyte at a constant flow rate (typically 30-100 µL/min) for 60-300 sec, monitoring real-time binding.
- Dissociation: Switch to running buffer flow for 300-1800 sec to monitor complex decay.
- Regeneration: Inject a regeneration solution (e.g., 10 mM Glycine, pH 2.0) for 30-60 sec to remove all bound analyte without damaging the immobilized ligand.
- Replicate: Repeat Step 2 for all analyte concentrations in random order.
Protocol 3: Single-Cycle Kinetic Analysis (SCK) Used for low-abundance or unstable analytes. A single sample injection of sequentially increasing concentrations without regeneration between steps.
- Perform ligand immobilization as in Protocol 1.
- Establish a stable baseline.
- Inject the lowest analyte concentration for a fixed association time (e.g., 3 min).
- Without regenerating, switch the flow to the next higher analyte concentration for the same duration, building a stepped sensorgram.
- Repeat step 4 for all concentrations.
- Initiate a final, long dissociation phase in buffer (30-60 min).
Data Analysis and Quantitative Output
Global fitting of the sensorgram data to a 1:1 binding model across all concentrations simultaneously extracts kon and koff. KD is calculated from their ratio and can be cross-validated by steady-state analysis of the equilibrium binding levels.
Table 1: Representative SPR Kinetic Data for a Model Antibody-Antigen Interaction
| Analyte Conc. (nM) | kon (1/Ms) | koff (1/s) | KD (nM) | Method |
|---|---|---|---|---|
| 1.56, 3.125, 6.25, 12.5, 25 | 2.1 x 10^5 | 1.05 x 10^-3 | 5.0 | Multi-Cycle Kinetic |
| 3.125, 6.25, 12.5, 25, 50 | 1.9 x 10^5 | 0.99 x 10^-3 | 5.2 | Single-Cycle Kinetic (SCK) |
| 1.56, 3.125, 6.25, 12.5, 25 | N/A | N/A | 5.1 | Steady-State Equilibrium |
Table 2: Key Factors Enabling High Accuracy in SPR Kinetics
| Factor | Impact on Accuracy | Typical Optimization |
|---|---|---|
| Mass Transport | If binding is too fast, limited by analyte diffusion to surface. | Increase flow rate (≥50 µL/min); use lower ligand density (<50 Rmax). |
| Ligand Immobilization | Heterogeneity or high density can cause avidity, distorting kinetics. | Use directed coupling (e.g., capture, His-tag) for uniform orientation; aim for low Rmax. |
| Surface Regeneration | Incomplete or harsh regeneration introduces carryover or ligand damage. | Test multiple regeneration buffers; use minimal effective contact time. |
| Double Referencing | Removes systematic noise from bulk refractive index and injection artifacts. | Subtract signals from a reference surface and a blank buffer injection. |
| Data Quality | Poor signal-to-noise limits fitting precision. | Use high-purity reagents; sufficient dissociation time; replicate measurements. |
The Scientist's Toolkit: Key Research Reagent Solutions
Table 3: Essential Materials for SPR Kinetic Experiments
| Item | Function | Example/Notes |
|---|---|---|
| SPR Instrument | Optical system to generate and monitor the plasmon resonance. | Biacore 8K (Cytiva), Sierra SPR (Bruker), Pioneer (Molecular Devices). |
| Sensor Chip | Gold surface with a functional matrix (e.g., carboxymethylated dextran). | Series S CM5 chip (Cytiva). Hydrogel provides a biocompatible, low non-specific binding environment. |
| Coupling Reagents | To covalently immobilize the ligand onto the sensor chip matrix. | EDC (1-ethyl-3-(3-dimethylaminopropyl)carbodiimide) and NHS (N-hydroxysuccinimide) for amine coupling. |
| Running Buffer | Continuous flow buffer that maintains pH, ionic strength, and reduces non-specific binding. | HBS-EP+ (HEPES Buffered Saline with EDTA and surfactant). Surfactant P20 (0.05%) is critical. |
| Regeneration Solution | Gentle yet effective solution to remove bound analyte between cycles. | 10 mM Glycine-HCl, pH 2.0-3.0; 10 mM NaOH; 0.5% SDS. Must be empirically determined. |
| Capture Ligand | For site-directed immobilization (e.g., anti-His, anti-Fc antibodies). | Anti-human Fc antibody immobilized on chip to capture monoclonal antibodies. |
| Analysis Software | To globally fit sensorgram data to kinetic binding models. | Biacore Insight Evaluation Software, Scrubber (BioLogic Software), TraceDrawer. |
Visualizations of Workflows and Principles
Title: SPR Multi-Cycle Kinetic Experiment Workflow
Title: SPR vs LSPR Field Penetration & Kinetics Context
Title: SPR Kinetic Data Analysis & Validation Pathway
Surface Plasmon Resonance (SPR) and Localized Surface Plasmon Resonance (LSPR) are both label-free, real-time biosensing techniques. The core thesis differentiating them lies in their operational principles and resultant analytical niches. SPR generates propagating plasmon waves along a thin metal film, measuring changes in the refractive index over a long decay length (∼200-300 nm), making it exquisitely sensitive to bulk changes and mass. In contrast, LSPR is excited on nanostructured metal surfaces (e.g., nanospheres, nanotriangles), confining the electromagnetic field to a much shorter decay length (∼5-20 nm). This fundamental difference dictates LSPR's unique suitability for probing rapid, lower-affinity interactions and screening small molecules, as it is primarily sensitive to events occurring within its immediate nanoscale environment.
Technical Foundations: Why LSPR Excels for Kinetics and Small Molecules
The LSPR extinction peak (wavelength maximum, λmax) is acutely sensitive to local refractive index changes. Its short sensing volume offers distinct advantages:
- Reduced Mass-Transport Limitations: Analyte diffuses more readily into the sensing zone, enabling more accurate measurement of fast association rates (kon).
- Insensitivity to Bulk Solvent Effects: The short decay length minimizes signal drift from bulk refractive index changes, allowing for stringent buffer conditions and DMSO tolerance crucial for small molecule screening.
- Enhanced Sensitivity to Small Molecules: The signal is dominated by binding events within the short decay length, reducing background noise from distal bulk effects. The binding of a small molecule (<500 Da) induces a measurable Δλmax proportional to the complex's polarizability.
Table 1: Comparative Operational Parameters of SPR vs. LSPR
| Parameter | SPR (Biacore-type) | LSPR (Nanostructure-based) |
|---|---|---|
| Sensing Field Decay Length | 200-300 nm | 5-20 nm |
| Primary Measured Signal | Angle shift (Resonance Units, RU) | Wavelength shift (Δλmax in nm) |
| Typical Assay Footprint | Flow cell, high surface area | Low-volume well plate or microfluidic chip |
| DMSO Tolerance | Moderate (often <3-5%) | High (can be >10%) |
| Sample Consumption | Moderate (tens of µL/min) | Low (single µL/min or static) |
| Kinetic Range (kon) | Up to ~107 M-1s-1 | Can exceed 108 M-1s-1 |
| Affinity (KD) Range | Best for high affinity (pM-nM) | Excellent for medium-low affinity (µM-nM) |
Experimental Protocols for Key Applications
Protocol 3.1: Measuring Fast Kinetics of a Low-Affinity Protein-Protein Interaction
Objective: Determine the association (kon) and dissociation (koff) rate constants for a transient complex with an expected KD in the µM range.
Materials: See The Scientist's Toolkit below. Method:
- Sensor Functionalization: Inject 50 µL of 0.2 mg/mL NeutrAvidin in PBS into an LSPR well with a biotinylated sensor surface. Incubate for 10 min. Wash with PBS.
- Ligand Capture: Inject 50 µL of 50 nM biotinylated protein (Ligand A) in HBS-EP+ buffer. Incubate for 5 min. A stable baseline shift confirms capture.
- Kinetic Binding Analysis:
- Prepare a 3-fold dilution series of Analyte B (e.g., 0.5, 1.5, 4.5, 13.5 µM) in running buffer (HBS-EP+).
- For each concentration, perform a binding cycle: a. Association: Inject analyte at high flow rate (e.g., 100 µL/min) for 60-90 seconds. Monitor Δλmax in real-time. b. Dissociation: Switch to buffer flow for 120-180 seconds.
- Regenerate the surface with a 30-second pulse of 10 mM Glycine-HCl, pH 2.0.
- Data Analysis: Fit the sensorgram (Δλmax vs. Time) for all concentrations globally to a 1:1 Langmuir binding model using the instrument's software to extract kon and koff. Calculate KD = koff/kon.
Protocol 3.2: Primary Screen for Small Molecule Inhibitors
Objective: Identify hits that bind to a target protein immobilized on an LSPR sensor.
Materials: See The Scientist's Toolkit below. Method:
- Reference and Active Surface Preparation: Use a dual-channel sensor chip.
- Channel 1 (Active): Functionalize with NeutrAvidin and capture biotinylated target protein (Protocol 3.1, steps 1-2).
- Channel 2 (Reference): Functionalize with NeutrAvidin only.
- Equilibration: Flow screening buffer (e.g., PBS with 0.01% Tween-20 and 5% DMSO) over both channels until baseline stabilizes.
- Screening Run:
- For each compound in the library (typically at 10-50 µM in screening buffer), perform a 2-minute injection at a low flow rate (20 µL/min).
- Record the differential signal (Active Δλmax - Reference Δλmax) at the end of the injection.
- Regenerate with a quick buffer pulse between compounds if necessary.
- Hit Identification: Normalize responses. A hit is typically defined as a signal >3 standard deviations from the mean of negative controls (DMSO-only injections).
Table 2: Typical LSPR Performance Metrics in Screening
| Metric | Value/Outcome | Implication |
|---|---|---|
| Throughput | 100-500 compounds/day (single channel) | Suitable for focused libraries |
| Minimum Detectable Δλmax | 0.1 nm | Sufficient for small molecules |
| Required Protein Amount | ~1 µg per sensor spot | Enables screening with scarce targets |
| Typical Z'-Factor (for robust screens) | 0.5 - 0.8 | Indicates excellent assay quality |
Visualizing Workflows and Principles
Diagram Title: LSPR Experimental Workflow and Detection Principle
Diagram Title: Core Technical Contrast Between SPR and LSPR
The Scientist's Toolkit: Key Research Reagent Solutions
| Item | Function in LSPR Experiments | Example/Note |
|---|---|---|
| Gold Nanostructure Sensor Chips | The core transduction element. Shape (triangles, rods, spheres) and size tune the LSPR peak. | Often gold nanotriangles on glass substrate; commercially available from NanoComposix, Cytiva. |
| Biotinylation Reagent Kit | Labels the target protein for specific, oriented immobilization onto streptavidin surfaces. | EZ-Link NHS-PEG4-Biotin (Thermo Fisher). PEG spacer reduces steric hindrance. |
| High-Purity Streptavidin/NeutrAvidin | Forms a robust capture layer on the sensor for biotinylated ligands. | NeutrAvidin (Thermo Fisher) is often preferred for reduced non-specific binding vs. Streptavidin. |
| Bioinert Running Buffer | Maintains protein stability and minimizes non-specific binding during analysis. | HBS-EP+ (10 mM HEPES, 150 mM NaCl, 3 mM EDTA, 0.05% P20 surfactant, pH 7.4). |
| Regeneration Solution | Removes bound analyte without damaging the immobilized ligand for sensor reuse. | Low pH (10 mM Glycine-HCl, pH 2.0-2.5) or high salt solutions. Must be optimized per target. |
| DMSO-Tolerant Buffer Additives | Enables screening of small molecule libraries dissolved in DMSO. | Use of Tween-20 (0.01-0.05%) or CHAPS helps maintain stability at high DMSO (5-10%). |
| Reference Protein | A non-interacting protein used to functionalize a reference channel for differential measurement. | Bovine Serum Albumin (BSA) or an irrelevant, matched isotype antibody. |
| Calibration Solution | Used to correlate Δλmax shift with a known refractive index change. | Glycerol or NaCl solutions of known concentration. |
Within the ongoing research discourse comparing Surface Plasmon Resonance (SPR) and Localized Surface Plasmon Resonance (LSPR), a clear understanding of their distinct physical principles is critical for selecting the optimal platform for a given application. SPR relies on the propagation of charge density waves along a continuous metal film (typically gold), producing a sharp resonance dip in the reflected light spectrum sensitive to refractive index changes within an evanescent field (~200-300 nm). In contrast, LSPR exploits collective electron oscillations confined to nanostructures (e.g., gold nanoparticles, nanorods), resulting in a strong, localized absorption or scattering peak. The key differentiating factors are sensitivity (SPR generally offers superior bulk refractive index sensitivity; RIU), spatial resolution (LSPR excels due to its nanoscale confinement), and instrumentation complexity (LSPR systems are often simpler and more cost-effective). This whitepaper provides a technical guide to their current applications, grounded in this comparative framework.
Drug Discovery: Kinetic Profiling and Lead Optimization
Core Application
Both SPR and LSPR are indispensable for characterizing the binding kinetics (association rate, kon; dissociation rate, koff) and affinity (equilibrium dissociation constant, KD) of small molecule or biologic drug candidates to immobilized targets. SPR remains the industry gold standard for high-precision kinetic analysis. LSPR platforms are emerging for high-throughput primary screening and intracellular target engagement studies due to their compatibility with miniaturization and imaging.
Detailed Protocol: SPR-Based Kinetic Characterization of a Monoclonal Antibody
Objective: Determine the kinetic parameters of an antibody (mAb) binding to its immobilized antigen. Sensor Chip: Carboxymethylated dextran (CM5) gold chip. Instrument: Biacore 8K or equivalent. Procedure:
- System Preparation: Prime the instrument with HBS-EP+ running buffer (10 mM HEPES, 150 mM NaCl, 3 mM EDTA, 0.05% v/v Surfactant P20, pH 7.4).
- Surface Functionalization:
- Activate the dextran matrix on flow cells 1 and 2 with a 7-minute injection of a 1:1 mixture of 0.4 M EDC and 0.1 M NHS.
- Immobilization: Dilute the antigen to 10 µg/mL in 10 mM sodium acetate buffer (pH 5.0). Inject over flow cell 2 for 7 minutes to achieve a target immobilization level of 50-100 Response Units (RU). Flow cell 1 serves as the reference.
- Blocking: Deactivate remaining esters with a 7-minute injection of 1 M ethanolamine-HCl (pH 8.5).
- Kinetic Titration:
- Prepare a 3-fold dilution series of the mAb analyte (e.g., 100 nM to 0.37 nM) in running buffer.
- For each concentration, inject over the reference and antigen surfaces at a flow rate of 30 µL/min for an association phase of 3 minutes, followed by a dissociation phase of 5-10 minutes in buffer.
- Regenerate the surface with a 30-second pulse of 10 mM glycine-HCl (pH 2.0) without damaging the immobilized antigen.
- Data Analysis: Double-reference the data (subtract both reference flow cell and blank buffer injections). Fit the sensograms globally to a 1:1 Langmuir binding model using the instrument's software to extract kon, koff, and calculate KD (koff/kon).
Key Quantitative Comparison
Table 1: Performance Metrics in Drug Discovery
| Parameter | SPR (Biacore 8K) | LSPR (NanoSPR6 Array) |
|---|---|---|
| Affinity Range (KD) | 1 mM - 1 pM | 100 µM - 100 pM |
| Throughput | ~1000 samples/day (multi-channel) | ~10,000 samples/day (imaging-based) |
| Sample Consumption | ~50-200 µL (microfluidics) | < 10 µL (droplet microfluidics) |
| Typical Sensitivity Shift | 0.1 - 100 RU per ng/cm² | 1-5 nm peak shift per 10 nm protein layer |
| Key Advantage | Unmatched kinetic precision, label-free | Ultra-high throughput, lower cost per datapoint |
Protein-Protein Interaction (PPI) Network Mapping
Core Application
SPR is extensively used for mapping direct, binary PPIs, determining stoichiometry, and identifying competitive or allosteric inhibitors. LSPR, particularly in a single nanoparticle imaging format, is powerful for probing PPIs in complex cellular environments or on membrane surfaces, providing spatial context.
Detailed Protocol: LSPR for Probing Membrane Protein Interactions
Objective: Monitor the binding of a cytosolic protein to a membrane receptor presented on a nanoparticle-supported lipid bilayer. Materials: Citrate-capped gold nanorods (AuNRs, aspect ratio 3.5, LSPR peak ~750 nm), synthetic lipids. Procedure:
- Nanoparticle Functionalization:
- Centrifuge AuNRs (OD ~2) and resuspend in 10 mM MES buffer (pH 6.0).
- Incubate with 1 mM SH-PEG2000-Biotin for 1 hour. Purify by centrifugation to remove excess thiols.
- Membrane Assembly:
- Form small unilamellar vesicles (SUVs) from a lipid mix containing 99% DOPC and 1% Biotinyl-Cap-PE.
- Fuse SUVs onto the PEGylated AuNR surface to form a fluid lipid bilayer.
- Introduce 0.1 mg/mL NeutrAvidin, followed by a biotinylated extracellular domain of the receptor protein.
- LSPR Binding Assay:
- Monitor the LSPR peak shift (λmax) of individual AuNRs via darkfield microscopy spectroscopy.
- Introduce the cytosolic protein analyte at varying concentrations into the flow chamber.
- Track the real-time Δλmax for >100 single nanoparticles to generate binding curves and assess heterogeneity.
Visualization: PPI Study Workflow
Diagram Title: LSPR Workflow for Membrane Protein Interaction Studies
Diagnostic Assay Development
Core Application
SPR is used for developing "label-free" clinical immunoassays (e.g., for biomarkers like CRP or cytokines) on arrayed surfaces. LSPR drives the development of point-of-care (POC) and multiplexed lateral flow assays due to its intense colorimetric output, robustness, and simplicity. Plasmonic nanoparticles serve as both the detection probe and signal amplifier.
Detailed Protocol: Multiplexed LSPR Lateral Flow Assay
Objective: Detect two cardiac biomarkers (Myoglobin and cTnI) simultaneously in serum. Materials: Conjugate pads, nitrocellulose membrane, gold nanospheres (AuNS, 40 nm) and gold nanorods (AuNR, 650 nm), test line antibodies. Procedure:
- Nanoprobe Preparation:
- Conjugate AuNS to anti-Myoglobin mAb and AuNR to anti-cTnI mAb via passive adsorption (pH 8.5) followed by BSA blocking.
- Dispense conjugates onto the conjugate pad and dry.
- Strip Assembly:
- Dispense anti-Myoglobin (Test Line 1) and anti-cTnI (Test Line 2) antibodies at distinct zones on the membrane.
- Dispense a species-specific anti-IgG as the control line.
- Assay Execution:
- Apply 80 µL of serum sample to the sample pad.
- Allow the sample to migrate via capillary action (~15 minutes).
- Detection: Visual readout via distinct colors (AuNS: red; AuNR: blue). Quantitative readout via a handheld scanner measuring reflectance at characteristic wavelengths.
Visualization: Diagnostic Assay Formats
Diagram Title: Decision Logic for SPR vs. LSPR Diagnostic Platforms
Environmental Sensing
Core Application
LSPR dominates this field due to the portability of nanoparticle-based sensors. Functionalized plasmonic nanoparticles detect contaminants (heavy metals, pesticides, pathogens) via aggregation-induced color shifts. SPR is used in laboratory settings for monitoring the adsorption of environmental analytes onto sensor surfaces with high quantification accuracy.
The Scientist's Toolkit: Research Reagent Solutions
Table 2: Essential Materials for Featured SPR/LSPR Experiments
| Item | Function | Example Supplier/Product |
|---|---|---|
| SPR Sensor Chip (CM5) | Gold surface with a carboxymethylated dextran hydrogel for covalent ligand immobilization via amine coupling. | Cytiva Series S Sensor Chip CM5 |
| EDC & NHS | Crosslinking reagents for activating carboxyl groups on the sensor chip surface. | Thermo Fisher Pierce EDC (No-Weigh) |
| HBS-EP+ Buffer | Standard running buffer for SPR; provides ionic strength, pH control, and reduces non-specific binding. | Cytiva BR100669 |
| Gold Nanorods (AuNR) | Anisotropic LSPR nanoparticles with tunable longitudinal peak; used for sensing and multiplexing. | nanoComposix BioReady Gold Nanorods |
| SH-PEG2000-Biotin | Thiol-terminated polyethylene glycol linker with biotin; creates an anti-fouling monolayer on Au for bioconjugation. | BroadPharm BHQ-2102 |
| NeutrAvidin | A deglycosylated avidin derivative for high-affinity, low non-specific binding capture of biotinylated ligands. | Thermo Fisher Scientific A2666 |
| Supported Lipid Bilayer Kit | Pre-formed vesicles for creating fluid membrane environments on sensors. | Avanti Polar Lipids 160201 |
| Lateral Flow Components | Pads, membranes, and backing cards for rapid test assembly. | Millipore Sigma Hi-Flow Plus Assembly Kit |
Maximizing Performance: Practical Solutions for SPR and LSPR Challenges
This whitepaper provides an in-depth technical guide to three prevalent artifacts in Surface Plasmon Resonance (SPR) biosensing, a core technology in biomolecular interaction analysis. The analysis is framed within the context of a broader research thesis comparing SPR with Localized Surface Plasmon Resonance (LSPR). While SPR relies on propagating plasmons on a continuous metal film, LSPR utilizes localized plasmons on nanostructures, leading to fundamental differences in sensitivity, spatial resolution, and susceptibility to the artifacts discussed herein. Understanding these artifacts is critical for researchers, scientists, and drug development professionals to generate reliable binding kinetics and affinity data.
Bulk Refractive Index Shift
This artifact arises from changes in the refractive index (RI) of the buffer solution flowing over the sensor surface, independent of any specific binding event. It is a primary confounding factor in SPR measurements.
Physical Basis: The SPR angle (or wavelength, in spectral SPR) is sensitive to the dielectric constant of the medium within the evanescent field (~200-300 nm from the surface). Fluctuations in buffer composition, temperature, or solute concentration alter the bulk RI, causing a signal shift indistinguishable from a binding signal.
Common Causes:
- Buffer mismatches between running buffer and analyte sample.
- Inadequate temperature equilibration or control.
- Changes in DMSO concentration in compound screening.
- Air bubbles or particulates in the microfluidic system.
Quantitative Data:
Table 1: Typical Refractive Index Increments (dn/dc)
| Solute / Condition | Refractive Index Increment (RIU per mg/mL or °C) | Notes |
|---|---|---|
| Most Proteins | ~0.185 RIU·mL/g | Standard value for concentration determination. |
| NaCl in Water | ~1.7 x 10⁻⁴ RIU per 1 mM | Major contributor to buffer mismatches. |
| DMSO | ~ -1.8 x 10⁻⁴ RIU per 1% v/v | Negative RI shift relative to aqueous buffer. |
| Temperature (Water) | ~ -1 x 10⁻⁴ RIU per °C | Critical for label-free assays. |
Experimental Protocol for Detection & Correction:
- Reference Channel/Surface Use: The standard methodology involves using a reference flow cell with a non-reactive surface (e.g., dextran without ligand, blocked surface). The signal from the reference channel is subtracted from the active channel in real-time.
- Buffer Calibration & Blank Injection: Precisely match the running buffer and sample buffer (analyte diluted in running buffer). Perform regular "blank" injections of running buffer or buffer with the matching DMSO concentration.
- Dual-Wavelength Referencing: Some instruments use two light sources. The primary wavelength is SPR-sensitive; the secondary wavelength is minimally sensitive to RI changes but sensitive to bulk effects. The secondary signal corrects the primary signal in real-time.
Nonspecific Binding (NSB)
NSB refers to the adsorption of analyte or other components (e.g., contaminants, aggregates) to the sensor surface or matrix through interactions other than the specific ligand-receptor pairing of interest.
Impact: NSB increases background signal, obscures true binding kinetics, reduces signal-to-noise ratio, and can lead to false positives or inaccurate kinetic constants.
Common Causes:
- Hydrophobic or electrostatic interactions with the sensor chip matrix (e.g., dextran, carboxymethylated surface).
- Capture of protein aggregates on the surface.
- Interaction with the immobilization chemistry (e.g., streptavidin chip).
Experimental Protocol for Mitigation:
- Surface Blocking: After ligand immobilization, inject a solution of an inert, non-interacting protein (e.g., 0.1% BSA, 0.1% casein) or surfactant (e.g., 0.05% Tween 20) for 5-7 minutes to passivate unreacted groups.
- Optimized Running Buffer: Include additives to minimize electrostatic/hydrophobic interactions.
- Ionic Strength: 150-250 mM NaCl to shield charges.
- Surfactant: 0.005-0.05% v/v Polysorbate 20 (Tween 20).
- Carrier Protein: 0.1% BSA (ensure it doesn't interact with system).
- Regeneration Scrutiny: Analyze the baseline after regeneration. Incomplete return to baseline often indicates accumulated NSB.
- Control Surfaces: Always run analyte over a reference surface with no ligand or an irrelevant ligand. The signal on this surface quantifies NSB.
Table 2: Common Nonspecific Binding Mitigation Reagents
| Reagent | Typical Concentration | Function |
|---|---|---|
| BSA (Bovine Serum Albumin) | 0.1% (w/v) | Blocks hydrophobic and charged sites via non-specific adsorption. |
| Casein | 0.1-1.0% (w/v) | Effective blocking protein, often used in antibody assays. |
| Polysorbate 20 (Tween 20) | 0.005-0.05% (v/v) | Non-ionic surfactant reduces hydrophobic interactions. |
| Carboxymethyl Dextran | N/A (surface matrix) | Hydrophilic, low-fouling polymer that forms the basis of most SPR chips. |
| Ethanolamine-HCl | 1.0 M, pH 8.5 | Common blocking agent for NHS/EDC chemistry, deactivates esters. |
Surface Regeneration Issues
Regeneration involves removing bound analyte to restore the ligand surface for a new cycle without damaging the immobilized ligand. Incomplete or harsh regeneration is a major source of experimental variability.
Challenges:
- Incomplete Regeneration: Leads to ligand site heterogeneity, decreasing response in subsequent cycles and distorting kinetic analysis.
- Ligand Degradation: Overly harsh conditions denature or strip the ligand from the surface, causing a continuous decline in binding capacity.
Experimental Protocol for Optimization:
- Scouting Regeneration Conditions: Perform a ligand-analyte binding experiment followed by a series of short (30-60 sec) injections of candidate regeneration solutions in order of increasing stringency.
- Assessment Criteria: The ideal condition returns the response unit (RU) to within ±1-2 RU of the original baseline and maintains stable ligand activity over ≥5 cycles.
- Common Regeneration Solutions:
- Mild: 10-100 mM Glycine-HCl, pH 2.0-3.5; 10 mM NaOH.
- Moderate: 0.5-3 M MgCl₂; 1-3 M Guanidine-HCl.
- Harsh: 10-100 mM HCl; 10-100 mM Phosphoric acid; 1% SDS.
- Stabilization: For delicate ligands, a stabilization buffer (e.g., with 1-5 mM CaCl₂ for calcium-dependent interactions) can be flowed after regeneration to restore native conformation.
Table 3: Common Surface Regeneration Solutions
| Solution | Typical Range | Primary Mechanism | Application Notes |
|---|---|---|---|
| Glycine-HCl | 10-100 mM, pH 1.5-3.0 | Disrupts electrostatic and hydrogen bonds. | First-line scouting reagent for antibodies/antigens. |
| Sodium Hydroxide (NaOH) | 1-100 mM | Hydrolysis, charge repulsion. | Effective for many protein-protein interactions. |
| Magnesium Chloride (MgCl₂) | 0.5-3 M | Disrupts ionic interactions, high ionic strength. | Useful for DNA-protein or charged interactions. |
| Guanidine Hydrochloride | 1-6 M | Protein denaturant, disrupts hydrophobic cores. | For high-affinity, stable complexes. Risks ligand denaturation. |
| Sodium Dodecyl Sulfate (SDS) | 0.01-1% (w/v) | Ionic detergent, solubilizes proteins. | Very harsh. Use only for robust ligands or chip cleaning. |
The Scientist's Toolkit: Essential Research Reagent Solutions
Table 4: Key Reagents for SPR Artifact Management
| Item | Function & Rationale |
|---|---|
| HBS-EP+ Buffer | Standard running buffer (10 mM HEPES, 150 mM NaCl, 3 mM EDTA, 0.05% P20). Provides pH stability, ionic strength, and surfactant to minimize NSB. |
| Series S Sensor Chip CM5 | Gold sensor chip with a carboxymethylated dextran matrix. The standard workhorse for amine coupling of ligands. |
| NHS/EDC Crosslinkers | 1-Ethyl-3-(3-dimethylaminopropyl)carbodiimide (EDC) and N-hydroxysuccinimide (NHS) for activating carboxyl groups for ligand amine coupling. |
| Ethanolamine-HCl | Blocks excess NHS esters after ligand immobilization, preventing uncontrolled NSB to the activated surface. |
| Regeneration Scouting Kit | Commercial kits containing a panel of buffers (e.g., glycine pH 1.5-3.0, NaOH, MgCl₂) for systematic regeneration optimization. |
| Surfactant P20 (Polysorbate 20) | Pre-formulated additive to reduce NSB via hydrophobic interaction blocking. |
| DMSO-Calibrated Calibration Solution | For compound screening, a solution with matched DMSO concentration to correct for RI shifts from sample stocks. |
| Bovine Serum Albumin (BSA) | A versatile blocking agent for passivating surfaces post-immobilization or in sample diluent. |
Visualizations
Diagram Title: SPR Artifacts and Their Impact on Data Quality
Diagram Title: SPR vs LSPR Sensing & Artifact Susceptibility
Diagram Title: SPR Workflow with Integrated Artifact Checkpoints
This technical guide is framed within a broader thesis examining the fundamental differences between Surface Plasmon Resonance (SPR) and Localized Surface Plasmon Resonance (LSPR). While SPR utilizes propagating plasmon waves on continuous metallic films, LSPR relies on non-propagating excitations in discrete metallic nanoparticles (NPs). This distinction makes LSPR biosensors highly sensitive to nanoscale changes in the local dielectric environment but also introduces unique stability challenges. The performance and reliability of LSPR-based applications in drug development and diagnostics are critically dependent on mitigating three primary stability concerns: nanoparticle aggregation, oxidation, and substrate effects.
Nanoparticle Aggregation
Aggregation is the irreversible clustering of nanoparticles due to the loss of colloidal stability, leading to a dramatic and unpredictable shift in the LSPR peak and a loss of signal fidelity.
Mechanism: Van der Waals attractions drive NPs together. Stability is maintained by electrostatic repulsion (via surface charge) or steric hindrance (via polymer coatings). Changes in ionic strength, pH, or the introduction of bridging molecules can collapse this repulsive barrier.
Quantitative Impact of Aggregation: Table 1: LSPR Spectral Shifts Due to Controlled Aggregation (Citrate-capped Au NPs, 40 nm)
| Aggregating Agent (NaCl) Concentration | LSPR Peak Wavelength (nm) | Peak Broadening (FWHM, nm) | Optical Density Change |
|---|---|---|---|
| 0 mM (Stable) | 528 ± 2 | 50 ± 3 | 1.00 |
| 10 mM | 530 ± 3 | 55 ± 4 | 0.98 |
| 50 mM (Onset) | 545 ± 5 | 85 ± 8 | 0.95 |
| 100 mM (Aggregated) | >600 (Broad) | >150 | 0.70 |
Experimental Protocol: Assessing Colloidal Stability via Salt Challenge
- Materials: Citrate-capped gold nanospheres (40 nm diameter), sodium chloride (NaCl) solution series (0-200 mM in deionized water), UV-Vis spectrophotometer with temperature control.
- Procedure: a. Dilute the stock NP solution to an optical density of ~1.0 at the LSPR peak in deionized water. b. Prepare 1 mL aliquots of this dilution. c. Rapidly mix each aliquot with an equal volume (1 mL) of NaCl solution to achieve the desired final concentration. d. Immediately transfer to a cuvette and record UV-Vis spectra from 400-800 nm at time points: t=0, 5, 15, 30, 60 minutes. e. Monitor the LSPR peak position, full width at half maximum (FWHM), and absorbance at the peak.
- Analysis: The critical coagulation concentration (CCC) is identified as the NaCl concentration causing a red shift >5 nm and a 20% increase in FWHM within 5 minutes.
Diagram Title: LSPR Aggregation Pathway and Spectral Consequence
Nanoparticle Oxidation
Oxidation, particularly for silver and copper NPs, alters the metal's dielectric function, dampening the plasmon resonance and degrading sensitivity.
Mechanism: Reactive oxygen species (ROS) or dissolved oxygen cause the formation of an oxide layer (e.g., Ag₂O on Ag NPs). This layer effectively reduces the electron density in the conduction band and increases radiative damping.
Quantitative Impact of Oxidation: Table 2: Degradation of LSPR Signal for Ag NPs Over Time Under Oxidative Stress
| Condition (25°C) | Time (Hours) | LSPR Peak Wavelength (nm) | Peak Absorbance Loss (%) | Figure of Merit (FOM) Change |
|---|---|---|---|---|
| Nitrogen Atmosphere (Control) | 0 | 412 ± 2 | 0% | 0% |
| Nitrogen Atmosphere (Control) | 72 | 412 ± 3 | <2% | -3% |
| Ambient Air, 50% RH | 24 | 415 ± 4 | 8% | -15% |
| Ambient Air, 50% RH | 72 | 418 ± 6 | 25% | -40% |
| 100 µM H₂O₂ Solution | 1 | 420 ± 5 | 35% | -60% |
Experimental Protocol: Accelerated Oxidation Testing for Ag NPs
- Materials: PVP-coated silver nanotriangles (LSPR ~800 nm), hydrogen peroxide (H₂O₂) dilutions (10 µM - 1 mM), phosphate buffer (pH 7.4), UV-Vis-NIR spectrophotometer.
- Procedure: a. Dispense 500 µL of Ag NP solution into several quartz cuvettes. b. Add 500 µL of oxidizing agent (H₂O₂ in buffer) or buffer control to each cuvette. Mix gently. c. Record the initial spectrum (400-1000 nm). d. Incubate the cuvettes at a controlled temperature (e.g., 37°C). e. Acquire spectra at regular intervals (e.g., every 15 min for 4 hours). f. Track the decrease in peak absorbance and any blue/red shift.
- Analysis: Calculate the first-order rate constant for oxidation from the exponential decay of the peak absorbance over time.
Diagram Title: Oxidation Pathway Leading to LSPR Damping
Substrate Effects
For immobilized NP sensors, the substrate interface is a critical source of instability, influencing NP adhesion, orientation, and local refractive index.
Key Concerns:
- Adhesion Failure: Weak binding leads to NP detachment during fluidic handling.
- Nonspecific Adsorption (NSA): Biofouling from complex matrices (e.g., serum) creates a time-varying dielectric background.
- Thermal Mismatch: Differential expansion between NP, adhesion layer, and substrate induces strain and detuning.
Quantitative Impact of Substrate Functionalization: Table 3: Performance of Different Immobilization Chemistries for Au NPs on Glass
| Immobilization Strategy | Shear Force Resistance (nN) | NSA from 10% FBS (nm shift) | Long-term Drift (pm/hour) | Optimal Use Case |
|---|---|---|---|---|
| (3-Aminopropyl)triethoxysilane (APTES) | 2.1 ± 0.5 | 1.8 ± 0.3 | 25 ± 5 | Proof-of-concept, dry sensing |
| Thiolated Silane (MPTMS) | 5.5 ± 1.2 | 1.2 ± 0.2 | 12 ± 3 | General aqueous buffer |
| Poly-L-lysine (PLL) | 1.5 ± 0.7 | 3.5 ± 0.8 | 50 ± 15 | Rapid, low-cost adhesion |
| BSA-Passivated Thiol Linker | 6.0 ± 1.5 | 0.3 ± 0.1 | 5 ± 2 | Complex biofluids (serum, lysate) |
Experimental Protocol: Immobilization and Passivation for Stable LSPR Chips
- Materials: Clean glass/silica substrates, (3-Mercaptopropyl)trimethoxysilane (MPTMS), Poly(ethylene glycol) thiol (SH-PEG, 5 kDa), SH-PEG-COOH, ethanol, toluene, UV-Ozone cleaner.
- Functionalization: a. Clean substrates in UV-Ozone for 30 minutes. b. Immerse in 2% (v/v) MPTMS in toluene for 2 hours under nitrogen. c. Rinse thoroughly with toluene and ethanol, then cure at 110°C for 30 min. d. Incubate in a 1 mM mixed thiol solution (90% SH-PEG, 10% SH-PEG-COOH) in ethanol for 12 hours. This forms a stable, low-fouling monolayer.
- NP Immobilization: a. Incubate the functionalized substrate with citrate-stabilized Au NPs (pH adjusted to ~8) for 1-2 hours. b. Rinse with deionized water and buffer. The Au-S bond provides strong adhesion, while the PEG layer minimizes NSA.
- Validation: Perform a buffer baseline measurement for 60+ minutes to assess drift (<10 pm/min is acceptable). Challenge with 10% fetal bovine serum (FBS) to measure NSA-induced shift.
Diagram Title: Stable LSPR Chip Fabrication and Key Failure Points
The Scientist's Toolkit: Key Research Reagent Solutions
Table 4: Essential Materials for Mitigating LSPR Stability Issues
| Reagent / Material | Function / Role in Stability Mitigation | Example Product / Note |
|---|---|---|
| Polyvinylpyrrolidone (PVP), MW 40k-55k | Steric stabilizer for NPs; prevents aggregation by forming a protective polymer layer. | Common for Ag NP synthesis and stabilization. |
| Carboxylated PEG Thiol (SH-PEG-COOH) | Forms non-fouling, stable self-assembled monolayers on Au; provides carboxyl groups for biomolecule conjugation. | Used for immobilizing NPs and creating bio-inert surfaces. |
| Tween-20 or Triton X-100 | Non-ionic surfactant; reduces nonspecific adsorption in assay buffers. | Typically used at 0.005-0.1% (v/v) in running buffer. |
| Trehalose or Sucrose | Cryoprotectant and stabilizer; prevents NP aggregation during lyophilization or long-term storage. | 2-5% (w/v) in NP stock solutions. |
| Sodium Citrate Tribasic Dihydrate | Reducing agent and electrostatic stabilizer (capping agent) for Au and Ag NPs. | Key for Turkevich (citrate) synthesis method. |
| (3-Mercaptopropyl)trimethoxysilane (MPTMS) | Bifunctional linker; provides thiol groups for Au NP binding and silane for substrate adhesion. | Critical for robust substrate functionalization. |
| Bovine Serum Albumin (BSA), Fatty-Acid Free | Blocking agent; passivates surfaces and NP surfaces to minimize nonspecific binding. | Standard 1-3% (w/v) solution for 1-hour incubation. |
| Nitrosonium Tetrafluoroborate (NOBF₄) | Mild etching agent; can remove thin oxide layers from Ag NPs to temporarily restore LSPR response. | Caution: Handle in fume hood, use fresh solution. |
The transition from theoretical LSPR advantage to robust, deployable sensing technology hinges on systematically addressing stability concerns. Aggregation is managed through rigorous colloidal chemistry and storage. Oxidation requires careful choice of NP material (Au over Ag for stability) or advanced encapsulation. Substrate effects demand engineered interfaces with strong covalent attachment and sophisticated antifouling layers. By implementing the protocols and material solutions outlined herein, researchers can develop LSPR platforms with the reliability required for advanced drug development and clinical diagnostics, thereby fully leveraging its distinct advantages over traditional SPR.
Within the context of Surface Plasmon Resonance (SPR) and Localized Surface Plasmon Resonance (LSPR) biosensing research, the choice of surface chemistry is paramount for effective ligand immobilization, which directly dictates assay sensitivity, specificity, and reproducibility. This technical guide provides an in-depth comparison of two foundational strategies: thiol-based self-assembled monolayers (SAMs) on gold and carboxyl-functionalized silane chemistry on silica/glass. We detail experimental protocols, present quantitative performance data, and discuss the implications for SPR (propagating plasmons on extended gold films) versus LSPR (localized plasmons on nanostructures) applications.
SPR and LSPR are label-free techniques that monitor biomolecular interactions in real-time. While SPR relies on a continuous thin gold film, LSPR often utilizes discrete gold or silver nanoparticles on a substrate. The core principle of both involves immobilizing a capture ligand (e.g., an antibody, DNA, or receptor) onto a sensor surface. The stability, density, and orientation of this ligand layer are controlled by the underlying surface chemistry, making its optimization critical for high-performance biosensing.
Thiol/Gold Chemistry for SPR & LSPR
Core Mechanism
Thiol (-SH) groups form strong, covalent bonds with gold (Au) surfaces via chemisorption, creating ordered Self-Assembled Monolayers (SAMs). Alkanethiols with various terminal groups (e.g., -COOH, -NH2, -OH, biotin) are used to present a functional interface for subsequent ligand coupling.
Detailed Experimental Protocol: Carboxyl-Terminated SAM for Amine Coupling
Objective: Immobilize an amine-containing ligand (e.g., protein) on a gold sensor chip/surface. Materials: Gold sensor chip, 11-mercaptoundecanoic acid (11-MUA) or similar, absolute ethanol, 1-ethyl-3-(3-dimethylaminopropyl)carbodiimide (EDC), N-hydroxysuccinimide (NHS), phosphate-buffered saline (PBS, pH 7.4), ligand solution, 1 M ethanolamine-HCl (pH 8.5).
Procedure:
- Surface Cleaning: Sonicate gold chip in ethanol for 10 minutes, dry under nitrogen stream.
- SAM Formation: Immerse chip in 1 mM solution of 11-MUA in ethanol for 12-24 hours at room temperature in a sealed container.
- Rinsing: Rinse thoroughly with ethanol, then with PBS buffer to remove physisorbed thiols.
- Activation: Inject or immerse surface in a fresh 1:1 mixture of 0.4 M EDC and 0.1 M NHS in water for 5-10 minutes. This converts terminal carboxyls to amine-reactive NHS esters.
- Ligand Immobilization: Immediately expose the activated surface to the ligand solution (in 10 mM sodium acetate buffer, pH 4.0-5.5, optimized for ligand's pI) for 5-15 minutes.
- Quenching: Deactivate remaining NHS esters by exposing the surface to 1 M ethanolamine-HCl (pH 8.5) for 5-10 minutes.
- Final Rinse: Rinse with running buffer (e.g., HBS-EP) to establish a stable baseline.
Carboxyl/Silica Chemistry for SPR & LSPR
Core Mechanism
Silane coupling agents, such as (3-aminopropyl)triethoxysilane (APTES) followed by a heterobifunctional crosslinker, or carboxyl-terminated silanes (e.g., carboxyethylsilanetriol), are used to functionalize silica, glass, or metal oxide surfaces. This chemistry is essential for silica-based SPR prisms and many LSPR nanoparticle substrates.
Detailed Experimental Protocol: Silanization & Carboxyl Surface Creation
Objective: Create a carboxyl-functionalized silica/glass surface for amine coupling. Materials: Silica/glass substrate, piranha solution (Caution: Highly corrosive), (3-aminopropyl)triethoxysilane (APTES), anhydrous toluene, succinic anhydride, dimethylformamide (DMF), sodium borate buffer (pH 8.5), EDC, NHS.
Procedure:
- Surface Cleaning & Hydroxylation: Immerse substrate in piranha solution (3:1 H2SO4:H2O2) for 30 minutes. Rinse extensively with deionized water and dry under nitrogen. (Handle with extreme care).
- Aminosilanization: Incubate the clean, dry substrate in a 2% (v/v) solution of APTES in anhydrous toluene for 2 hours under inert atmosphere. This forms an amine-terminated monolayer.
- Rinsing: Rinse sequentially with toluene, ethanol, and acetone to remove unreacted silane.
- Carboxylation: Prepare a 50 mM solution of succinic anhydride in DMF. React with the aminosilanized surface for 4 hours. This creates a carboxyl-terminated surface.
- Rinsing: Rinse thoroughly with DMF and PBS buffer.
- Activation & Coupling: Follow the same EDC/NHS activation, ligand coupling, and quenching steps as described in Section 2.2 (Steps 4-7).
Comparative Performance Data
Table 1: Quantitative Comparison of Thiol/Gold vs. Carboxyl/Silica Chemistry
| Parameter | Thiol/Gold (11-MUA SAM) | Carboxyl/Silica (APTES-Succinic Anhydride) |
|---|---|---|
| Bond Strength | Covalent Au-S (~150-200 kJ/mol) | Covalent Si-O-Si + amide/ester linkages |
| Linker Length | ~1.4 nm (for 11-MUA) | Tunable, typically ~1-2 nm |
| Ligand Density | High (up to ~4 x 10^14 molecules/cm²) | Moderate to High (dependent on silane packing) |
| Surface Stability | Excellent in aqueous buffers. Sensitive to oxidants, high temp. | Good. Sensitive to hydrolysis at extreme pH. |
| Non-specific Binding | Very Low (with well-packed SAM & backfilling) | Moderate (requires optimization/PEGylation) |
| Optimal Technique | Classic SPR (gold film), LSPR (Au nanoparticles) | SPR (silica coupling), LSPR (silica-coated/silica substrates) |
| Protocol Duration | Moderate (SAM formation 12-24 hrs) | Long (multi-step, requires drying/curing) |
| Reproducibility | High (well-established protocol) | Variable (highly sensitive to humidity, solvent) |
The Scientist's Toolkit: Essential Research Reagent Solutions
Table 2: Key Reagents for Surface Functionalization
| Item | Function | Example (Supplier Variants) |
|---|---|---|
| Gold Sensor Chip | SPR substrate for thiol chemistry. | Cytiva SIA Kit, Biosensing Instrument chips. |
| Functional Alkanethiol | Forms SAM; defines terminal chemistry. | 11-Mercaptoundecanoic acid (11-MUA), HS-(CH2)11-COOH. |
| Backfilling Thiol | Improves SAM order, reduces non-specific binding. | 6-Mercapto-1-hexanol (MCH), PEG-thiols. |
| Carbodiimide (EDC) | Activates carboxyl groups for coupling. | 1-ethyl-3-(3-dimethylaminopropyl)carbodiimide. |
| NHS | Stabilizes EDC-activated esters, improving efficiency. | N-hydroxysuccinimide. |
| Amine-Terminated Silane | Primes oxide surfaces for further functionalization. | (3-aminopropyl)triethoxysilane (APTES). |
| Heterobifunctional Crosslinker | Links amine-surface to specific ligand groups. | Succinic anhydride, GMBS, Sulfo-SMCC. |
| Ethanolamine-HCl | Quenches unreacted NHS esters after coupling. | 1 M ethanolamine-HCl, pH 8.5. |
| Low Ionic Strength Buffer | Optimizes electrostatic ligand capture during immobilization. | 10 mM sodium acetate buffer (pH 4.0-5.5). |
| Running Buffer (e.g., HBS-EP) | Provides stable baseline for interaction analysis. | 10 mM HEPES, 150 mM NaCl, 3 mM EDTA, 0.005% Surfactant P20, pH 7.4. |
The choice between thiol/gold and carboxyl/silica chemistry is dictated by the sensor platform and application requirements.
- For traditional SPR on gold films and LSPR on colloidal gold nanoparticles, thiol/gold chemistry is the gold standard, offering robust, reproducible, and high-density immobilization with minimal non-specific binding.
- For waveguide-based SPR, silicon, or glass-based LSPR substrates, carboxyl/silica chemistry is necessary. While more complex, it provides a versatile route to functionalize oxide surfaces.
In the broader thesis of SPR vs. LSPR, this surface chemistry decision directly impacts the refractive index sensitivity and figure of merit. A well-ordered, densely packed, and stable ligand layer maximizes the signal-to-noise ratio for both techniques, enabling the detection of low-abundance analytes critical for drug discovery and diagnostic applications.
Visualizations
Thiol/Gold Immobilization Workflow
Carboxyl/Silica Immobilization Workflow
Surface Chemistry Choice in Plasmonic Sensing
Within the broader context of elucidating differences between Surface Plasmon Resonance (SPR) and Localized Surface Plasmon Resonance (LSPR) biosensing, this guide addresses two critical, often conflated, analytical challenges: instrumental drift correction and appropriate binding model selection. Both SPR and LSPR measure biomolecular interactions in real-time, but their distinct physical principles—propagating vs. localized plasmons—lead to different noise characteristics and data density, influencing these analytical steps.
Correcting for Baseline Drift
Baseline drift is a low-frequency signal deviation not caused by specific binding. In SPR, drift often arises from temperature fluctuations or bulk refractive index changes. In LSPR, based on spectral shifts of nanoparticle sensors, drift can be more pronounced due to local environmental instabilities.
Experimental Protocol for Drift Assessment & Correction
Protocol 1: Pre-Run Drift Measurement
- Sensor Surface Preparation: Equilibrate the sensor (SPR chip or LSPR nanoparticle substrate) with running buffer for 30 minutes at the experimental flow rate and temperature.
- Baseline Monitoring: Record the signal (SPR angle/resonance units or LSPR wavelength shift) for a minimum of 300 seconds with constant buffer flow.
- Drift Rate Calculation: Perform a linear regression on the baseline data. The slope (e.g., RU/sec or pm/sec) is the drift rate.
- Acceptance Criterion: For high-quality kinetics, the absolute drift rate should be <0.5% of the expected analyte binding signal per minute. If exceeded, re-equilibrate or investigate system stability.
Protocol 2: Reference Subtraction (Dual-Channel) This standard method requires a reference surface.
- Dual-Channel Setup: Use a flow cell with an active (ligand-functionalized) surface and a reference (mock-functionalized) surface.
- Simultaneous Data Acquisition: Record signals from both channels during the entire assay (association, dissociation, regeneration).
- Real-Time Subtraction: Subtract the reference channel signal from the active channel signal for every time point. This removes bulk refractive index effects and systemic drift common to both channels.
Protocol 3: Post-Hoc Mathematical Correction For single-channel systems or when reference subtraction is insufficient.
- Identify Drift-Only Regions: Mark stable signal regions before injection (pre-injection baseline) and after complete dissociation (post-dissociation baseline).
- Model the Drift: Fit a linear or low-order polynomial function (e.g., 2nd order) to these regions.
- Subtract Model: Subtract the modeled drift function from the entire sensorgram.
Table 1: Common Drift Sources and Mitigation Strategies in SPR vs. LSPR
| Source | SPR Impact | LSPR Impact | Mitigation Strategy |
|---|---|---|---|
| Temperature Fluctuation | High (bulk RI sensitive) | Moderate (local RI sensitive) | Use instrument thermostat, pre-warm buffers |
| Buffer Degassing/Evaporation | Moderate | High (affects local concentration) | Use degassed buffers, sealed sample chambers |
| Unstable Light Source | Low (referenced) | Very High (direct spectral measure) | Allow source warm-up, use stabilized LEDs/lasers |
| Non-Specific Binding | High (adds to signal) | High (adds to signal) | Improve surface chemistry, include controls |
Title: Drift Assessment and Correction Workflow
Choosing the Right Binding Model
Selecting an incorrect model is a fundamental analytical pitfall that renders derived kinetic constants (ka, kd) and affinity (KD) meaningless.
Key Binding Models & Their Applications
1:1 Langmuir Binding Model Applies to a single analyte binding to a single, homogenous epitope on an immobilized ligand without mass transfer limitation or cooperativity.
Two-State (Conformational Change) Model Applies when binding induces a subsequent conformational change in the complex, often seen as a biphasic association or dissociation.
Heterogeneous Ligand Model Applies when the immobilized ligand presents multiple, independent binding sites with different affinities.
Bivalent Analyte Model Applies when the analyte (e.g., an antibody) has two identical binding sites that can each interact with immobilized ligands.
Experimental Protocol for Model Selection & Validation
Protocol: Systematic Binding Model Workflow
- High-Quality Data Collection: Perform experiments at multiple analyte concentrations (at least 5, spanning 0.1x to 10x estimated KD). Use duplicate or triplicate injections.
- Global Fitting: Simultaneously fit all sensorgrams (all concentrations) to a candidate model using software (e.g., Scrubber, Biacore Evaluation, or custom Python/R scripts).
- Residuals Analysis: Examine the residuals (difference between experimental data and fitted curve). Randomly distributed residuals indicate a good fit; structured residuals indicate a poor model.
- Parameter Assessment: Check fitted parameters for physical meaning (e.g., rate constants should be positive, ka typically ≤106 M-1s-1 for diffusion-limited binding).
- Compare Models: Use statistical criteria like the Akaike Information Criterion (AIC) or F-test to compare nested models. The model with the lowest AIC is preferred.
Table 2: Binding Model Selection Guide
| Model | Equation (dR/dt) | Applicable Scenario | Key Assumption |
|---|---|---|---|
| 1:1 Langmuir | ka·C·(Rmax-R) - kd·R | Monovalent, homogeneous interaction | Single, identical binding sites; no mass transfer limit |
| Mass Transfer Limited | km·(C - Csurface) | Very high binding affinity or low flow rate | Binding rate is limited by analyte diffusion to surface |
| Heterogeneous Ligand (2-site) | Sum of two 1:1 Langmuir terms | Ligand heterogeneity or multiple independent epitopes | Two distinct, non-interacting site populations |
| Two-State Conformational | Complex (AB AB* ) | Binding induces a slow conformational change | Two-step reaction: initial binding followed by isomerization |
| Bivalent Analyte | Complex (A + B AB BA) | Divalent molecules (e.g., IgG) binding to surface ligand | Analyte has two identical, independent binding sites |
Title: Model Selection and Validation Logic
The Scientist's Toolkit: Research Reagent Solutions
Table 3: Essential Materials for SPR/LSPR Binding Studies
| Item | Function | Example/Supplier Note |
|---|---|---|
| Sensor Chip (SPR) | Provides the gold surface for plasmon excitation and ligand immobilization. | CM5 (carboxymethyl dextran) chips (Cytiva); hydrophobic interaction (HPA) chips. |
| Nanoparticle Substrate (LSPR) | Provides tunable, localized plasmonic resonances. | Coated glass slides with Au nanorods or nanotriangles (e.g., NanoComposix). |
| Anti-His Tag Antibody | For capturing His-tagged ligands in oriented immobilization. | Recombinant from multiple suppliers (e.g., GenScript, Sino Biological). |
| Series S Running Buffer | Optimized buffer for SPR systems to minimize non-specific binding and drift. | Cytiva's HBS-EP+ (10mM HEPES, 150mM NaCl, 3mM EDTA, 0.05% P20 surfactant). |
| Regeneration Solution | Removes bound analyte without damaging the immobilized ligand. | 10mM Glycine-HCl, pH 1.5-3.0; or 10-50mM NaOH. Must be optimized per ligand. |
| Protein A or G | For capturing antibody ligands via Fc region, ensuring proper orientation. | Recombinant, sensor-grade (e.g., from Cytiva or Repligen). |
| Kinetic Analysis Software | For global fitting of binding data to various models. | Biacore Evaluation Software (Cytiva), Scrubber (BioLogic), or TraceDrawer (Ridgeview). |
| Reference Surface | An inert surface for control subtraction of bulk effects and drift. | A flow cell blocked with ethanolamine (amine coupling) or a non-functionalized nanoparticle region. |
SPR vs. LSPR Data Density & Model Implications
A key distinction impacting model choice is data density. Traditional SPR produces dense, continuous data points ideal for fitting complex models like the two-state reaction. Some LSPR platforms, particularly those measuring full spectral shifts, may have lower temporal resolution. This can make it challenging to resolve very fast kinetic phases, potentially favoring simpler models or equilibrium analysis.
Conclusion: Rigorous data analysis in biosensing requires disentangling the artifacts of drift from the physics of binding. By implementing standardized drift correction protocols and a systematic, statistically-informed model selection process, researchers can extract reliable kinetic and thermodynamic parameters. This analytical rigor is paramount when comparing data across SPR and LSPR platforms to understand how their inherent physical differences translate into measurable biological insights.
This whitepaper presents an in-depth technical guide on two pivotal, synergistic methodologies for enhancing signal sensitivity in plasmonic biosensing: nanostructure shape engineering and advanced spectral deconvolution. The discussion is framed within the fundamental research context comparing Surface Plasmon Resonance (SPR) and Localized Surface Plasmon Resonance (LSPR). While SPR exploits propagating electron density waves on extended noble metal films, LSPR involves the confinement of these oscillations to discrete nanostructures, leading to highly localized and tunable electromagnetic near-fields. The core thesis is that the convergence of rationally engineered nanostructure shapes—which define the initial LSPR spectral properties—with sophisticated computational deconvolution of spectral shifts constitutes the most promising path toward ultra-sensitive, label-free detection for critical applications in drug development and diagnostics.
Nanostructure Shape Engineering for LSPR Optimization
The geometry of a metallic nanostructure directly dictates its plasmonic properties, including resonance wavelength, near-field enhancement (hot spot intensity), and sensitivity to local refractive index changes.
Key Shape-Dependent Parameters
- Aspect Ratio: In anisotropic structures like nanorods, increasing the aspect ratio (length/width) leads to a red-shift of the longitudinal plasmon band and increased sensitivity.
- Sharpness of Features: Tips, edges, and vertices (e.g., on stars, bipyramids, or nanostars) create intense localized electromagnetic fields, dramatically enhancing sensitivity.
- Symmetry and Composition: Complex, multi-branched or core-shell structures allow for fine-tuning of multiple resonance modes and hybrid plasmonic effects.
Quantitative Comparison of Nanostructure Performance
Table 1: Sensitivity Metrics of Engineered Gold Nanostructures (Representative Values)
| Nanostructure Shape | Local Refractive Index Sensitivity (nm/RIU)* | Figure of Merit (FOM) | Key Advantages | Common Fabrication Method |
|---|---|---|---|---|
| Nanospheres | ~40-80 | Low (~1-2) | Isotropic, simple synthesis | Chemical reduction (Turkevich) |
| Nanorods (AR=3-4) | ~200-400 | Moderate (~2-4) | Tunable longitudinal mode | Seed-mediated growth |
| Nanobipyramids | ~300-500 | High (~3-5) | Two sharp tips, high field enhancement | CTAB-assisted growth |
| Nanostars / Multi-branched | ~400-700+ | Very High (~4-8) | Multiple hot spots, broadband response | Surfactant-directed, anisotropic growth |
| Nanocages / Shells | ~350-600 | High (~3-6) | Tunable via wall thickness, hollow interior | Galvanic replacement |
| Nanodisks (Arrays) | ~150-300 | Moderate (~2-4) | Precise spectral positioning, uniform response | Lithography (E-beam, NIL) |
RIU: Refractive Index Unit. Values are representative ranges from recent literature. *FOM = Sensitivity / Full Width at Half Maximum (FWHM); higher is better.*
Experimental Protocol: Seed-Mediated Growth of Gold Nanorods (High-Aspect-Ratio Example)
Objective: Synthesize monodisperse Au nanorods with tunable longitudinal LSPR in the near-infrared region.
Materials:
- Gold(III) chloride trihydrate (HAuCl₄·3H₂O): Gold precursor.
- Sodium borohydride (NaBH₄): Strong reducing agent for seed formation.
- Ascorbic acid: Mild reducing agent for growth solution.
- Cetyltrimethylammonium bromide (CTAB): Positively charged surfactant directing anisotropic growth.
- Silver nitrate (AgNO₃): Additive to modulate rod aspect ratio by underpotential deposition.
Procedure:
- Seed Solution: Mix CTAB (5 mL, 0.1 M) with HAuCl₄ (5 mL, 0.5 mM). Add ice-cold NaBH₄ (0.6 mL, 10 mM) under vigorous stirring. Solution turns brownish-yellow. Stir for 2 minutes, then incubate at 25°C for 30 minutes before use.
- Growth Solution: Combine CTAB (40 mL, 0.1 M), HAuCl₄ (2 mL, 10 mM), AgNO₃ (0.4-1.0 mL, 10 mM – concentration controls aspect ratio), and ascorbic acid (0.32 mL, 0.1 M). The solution becomes colorless upon ascorbic acid addition.
- Initiation: Add seed solution (96 µL) to the growth solution. Gently invert 2-3 times to mix. Let the reaction proceed undisturbed at 25°C for at least 3 hours.
- Purification: Centrifuge the product at 12,000 rpm for 10 minutes. Carefully decant the supernatant and re-disperse the nanorod pellet in deionized water. Repeat once.
- Characterization: Use UV-Vis-NIR spectroscopy to confirm longitudinal LSPR peak position (650-900 nm) and transmission electron microscopy (TEM) to determine size and morphology.
Spectral Deconvolution Techniques for Signal Enhancement
Raw spectral shifts from binding events are often subtle and convoluted with noise from instrumental drift, non-specific binding, and environmental fluctuations. Deconvolution techniques isolate the signal of interest.
Core Techniques
- Principal Component Analysis (PCA): Reduces spectral data dimensionality, identifying the most significant components of variance (e.g., specific binding vs. drift).
- Singular Value Decomposition (SVD): Decomposes a spectrum into basis spectra and coefficients, enabling the extraction of kinetic binding parameters from noisy time-series data.
- Machine Learning (ML) Regression (e.g., Random Forest, CNN): Trains models on known spectral responses to predict analyte concentration or binding affinity with high accuracy from complex spectral inputs.
Quantitative Impact of Deconvolution
Table 2: Impact of Spectral Deconvolution on Detection Limits
| Analytical Challenge | Raw Signal Limit | With Spectral Deconvolution | Improvement Factor | Typical Technique Applied |
|---|---|---|---|---|
| Low-Abundance Protein Detection | ~1 nM | ~10-100 pM | 10-100x | SVD-PCA Hybrid Analysis |
| Small Molecule Binding (Fragment Screening) | ~100 µM | ~1-10 µM | 10-100x | Multivariate Curve Resolution |
| Distinguishing Specific from Non-Specific Binding | Poor specificity | High specificity | Qualitative leap | PCA with Reference Components |
| Resolving Multi-Analyte Mixtures | Limited/None | Good resolution | N/A | Partial Least Squares Regression |
Experimental Protocol: PCA-Based Deconvolution of LSPR Binding Kinetics
Objective: Extract specific binding kinetics from an LSPR timeseries dataset contaminated by baseline drift.
Materials/Software:
- LSPR timeseries data (wavelength vs. time vs. intensity).
- Computational environment (Python with NumPy, SciPy, scikit-learn; or MATLAB).
Procedure:
- Data Preprocessing: Organize raw data into a matrix X (m x n), where m is the number of time points and n is the number of wavelength points. Perform baseline correction (e.g., subtract the mean of the first 10 time points for each wavelength).
- PCA Execution: Apply PCA to the mean-centered matrix X. This yields a set of principal components (PCs, eigenvectors) and corresponding scores (projections of data onto PCs).
- Component Identification: Inspect the scores of the first 3-4 PCs. Typically, PC1 captures the dominant trend (often the binding signal), PC2 may capture linear drift, and PC3 may capture noise or secondary effects.
- Signal Reconstruction: Reconstruct the "cleaned" binding signal using only the scores and loadings from the PC(s) identified as containing the specific binding information (e.g., PC1). Exclude components attributed to drift and noise.
- Kinetic Fitting: Fit the reconstructed signal (e.g., PC1 scores vs. time) to a standard kinetic model (e.g., Langmuir 1:1 binding model) to obtain association (
k_a) and dissociation (k_d) rate constants, and thus the equilibrium dissociation constant (K_D).
The Scientist's Toolkit: Essential Research Reagents & Materials
Table 3: Key Research Reagent Solutions for LSPR Biosensing Development
| Item | Function & Rationale |
|---|---|
| Functionalization Reagents | |
| Alkanethiols (e.g., HS-C11-EG6-OH) | Form self-assembled monolayers (SAMs) on Au surfaces; EG6 spacer reduces non-specific binding. |
| Biotin-Conjugated Thiols / Silanes | Provides a universal capture layer for streptavidin-conjugated probes (antibodies, DNA). |
| Carboxylated PEG Thiols | Enables covalent amine coupling of proteins via EDC/NHS chemistry on Au nanostructures. |
| Assay Components | |
| High-Purity Gold Salts (HAuCl₄) | Precursor for reproducible synthesis of Au nanostructures with minimal metallic impurities. |
| Precision Surfactants (CTAB, PVP) | Direct anisotropic growth and stabilize colloidal nanostructures against aggregation. |
| Blocking Buffers (e.g., BSA, Casein) | Minimize non-specific adsorption of analytes to sensor surfaces, crucial for complex biofluids. |
| Instrumentation & Consumables | |
| Index-Matching Fluids | Ensures optimal optical coupling in prism-based SPR or dark-field microscopy setups. |
| Microfluidic Flow Cells | Enable controlled reagent delivery, precise kinetics measurement, and automated analysis. |
| Certified Refractive Index Liquids | For precise, on-chip calibration of sensor sensitivity (nm/RIU). |
Visualized Workflows and Relationships
Diagram 1: Dual Pillar Strategy for Sensitivity Enhancement
Diagram 2: Au Nanorod Synthesis via Seed-Mediated Growth
Diagram 3: Spectral Deconvolution Workflow for Kinetic Analysis
SPR vs LSPR Head-to-Head: Sensitivity, Throughput, and Cost-Benefit Analysis
This technical whitepaper, framed within a broader thesis on Surface Plasmon Resonance (SPR) versus Localized Surface Plasmon Resonance (LSPR) biosensing, provides an in-depth comparison of the two dominant plasmonic techniques. We dissect the core performance metrics of sensitivity, detection limit, and dynamic range, which are fundamental to their application in life science research and drug development. The distinct physical origins of SPR (propagating plasmons) and LSPR (localized plasmons) give rise to fundamentally different signal transductions—measured in Resonance Units per nanometer (RU/nm) and wavelength shift per nanometer (Δλ/nm), respectively—leading to significant implications for assay design and capability.
SPR instruments typically monitor the change in the angle or intensity of reflected light at a fixed wavelength, resulting from changes in the refractive index at the surface of a thin metal film (usually gold). The signal is reported in Resonance Units (RU), where 1 RU often corresponds to a 10^-4 degree shift in resonance angle or ~0.1 pg/mm² of mass accumulation. In contrast, LSPR utilizes nanoparticles (often gold nanospheres, nanorods, or nanostars) where the confinement of electrons leads to a strong, size- and shape-dependent extinction peak. Binding events on or near the nanoparticle surface alter the local refractive index, causing a measurable shift in the peak wavelength (Δλ).
Quantitative Comparison of Core Metrics
The following table summarizes the typical performance ranges for commercial and research-grade SPR and LSPR biosensing platforms.
Table 1: Comparative Performance Metrics of SPR and LSPR Biosensors
| Metric | Typical SPR Performance | Typical LSPR Performance | Key Implication |
|---|---|---|---|
| Sensitivity Unit | RU/nm (mass/area per bulk RI change) | Δλ/nm (wavelength shift per bulk RI change) | SPR is a bulk interface probe; LSPR is a highly localized probe. |
| Bulk Refractive Index Sensitivity | 2,000 - 10,000 RIU⁻¹ (Angular Interrogation) | 200 - 1,000 nm/RIU | SPR is 1-2 orders of magnitude more sensitive to bulk dielectric changes. |
| Assay Sensitivity (Biomol. Binding) | High (monitors ~0.1 pg/mm²) | Moderate to High (depends on nanoparticle design) | SPR excels for detailed kinetic profiling of binding events. |
| Typical Detection Limit (Label-Free) | 0.1 - 10 pM (for proteins, ~70 kDa) | 1 - 100 pM (highly target- and nanoparticle-dependent) | SPR generally offers lower concentration LODs for standard assays. |
| Dynamic Range | 4 - 5 orders of magnitude in concentration | 3 - 4 orders of magnitude in concentration | SPR's wider range is beneficial for characterizing high-affinity interactions. |
| Sensing Volume | ~200-300 nm from surface (evanescent field depth) | < 30 nm from nanoparticle surface (highly localized) | LSPR is less susceptible to bulk interference, ideal for complex matrices. |
| Sample Throughput | Moderate (4-96 channels in arrays) | Potentially Very High (microplate-based nanoparticle assays) | LSPR formats are more amenable to high-throughput screening. |
Experimental Protocols for Key Measurements
Protocol: Measuring Bulk Refractive Index Sensitivity (SRIS)
Objective: To determine the intrinsic sensitivity of an SPR chip or LSPR nanoparticle substrate to changes in the surrounding dielectric environment. Materials:
- SPR biosensor (e.g., Biacore, Bio-Rad ProteOn) or LSPR spectrometer with flow cell.
- Sensor Chip (SPR: bare gold or carboxymethylated dextran; LSPR: functionalized nanoparticles on a substrate).
- A series of glycerol-water or sucrose-water solutions with precisely known refractive indices (e.g., 1.3330 to 1.3600 RIU). Procedure:
- Baseline Establishment: Flow a pure buffer (e.g., HEPES-buffered saline, HBS) over the sensor surface at a constant rate (e.g., 30 µL/min) until a stable baseline signal (RU for SPR, λ_max for LSPR) is achieved.
- Solution Series Injection: Inject each RI standard solution for a fixed period (e.g., 2-3 minutes), followed by a buffer wash to re-establish baseline.
- Data Recording: Record the steady-state response (ΔRU or Δλ_max) for each solution.
- Analysis: Plot the response (y-axis) against the refractive index (x-axis). Perform a linear regression. The slope of the line is the Bulk Refractive Index Sensitivity (SRIS for SPR in RU/RIU, or for LSPR in nm/RIU).
Protocol: Determining the Limit of Detection (LOD) for a Model Protein
Objective: To empirically determine the lowest detectable concentration of a target analyte (e.g., streptavidin) using a specific assay format. Materials:
- Biotinylated sensor surface (SPR: CM5 chip coupled with biotin-caproylamine; LSPR: biotinylated self-assembled monolayer on nanoparticles).
- Serial dilutions of target protein (streptavidin) in running buffer.
- Regeneration solution (e.g., 10 mM glycine-HCl, pH 2.0). Procedure:
- Surface Preparation: Immobilize a biotinylated capture molecule to create a homogeneous surface. Block with a non-reactive protein (e.g., BSA) if necessary.
- Dose-Response Experiment: Inject increasing concentrations of the target analyte (e.g., from 1 fM to 100 nM) in random order, with replicates of a zero-concentration (buffer blank). Use consistent contact and dissociation times.
- Response Calculation: For each injection, calculate the specific response by subtracting the average response from the buffer blank injections.
- LOD Calculation: Plot specific response vs. analyte concentration. Fit an appropriate binding isotherm. The LOD is commonly defined as the concentration corresponding to the mean response of the blank plus three times the standard deviation of the blank (Meanblank + 3σblank). Use the fitted curve to find the concentration at this response level.
Visualization of Concepts and Workflows
Diagram: SPR vs LSPR Sensing Mechanism
Diagram: Protocol for Determining LOD
The Scientist's Toolkit: Essential Research Reagents & Materials
Table 2: Key Reagent Solutions for SPR/LSPR Biosensing Assays
| Item | Function & Description | Typical Example(s) |
|---|---|---|
| Sensor Chip/Substrate | The core plasmonic material. SPR uses planar gold films on glass prisms. LSPR uses functionalized nanoparticle arrays or colloidal solutions. | SPR: Biacore CM5 (carboxymethylated dextran gold chip). LSPR: NanoSphere-coated glass slides or citrate-capped Au colloids. |
| Coupling Chemistry Kit | For covalent immobilization of ligands (antibodies, receptors) onto the sensor surface. | Amine-coupling kit: EDC/NHS for activating carboxyl groups. Thiol-coupling kit for gold-binding via cysteine residues. |
| Running Buffer | A stable, biologically compatible buffer that maintains analyte and ligand activity, minimizes non-specific binding. | HEPES-buffered saline (HBS-EP: 10 mM HEPES, 150 mM NaCl, 3 mM EDTA, 0.005% v/v Surfactant P20, pH 7.4). |
| Regeneration Solution | A solution that dissociates bound analyte from the immobilized ligand without damaging the ligand's activity, allowing surface reuse. | Low pH (10-100 mM Glycine-HCl, pH 2.0-3.0), high pH (NaOH, 10-50 mM), high salt (MgCl2, 1-3 M), or chaotropic agents. |
| Anti-Nonspecific Binding Agents | Additives to reduce unwanted adsorption of sample components to the sensor surface or fluidics. | Surfactants (e.g., Tween-20, P20), inert proteins (BSA, casein), or carboxymethyl dextran (on SPR chips). |
| Reference Channel/Subtractant | A critical control for subtracting instrumental drift and bulk RI changes. Often involves an immobilized inert protein or a blocked surface. | Ethanolamine-blocked channel after ligand activation (for amine coupling), or an immobilized non-specific IgG. |
| Concentration Series Analyte | The purified target molecule in known concentrations, prepared by serial dilution in running buffer. Essential for kinetics and LOD. | Recombinant protein (e.g., TNF-α, HER2), antibody, oligonucleotide, or small molecule drug candidate. |
SPR technology remains the gold standard for detailed biomolecular interaction analysis, offering superior sensitivity for bulk refractive index changes and lower detection limits for kinetic profiling, making it indispensable for definitive affinity (KD) and rate constant (ka, kd) determination in drug discovery. LSPR, with its highly localized sensing volume, offers distinct advantages in studying small binding partners, membrane proteins in native-like environments, and performing assays in complex matrices like serum or cell lysate with reduced bulk interference. Its potential for miniaturization and high-throughput array formats is significant. The choice between RU/nm and Δλ/nm ultimately depends on the specific application: SPR for rigorous interaction characterization and LSPR for diagnostic screening, point-of-care applications, or studies where the extreme localization of the sensing field is a benefit.
This whitepaper provides an in-depth technical comparison of Surface Plasmon Resonance (SPR) and Localized Surface Plasmon Resonance (LSPR) technologies, specifically analyzing their throughput, scalability, and suitability for High-Throughput Screening (HTS). This analysis is framed within the critical research context of elucidating the fundamental and operational differences between SPR and LSPR, which directly impacts their deployment in modern drug discovery pipelines.
Defining HTS Requirements for Label-Free Biosensing
High-Throughput Screening in drug discovery demands the rapid, parallel, and automated analysis of thousands to millions of compounds. For label-free technologies like SPR and LSPR, key HTS metrics include:
- Assay Speed: Time per sample analysis, including binding and regeneration.
- Multiplexing Capacity: Number of simultaneous, independent measurements per sensor cycle.
- Automation Compatibility: Ease of integration with liquid handlers and robotic systems.
- Miniaturization: Ability to function with low sample volumes (≤ 10 µL).
- Robustness & Regeneration: Stability of the sensor surface for repeated use.
Technology-Specific HTS Adaptations
SPR in the HTS Context
Traditional SPR platforms are kinetic workhorses but face inherent throughput limitations due to their reliance on microfluidic channels and scanning detection systems. Modern advancements have significantly addressed these challenges.
Key Methodologies for SPR HTS:
- Array-Based SPR Imaging (SPRi): Utilizes a CCD camera to monitor binding events across a 2D array of hundreds to thousands of discrete spots simultaneously. This transforms SPR from a serial to a parallel technique.
- Microfluidic Multiplexing: Incorporates complex fluidic designs with multiple, parallel flow cells to increase the number of analyzed interactions per cycle.
- High-Density Spotting: Automated spotting of different ligands (e.g., protein targets) at high density on a single gold sensor chip.
Protocol: High-Density Protein Array Screening via SPRi
- Sensor Chip Functionalization: A bare gold SPRi chip is cleaned and coated with a self-assembled monolayer (e.g., mixed alkane thiols) to create a functionalizable surface.
- Ligand Spotting: Using a non-contact microarray spotter, nanoliter volumes of purified protein targets (≥ 100 different targets) are immobilized onto discrete locations on the chip.
- Blocking: The chip is incubated with a BSA or casein solution to block non-specific binding sites.
- Instrument Priming: The chip is loaded into the SPRi instrument, and the fluidic system is primed with running buffer (e.g., HBS-EP+).
- Analyte Injection: A library of small molecule compounds (analytes) is injected sequentially via an autosampler over the entire array under continuous flow.
- Data Acquisition: The CCD camera captures reflectivity changes across the entire array in real-time, generating simultaneous sensorgrams for every spot.
- Regeneration: A brief injection of a regeneration solution (e.g., 10 mM Glycine-HCl, pH 2.0) dissociates bound analytes, preparing the array for the next sample.
LSPR in the HTS Context
LSPR nanotechnology offers intrinsic advantages for HTS due to its simplicity, low cost per sensor, and potential for extreme multiplexing in microplate formats.
Key Methodologies for LSPR HTS:
- Plate-Based Formats: Nanofabricated LSPR sensors (e.g., gold nanoparticles, nanorods, or nano-islands) are embedded into the wells of standard microplates (96, 384, 1536-well).
- Transmission-Mode Detection: Use of simple, plate-reader style optics to measure spectral shifts via transmission or absorbance, eliminating complex angular scanning.
- Bulk Refractive Index Sensing: Detection relies on localized refractive index changes upon binding, making it highly sensitive to molecular interactions near the nanoparticle surface.
Protocol: 384-Well Nanoparticle Plate Screening
- Plate Preparation: A 384-well plate with pre-functionalized gold nanoparticles (e.g., citrate-capped AuNPs) adsorbed to each well bottom is used.
- Ligand Conjugation: A universal streptavidin layer is first immobilized onto the nanoparticles across all wells. Biotinylated target proteins are then added to relevant wells.
- Buffer Equilibration: Assay buffer is added to all wells to establish a stable baseline optical signal.
- Compound Dispensing: Using an automated liquid handler, compounds from a library are dispensed into the assay wells. Controls (buffer only, reference inhibitor) are included on each plate.
- Kinetic Measurement: The microplate is immediately transferred to a compatible plate reader. The absorbance/extinction spectrum (typically 500-700 nm) for each well is measured at fixed time intervals (e.g., every 15 seconds for 10 minutes).
- Data Processing: Software calculates the peak wavelength shift (Δλ max) over time for each well, generating binding curves without the need for surface regeneration in endpoint assays.
Quantitative Comparison of HTS Performance
| Feature | SPR (Modern Array-Based) | LSPR (Plate-Based) |
|---|---|---|
| Max Throughput (Samples/Day) | ~10,000 - 50,000 (kinetic) | > 100,000 (end-point); ~50,000 (kinetic) |
| Multiplexing (Targets per Cycle) | High (100s - 1000s on a single chip) | Very High (Independent wells; 384, 1536 per plate) |
| Sample Volume (Typical) | 10 - 50 µL | 5 - 25 µL |
| Data Output | Full kinetic curves (ka, kd, KD) for all spots | Peak shift kinetics or single-point Δλ (endpoint) |
| Automation Integration | High (autosamplers, robotics) | Very High (standard microplate handlers) |
| Regeneration Requirement | Usually required for chip reuse | Often not required (disposable plate format) |
| Primary HTS Application | Kinetics-informed primary screening, protein-protein interaction panels | Ultra-HTS primary screening, hit identification, cell-based assays |
The Scientist's Toolkit: Essential Reagent Solutions
| Item | Function in HTS-SPR/LSPR | Example/Note |
|---|---|---|
| Sensor Chips (SPR) | Provides the gold surface for ligand immobilization. | Carboxylated (CM5), streptavidin (SA), nitrilotriacetic acid (NTA) chips. |
| Nanoparticle Plates (LSPR) | Microplates with integrated nanostructures for plate-based assays. | Gold nanoparticle-coated 384-well plates. |
| Coupling Reagents | Enables covalent attachment of proteins to sensor surfaces. | EDC/NHS mixture for amine coupling on SPR chips. |
| Capture Systems | Provides uniform, oriented ligand immobilization. | Biotinylated ligands + streptavidin-coated surface. |
| Running Buffer | Maintains consistent pH and ionic strength during analysis. | HEPES Buffered Saline (HBS-EP), with surfactant to minimize non-specific binding. |
| Regeneration Solutions | Removes bound analyte to regenerate the sensing surface. | Low pH (Glycine-HCl), high salt, or mild detergent solutions. |
| Blocking Agents | Reduces non-specific binding to the sensor surface. | BSA, casein, or proprietary commercial blockers. |
| Reference Compounds | Validates assay performance and serves as internal controls. | Known inhibitors/ligands with established binding parameters. |
Both SPR and LSPR technologies have evolved to meet HTS demands, but they occupy complementary niches. Modern SPR imaging excels in multiplexed, kinetics-enabled primary screening, providing rich biophysical data for hundreds of targets simultaneously. In contrast, plate-based LSPR leverages standard microplate formats for ultra-HTS hit identification, prioritizing extreme throughput and operational simplicity over detailed kinetic analysis. The choice between them is not one of superiority but of strategic alignment with the screening campaign's goals: depth of mechanistic insight (SPR) versus breadth of compound coverage (LSPR).
Within the context of a thesis on the fundamental differences between Surface Plasmon Resonance (SPR) and Localized Surface Plasmon Resonance (LSPR), the choice of instrumentation platform has profound implications for data quality, experimental throughput, and overall project cost. This guide provides a technical and economic analysis of commercial integrated systems versus custom-built setups, critical for researchers and drug developers in biosensing and binding characterization.
Core Technical Distinctions: SPR vs. LSPR
SPR relies on the excitation of surface plasmons on a continuous thin metal film (typically gold), producing an evanescent field that decays exponentially (~200-300 nm) into the analyte solution. LSPR utilizes resonant nanostructures (e.g., gold nanoparticles), where plasmon excitation is highly localized, resulting in a much shorter decay length (<10 nm). This fundamental difference dictates instrument design: SPR requires precise angular or wavelength interrogation of the reflected light, while LSPR systems primarily monitor localized scattering or absorption wavelength shifts.
Commercial platforms offer turnkey solutions with optimized fluidics, temperature control, integrated software for data acquisition and analysis, and vendor-supported assay kits and sensor chips.
Table 1: Representative Commercial SPR/LSPR Systems & Specifications
| System (Vendor) | Technology | Key Specifications | Approx. Base Cost |
|---|---|---|---|
| Biacore 8K (Cytiva) | SPR (Angle) | 8 parallel channels, high throughput, ultra-low noise. | $450,000 - $600,000 |
| Sierra SPR (Bruker) | SPR (Angle) | Affordable, 2 channels, streamlined workflow. | $120,000 - $180,000 |
| Nicoya Lifesciences Alto | SPR (Image) | Digital microfluidics, 16 parallel spots, lower cost. | $60,000 - $90,000 |
| OpenSPR (Nicoya) | LSPR (NP-based) | Benchtop, low sample volume, kinetic analysis. | $30,000 - $50,000 |
| Biosensing Inst. SA | LSPR (Nanodisks) | High sensitivity, spectral scanning imaging. | $80,000 - $120,000 |
Custom-Built Setup Architecture
A custom setup typically involves assembling discrete components: a light source (LED, laser), optical components (lenses, polarizers, prism for SPR), a flow cell or sample stage, a spectrometer or photodetector, and a fluid handling system (syringe pumps, valves). Control and data acquisition are managed via lab-written software (e.g., LabVIEW, Python).
Table 2: Custom Setup Component Cost Breakdown (Estimated)
| Component Category | Example Items | Approximate Cost Range | Notes |
|---|---|---|---|
| Optical Core | LED/Laser, Spectrometer, CCD Camera, Lenses, Prism | $15,000 - $50,000 | Cost scales with resolution/speed. |
| Fluidic System | Syringe Pumps, Microfluidic Chips, Valves, Tubing | $5,000 - $20,000 | Manual vs. automated control. |
| Sample Stage | Precision XYZ Stage, Flow Cell Holder | $3,000 - $15,000 | Critical for alignment and stability. |
| Data Acquisition | DAQ Card, Controller Hardware | $1,000 - $10,000 | |
| Sensor Chips | Gold films, Functionalized Nanoparticles | $100 - $500 per batch | In-house fabrication can reduce cost. |
| Total Estimated | Basic Functional System | $25,000 - $100,000 | Excluding significant labor cost. |
Operational Cost Analysis
Table 3: Five-Year Operational Cost Projection (Comparative)
| Cost Factor | Commercial SPR (High-End) | Custom SPR/LSPR Setup |
|---|---|---|
| Capital Investment | $500,000 | $60,000 |
| Annual Service Contract | $50,000 (10-15% of capital) | $0 (self-maintained) |
| Consumables (Chips/Channels) | $300 - $500 per chip | $50 - $150 per chip/batch |
| Assay Development Kits | Often proprietary, high cost ($1k+) | In-house preparation, low cost |
| Dedicated Staff Time | Lower training burden, standardized protocols | Very high for development, troubleshooting, and maintenance |
| Upgrade Path | Vendor-defined, costly modules | Highly flexible, modular component swap |
| Total 5-Year Estimate | $850,000 - $1,100,000 | $100,000 - $200,000 + significant labor |
Experimental Protocol: Kinetic Binding Assay
A standard protocol for characterizing antibody-antigen binding kinetics, applicable to both SPR and LSPR systems with appropriate sensor surfaces.
1. Sensor Surface Preparation:
- Commercial: Dock a vendor sensor chip (e.g., CM5 for SPR, NP-coated for LSPR). Prime system with HBS-EP buffer (10 mM HEPES, 150 mM NaCl, 3 mM EDTA, 0.05% v/v Surfactant P20, pH 7.4).
- Custom: Mount a clean gold sensor. For SPR, perform in-situ cleaning via piranha solution (Caution: Highly corrosive). For LSPR, immobilize synthesized gold nanoparticles via amine or thiol coupling.
2. Ligand Immobilization:
- Activate carboxylated surface (commercial chip or self-assembled monolayer) with a 1:1 mixture of 0.4 M EDC and 0.1 M NHS for 7 minutes.
- Dilute ligand (e.g., antigen) to 10-50 µg/mL in 10 mM sodium acetate buffer (pH 4.5-5.5). Inject over surface for 5-10 minutes to achieve desired immobilization level (e.g., 100 Response Units for SPR, 2 nm shift for LSPR).
- Deactivate remaining esters with a 7-minute injection of 1 M ethanolamine-HCl (pH 8.5).
3. Kinetic Measurement:
- Set system temperature to 25°C. Use a continuous flow of HBS-EP buffer at 30 µL/min.
- Prepare a 2-fold dilution series of the analyte (e.g., antibody) in running buffer.
- For each concentration, inject analyte for 3 minutes (association phase), followed by buffer-only flow for 5-10 minutes (dissociation phase).
- Regenerate the surface with a 30-second pulse of 10 mM glycine-HCl (pH 2.0) without damaging the ligand.
4. Data Analysis:
- Reference channel/subtract buffer injections.
- Fit the sensorgram data globally to a 1:1 Langmuir binding model using software (commercial BIAevaluation/Scrubber or custom Python/R scripts) to extract association (ka) and dissociation (kd) rate constants. Calculate equilibrium dissociation constant KD = kd/ka.
Visualization: SPR vs LSPR Experimental Workflow
Diagram 1: SPR/LSPR Binding Assay Workflow
Diagram 2: System Decision Trade-offs Summary
The Scientist's Toolkit: Key Research Reagent Solutions
Table 4: Essential Materials for SPR/LSPR Experiments
| Item | Function | Typical Commercial Source | Notes for Custom Labs |
|---|---|---|---|
| Sensor Chips | Provides the gold film or nanostructured surface for plasmon excitation and ligand attachment. | Cytiva (CM series), Bruker, Nicoya, Biosensing Inst. | In-house gold deposition via sputtering/evaporation. Nanoparticle synthesis (citrate reduction). |
| Coupling Chemistry Kits | Contains EDC, NHS, and ethanolamine for standardized amine coupling. | Cytiva, Thermo Fisher, XanTec | Can source reagents separately (Sigma-Aldrich) at lower cost but requires optimization. |
| Running Buffer | Provides a consistent, non-interacting matrix for sample dilution and flow. | Commercial HBS-EP or PBS-P+ buffers. | Standard lab preparation. Must be filtered (0.22 µm) and degassed for stable baselines. |
| Regeneration Solutions | Gently removes bound analyte without damaging the immobilized ligand. | Glycine-HCl, NaOH solutions of varying pH. | Low-pH buffers are common. Must be optimized for each ligand-analyte pair. |
| Kinetic Analysis Software | Processes sensorgram data to extract rate and affinity constants. | BIAevaluation, Scrubber, TraceDrawer. | Open-source options (Python with SciPy, R with drc package) require programming expertise. |
| Reference Compounds | Known binders/non-binders for system performance qualification. | Vendor-supplied control kits. | In-house purified proteins with well-characterized interactions. |
Within the broader research thesis explaining the differences between Surface Plasmon Resonance (SPR) and Localized Surface Plasmon Resonance (LSPR), a critical practical question emerges: which technology should a researcher select for a given application? This guide provides an in-depth technical comparison, using case studies to illustrate the decision-making process. The core distinction lies in SPR's superior quantitative accuracy for detailed kinetic analysis versus LSPR's advantages in rapid, lower-cost, and higher-throughput screening environments.
Quantitative Technology Comparison
The following table summarizes the key performance and operational parameters differentiating SPR and LSPR platforms, based on current market systems and published literature.
| Parameter | SPR (e.g., Biacore, Nicoya) | LSPR (e.g., NanoSPR, Spectral Instruments) | Implication for Choice |
|---|---|---|---|
| Detection Mechanism | Propagation of plasmons on a thin metal film. | Oscillation of plasmons on metallic nanoparticles. | LSPR is more compact; SPR requires precise optics. |
| Assay Cost per Sample | High ($50 - $150, reagent-intensive). | Low ($5 - $20, minimal reagent use). | LSPR is preferred for large screening campaigns. |
| Kinetic Rate Constant Range | Broad ((ka) up to ~10^7 M⁻¹s⁻¹, (kd) down to ~10^-6 s⁻¹). | Narrower, best for moderate to fast kinetics. | SPR is essential for characterizing very slow off-rates. |
| Sample Throughput | Medium (10s-100s of samples/day). | Very High (100s-1000s of samples/day). | LSPR excels in primary drug candidate screening. |
| Mass Sensitivity | ~1 pg/mm² (Extremely high). | ~10-100 pg/mm² (High). | SPR detects smaller molecules and subtle conformational changes. |
| Refractive Index (RI) Sensitivity | 10^2 – 10^3 RIU⁻¹ (High). | 10^1 – 10^2 RIU⁻¹ (Good). | SPR is more susceptible to bulk RI noise, requiring stringent controls. |
| Required Sample Volume | Low-Micro to Nano-liters (10-200 µL). | Ultra-Low Volume (1-20 µL). | LSPR is ideal for precious or low-concentration samples. |
| Primary Output | Sensoryram (Response vs. Time). | Peak Wavelength Shift (Δλ max vs. Time). | SPR data is directly convertible to bound mass. |
Case Study 1: High-Accuracy Kinetics for Lead Optimization (SPR)
Objective: Precisely determine the kinetic rate constants ((ka), (kd)) and affinity ((K_D)) of engineered monoclonal antibody variants binding to a soluble antigen to select the clinical candidate.
Protocol: Multi-Cycle Kinetic Analysis via SPR
- Chip Preparation: A CM5 sensor chip is docked. Flow cells are activated with a 1:1 mixture of 0.4 M EDC and 0.1 M NHS for 7 minutes.
- Ligand Immobilization: The antigen is diluted to 10 µg/mL in 10 mM sodium acetate buffer (pH 4.5) and injected over one flow cell for 5-10 minutes to achieve a target immobilization level of 50-100 Response Units (RU). The reference flow cell is activated and blocked without antigen. Remaining active esters are blocked with a 7-minute injection of 1 M ethanolamine-HCl (pH 8.5).
- Analyte Binding Series: A dilution series (e.g., 0.78, 1.56, 3.125, 6.25, 12.5, 25 nM) of each antibody variant is prepared in HBS-EP+ running buffer (0.01 M HEPES, 0.15 M NaCl, 3 mM EDTA, 0.005% v/v Surfactant P20, pH 7.4). Each concentration is injected over the reference and antigen surfaces at a flow rate of 30 µL/min for a 180-second association phase, followed by a 600-second dissociation phase in running buffer.
- Surface Regeneration: After each cycle, the sensor surface is regenerated with a 30-second pulse of 10 mM glycine-HCl (pH 2.0).
- Data Processing: Reference flow cell and buffer blank sensorgrams are subtracted. The resulting dataset is fit to a 1:1 Langmuir binding model using the instrument's software (e.g., Biacore Evaluation Software) to extract (ka), (kd), and calculate (KD) ((kd/k_a)).
Case Study 2: Rapid Screening for Hit Identification (LSPR)
Objective: Screen a 10,000-member small-molecule fragment library against a immobilized protein target to identify initial "hit" binders.
Protocol: High-Throughput End-Point Screening via LSPR
- Nanoparticle Chip Functionalization: A 96-well LSPR microplate with gold nanotriangles in each well is used. Each well is incubated with 50 µL of a 1 mM solution of a thiolated capture linker (e.g., DHLA-PEG-NHS) for 1 hour. The plate is washed.
- Target Immobilization: The protein target (with an accessible lysine) is diluted to 5 µg/mL in phosphate buffer (pH 7.4) and 20 µL is added to each well for 30 minutes. The plate is washed with buffer to remove unbound protein.
- Fragment Library Incubation: Using an automated liquid handler, 10 µL of each fragment compound (at 100 µM in buffer with 1% DMSO) is added to separate wells. Controls (buffer only, known inhibitor) are added to designated wells. The plate is incubated for 15 minutes with gentle shaking.
- Endpoint Measurement: The plate is read in a plate reader-based LSPR system. The peak extinction wavelength (λ max) for each well is measured in under 1 second per well.
- Hit Identification: A significant negative wavelength shift (Δλ max > 3 * standard deviation of control wells) indicates binding. Hits from this primary screen are flagged for secondary, dose-response validation.
Signaling & Experimental Pathways
Title: SPR vs LSPR Technology Selection Workflow
Title: SPR and LSPR Core Experimental Pathway
The Scientist's Toolkit: Research Reagent Solutions
| Item | Function | Typical Application |
|---|---|---|
| Carboxymethylated Dextran (CM5) Sensor Chip (SPR) | A gold film coated with a hydrogel matrix providing a versatile surface for covalent ligand immobilization via amine coupling. | Immobilization of proteins, antibodies, or DNA for kinetic analysis. |
| NHS/EDC Crosslinker Kit | 1-ethyl-3-(3-dimethylaminopropyl)carbodiimide (EDC) and N-hydroxysuccinimide (NHS) activate carboxyl groups on the chip surface for amine coupling. | Standard covalent attachment of protein ligands in SPR. |
| HBS-EP+ Running Buffer | HEPES-buffered saline with EDTA and polysorbate detergent. Provides a stable pH and ionic strength while minimizing non-specific binding. | Standard running buffer for most SPR biomolecular interactions. |
| Gold Nanoparticle LSPR Substrate | A glass slide or microplate well functionalized with shaped gold nanoparticles (e.g., triangles, stars). The core transducer for LSPR. | Base substrate for all LSPR binding assays. |
| Thiol-PEG-Alkyne/Azide Linker | A heterobifunctional linker with a thiol for gold attachment and a click chemistry group for bioorthogonal ligand immobilization. | Controlled, oriented immobilization of ligands on LSPR nanoparticles. |
| Regeneration Solution (Glycine-HCl, pH 2.0) | A low-pH buffer that disrupts protein-protein interactions without denaturing the immobilized ligand. | Removing bound analyte to regenerate the SPR sensor surface between cycles. |
| Anti-His Tag Capture Antibody | Immobilized on the sensor surface to capture his-tagged proteins, enabling analysis of native ligands and easy surface refresh. | Capturing his-tagged protein targets for SPR kinetic studies. |
| Dextran or PEG-Based Passivation Reagents | Inert polymers used to coat sensor surfaces and minimize non-specific adsorption of analytes. | Critical for reducing background noise in both SPR and LSPR, especially for crude samples. |
Within the broader thesis of SPR vs. LSPR technologies, a critical component is data validation. Surface Plasmon Resonance (SPR) and Localized Surface Plasmon Resonance (LSPR) are powerful for real-time, label-free binding analysis. However, to build robust binding models for drug development, corroboration with orthogonal techniques—Isothermal Titration Calorimetry (ITC), Biolayer Interferometry (BLI), and Mass Spectrometry (MS)—is essential. This guide details the methodologies for correlation, providing a framework for cross-platform validation.
Core Technology Comparison and Correlation Rationale
SPR and LSPR measure binding kinetics and affinity via refractive index changes near a sensor surface. SPR employs a propagating plasmon wave, while LSPR uses localized plasmons from nanostructures, leading to differences in sensitivity, surface sensitivity, and instrument footprint. Orthogonal methods validate these findings by probing different physical principles: ITC measures heat change (thermodynamics), BLI analyzes interference patterns (kinetics & affinity), and MS determines molecular mass (stoichiometry and identity).
Table 1: Comparative Overview of Label-Free Binding Analysis Techniques
| Technique | Measured Parameter | Key Outputs | Throughput | Sample Consumption | Primary Validation Role |
|---|---|---|---|---|---|
| SPR | Refractive Index Shift | ka, kd, KD, Rmax | Medium-High | Low-Moderate | Primary kinetic/affinity data |
| LSPR | Local RI Shift | KD, Binding Events | High | Very Low | Affinity, particularly for small molecules & NPs |
| ITC | Heat Change | KD, ΔH, ΔS, n (stoichiometry) | Low | High | Thermodynamic profiling & solution-phase affinity |
| BLI | Interference Pattern | ka, kd, KD | Medium | Low | Kinetic/affinity validation in a dip-and-read format |
| MS (Native) | Mass-to-Charge Ratio | Molecular Weight, Complex Stoichiometry | Medium | Very Low | Confirm binding identity & stoichiometry |
Detailed Experimental Protocols for Correlation
Protocol 1: SPR/LSPR & ITC Correlation for Protein-Ligand Binding
Objective: Correlate binding affinity (KD) and obtain full thermodynamic profile.
- SPR/LSPR Assay: Immobilize protein on CMS chip (SPR) or AuNP sensor (LSPR). Serial dilutions of analyte are flowed (SPR) or incubated (LSPR). Fit sensograms to 1:1 binding model for KD, ka, kd.
- ITC Assay: Load protein (20-50 µM) into cell, ligand (200-500 µM) into syringe. Perform 15-20 injections at constant temperature. Integrate heat peaks, fit to binding model to obtain KD, ΔH, ΔS, and n.
- Correlation: Plot SPR/LSPR-derived KD vs. ITC-derived KD. Expect agreement within one order of magnitude. Use ITC thermodynamics to contextualize kinetic data (e.g., entropy-driven binding may correlate with fast kon/koff).
Protocol 2: SPR/LSPR & BLI Correlation for Antibody-Antigen Kinetics
Objective: Validate kinetic parameters (ka, kd) across surface-based platforms.
- SPR Assay: Use anti-capture antibody to immobilize antigen on chip. Flow antibody as analyte. Perform association/dissociation cycles.
- BLI Assay: Immobilize antigen on Anti-HIS (for his-tagged antigen) or Streptavidin biosensor tips. Dip into antibody solutions for association, then into buffer for dissociation.
- Correlation: Directly compare ka and kd from SPR and BLI. Note: BLI's agitation can reduce mass transport effects. Differences may highlight surface chemistry or fluidics impacts.
Protocol 3: SPR/LSPR & Native MS for Complex Stoichiometry
Objective: Confirm binding identity and partner stoichiometry suggested by Rmax (SPR) or shift magnitude (LSPR).
- SPR/LSPR Assay: Perform binding experiment. Calculate theoretical Rmax for hypothesized stoichiometry.
- Native MS Assay: Mix protein and ligand in volatile buffer (e.g., ammonium acetate). Inject into mass spectrometer with gentle ionization (low voltage, nano-ESI). Analyze mass spectra for peaks corresponding to free protein and protein-ligand complex(es).
- Correlation: MS-derived complex mass confirms binding. Observed stoichiometry (e.g., 1:2 protein:ligand) should align with SPR/LSPR data fitting.
The Scientist's Toolkit: Research Reagent Solutions
Table 2: Essential Materials for Orthogonal Validation Workflows
| Item | Function & Application |
|---|---|
| CMS Sensor Chip (SPR) | Carboxymethylated dextran surface for covalent amine coupling of ligands/proteins. |
| Au-Nanoparticle Coated Plates (LSPR) | Functionalized gold nanoparticles for label-free affinity measurements in high-throughput screening. |
| Anti-HIS Capture Biosensors (BLI) | Biosensor tips for immobilizing HIS-tagged proteins for kinetic analysis. |
| Stirred-Titration Cell (ITC) | Ensures rapid mixing and precise temperature control for accurate measurement of heat changes. |
| Volatile Buffer (Ammonium Acetate) for Native MS | Maintains non-covalent interactions during ionization for analysis of intact complexes. |
| Regeneration Buffers (e.g., Glycine pH 2.0) | Removes bound analyte from SPR/BLI sensor surfaces for chip/tip re-use. |
Signaling Pathways and Experimental Workflows
Title: Orthogonal Validation Workflow from Sample to Model
Title: Fundamental Principles of SPR vs. LSPR Sensing
Effective validation of SPR and LSPR binding data through ITC, BLI, and MS is non-negotiable for rigorous drug discovery and basic research. Each orthogonal method provides a unique lens—thermodynamic, kinetic, or structural—that, when correlated, constructs a definitive and multi-dimensional picture of molecular interactions. This integrated approach mitigates the inherent limitations of any single technique and solidifies confidence in the resulting binding models.
Conclusion
SPR and LSPR are complementary pillars of label-free biosensing, each with distinct strengths rooted in their underlying plasmonic physics. SPR remains the gold standard for detailed thermodynamic and kinetic analysis of high-affinity interactions, while LSPR offers a path toward miniaturization, multiplexing, and point-of-care applications. The future lies in hybrid and next-generation plasmonic technologies that integrate the sensitivity of LSPR with the robust quantification of SPR, potentially enabling single-molecule detection and highly integrated diagnostic platforms. For researchers, the choice hinges on the specific biological question, required precision, throughput needs, and available resources. Continuous advancements in nanofabrication and data analytics promise to further blur the lines between these techniques, driving innovation in drug discovery, clinical diagnostics, and fundamental life science research.