Unlocking Cellular Secrets: A Guide to SPR Biosensing for Membrane Protein Interaction Analysis
Surface Plasmon Resonance (SPR) biosensing has revolutionized the quantitative, real-time analysis of membrane protein interactions, which are critical therapeutic targets.
Unlocking Cellular Secrets: A Guide to SPR Biosensing for Membrane Protein Interaction Analysis
Abstract
Surface Plasmon Resonance (SPR) biosensing has revolutionized the quantitative, real-time analysis of membrane protein interactions, which are critical therapeutic targets. This comprehensive guide explores the foundational principles of SPR technology tailored for challenging membrane systems, details advanced methodologies for lipid-based immobilization and assay design, and provides expert troubleshooting for common pitfalls. It further validates SPR's role by comparing it with complementary techniques like BLI and MST, and discusses its pivotal application in drug discovery and mechanistic studies for researchers and pharmaceutical professionals.
SPR Biosensing 101: Core Principles for Probing Membrane Protein Dynamics
Why Membrane Proteins Are Challenging Yet Crucial Targets for Biophysical Analysis
Within the broader thesis on Surface Plasmon Resonance (SPR) in membrane protein interaction studies, this application note details the unique challenges and essential protocols for analyzing these critical targets. Membrane proteins, constituting over 60% of drug targets, are embedded in lipid bilayers, making their isolation, stabilization, and functional analysis inherently difficult. Their dynamic nature and crucial roles in signaling, transport, and cell adhesion necessitate precise biophysical tools like SPR to quantify interactions in near-native environments.
Key Challenges in Membrane Protein Biophysics
The following table summarizes the primary obstacles and their implications for analysis.
Table 1: Core Challenges in Membrane Protein Analysis
| Challenge | Description | Impact on Biophysical Analysis |
|---|---|---|
| Hydrophobicity | Large hydrophobic surfaces require a lipid environment. | Detergent or lipid stabilization is mandatory, complicating sample prep and instrument compatibility. |
| Low Natural Abundance | Typically expressed at low levels in native tissues. | Requires overexpression systems; often yields low quantities of functional protein. |
| Structural Instability | Removal from bilayer destabilizes fold and function. | High rates of denaturation/aggregation; necessitates careful screening of stabilizing agents. |
| Complex Ligand Interactions | Binding events can involve allosteric modulation within the bilayer. | Assays must often replicate the asymmetric membrane environment for accurate kinetics. |
Application Notes & Protocols
AN-1: SPR Analysis of a GPCR-Ligand Interaction Using Nanodisc Reconstitution
This protocol leverages nanodiscs to present a GPCR in a native-like lipid environment for SPR screening of small molecule binders.
Research Reagent Solutions Toolkit
Table 2: Essential Materials for GPCR-SPR via Nanodiscs
| Item | Function |
|---|---|
| MSP1D1 Protein | Membrane scaffold protein forms the nanodisc belt. |
| Synthetic Lipids (e.g., POPC, POPG) | Forms the nanodisc bilayer core; composition can be tuned. |
| Detergent (e.g., DDM, CHS) | Solubilizes purified GPCR and lipids for nanodisc assembly. |
| Biotinylated Lipids | Incorporates into nanodisc for capture on streptavidin SPR chip. |
| Stabilizing Ligand | High-affinity binder to maintain GPCR conformation during reconstitution. |
| Streptavidin (SA) Sensor Chip | Gold standard for capturing biotinylated nanodiscs. |
| Running Buffer with CHS | Contains cholesterol hemisuccinate to enhance GPCR stability in flow. |
Protocol: Capture and Analysis of Nanodisc-Reconstituted GPCR
Nanodisc Reconstitution:
- Mix purified, detergent-solubilized GPCR with a mixture of POPC/POPG lipids and biotinylated-cap PE lipid (e.g., 85:10:5 molar ratio) in the presence of detergent.
- Add MSP1D1 scaffold protein at a 1:100 GPCR:MSP molar ratio.
- Initiate self-assembly by removing detergent via incubation with bio-beads. Purify monodisperse GPCR-nanodiscs via size-exclusion chromatography.
SPR Sensor Chip Preparation:
- Prime a streptavidin (SA) chip with running buffer (e.g., 20 mM HEPES, 150 mM NaCl, 0.01% CHS, pH 7.4).
- Capture biotinylated nanodiscs (empty or containing GPCR) on separate flow cells to achieve a density of ~2000-5000 RU. Use an empty nanodisc flow cell as a reference.
Ligand Binding Analysis:
- Dilute small molecule analytes in running buffer.
- Inject analytes over reference and active surfaces at a flow rate of 30 µL/min for 2-3 minutes, followed by dissociation.
- Regenerate the surface with a 30-second pulse of 10 mM NaOH.
- Analyze double-referenced sensorgrams (active minus reference, then analyte minus buffer injection) using a 1:1 binding model to determine kinetics (ka, kd) and affinity (KD).
AN-2: Kinetic Characterization of an Immune Checkpoint Protein Interaction
This protocol details the analysis of the full-length, detergent-solubilized PD-1/PD-L1 interaction, a critical immune checkpoint pair.
Protocol: Capture of His-Tagged PD-1 on NTA Chip
Protein and Chip Preparation:
- Purify full-length human PD-1 with a C-terminal His-tag in a stabilizing detergent (e.g., 0.05% DDM).
- Pre-charge an NTA sensor chip with 0.5 mM NiCl2 for 2 minutes.
- Dilute PD-1 to 5 µg/mL in HBS-P+ buffer (0.05% DDM) and inject for 4-7 minutes to achieve ~100 RU of captured protein.
Binding Assay:
- Inject a concentration series of purified PD-L1 extracellular domain (or full-length in detergent) over the PD-1 surface and a reference flow cell.
- Use a flow rate of 30 µL/min with 3-minute association and 5-minute dissociation phases.
- Regenerate with a 1-minute pulse of 350 mM EDTA to strip Ni2+ and the His-tagged protein.
- Re-charge with NiCl2 before the next capture cycle. Fit data to a 1:1 binding model.
Table 3: Representative SPR Kinetic Data for Membrane Protein Targets
| Target (Format) | Interactor | ka (1/Ms) | kd (1/s) | KD (nM) | Assay Format |
|---|---|---|---|---|---|
| GPCR-A (Nanodisc) | Antagonist B | 2.5 x 10^5 | 1.0 x 10^-3 | 4.0 | Capture (Biotin-Lipid) |
| PD-1 (DDM micelle) | PD-L1 | 1.8 x 10^6 | 5.5 x 10^-4 | 0.31 | Capture (His-Tag) |
| Ion Channel X (Liposome) | Toxin Y | 5.0 x 10^4 | 2.0 x 10^-2 | 400 | Capture (Biotin-Lipid) |
Visualization of Workflows and Pathways
SPR Workflow for GPCR in Nanodiscs
PD-1/PD-L1 Immune Checkpoint Pathway
Thesis Context
This application note is framed within a broader thesis on advancing membrane protein interaction studies using Surface Plasmon Resonance (SPR). The real-time, label-free nature of SPR is uniquely suited for probing the complex kinetics and thermodynamics of membrane protein-ligand interactions, which are critical targets in modern drug discovery.
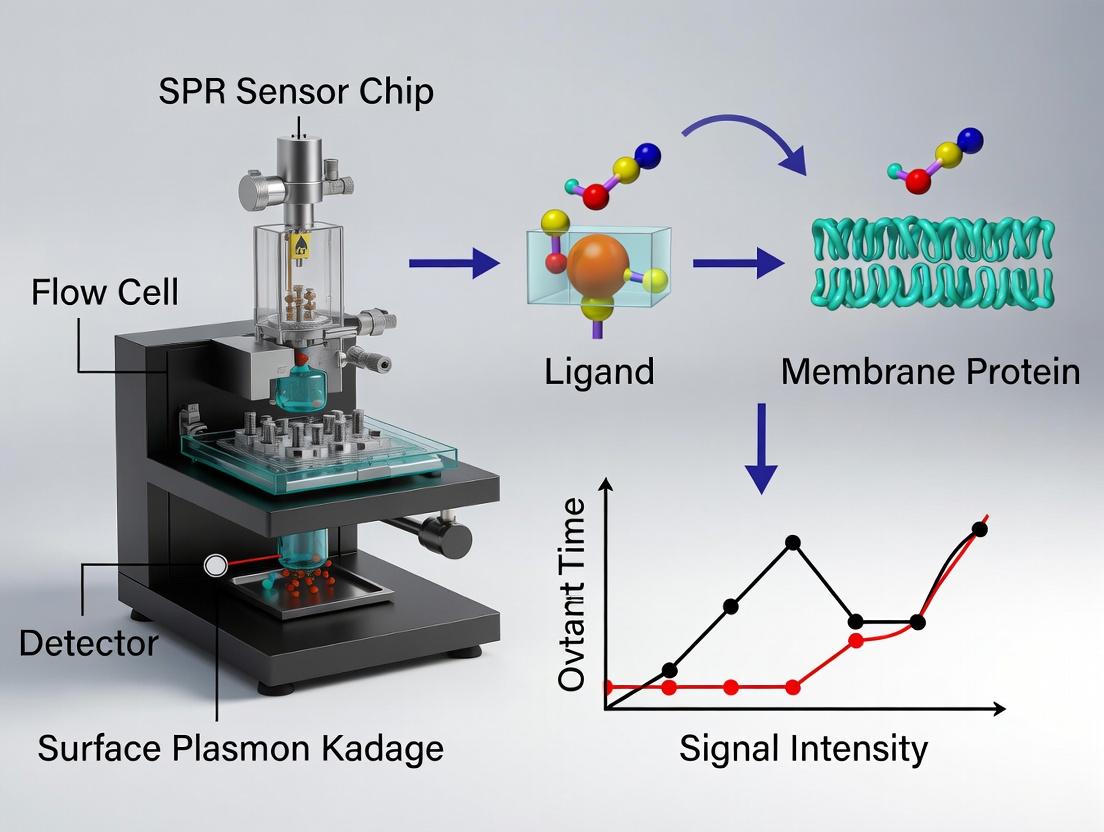
Surface Plasmon Resonance detects changes in the refractive index at the surface of a thin metal film (typically gold). When plane-polarized light strikes the film under conditions of total internal reflection, it generates an evanescent wave that excites surface plasmons (coherent electron oscillations). This results in a dip in reflected light intensity at a specific resonance angle. This angle is exquisitely sensitive to changes in mass on the sensor surface, allowing for the direct measurement of biomolecular binding events in real time.
Table 1: Core Physical Parameters of a Typical SPR Experiment
| Parameter | Typical Value/Description | Impact on Measurement |
|---|---|---|
| Sensor Chip Gold Layer Thickness | ~50 nm | Optimizes plasmon excitation and evanescent field penetration. |
| Evanescent Field Penetration Depth | ~200-300 nm | Defines the sensing volume; interactions must occur within this range. |
| Refractive Index Unit (RIU) | 1 RIU = 10⁻⁶ refractive index change | Standard unit for reporting SPR response. |
| Response Unit (RU) | 1 RU ≈ 1 pg/mm² surface mass change | Calibrated relationship linking angle shift to mass. |
| Typical Baseline Noise | < 0.1 RU (RMS) | Determines detection limit for small molecules and weak binders. |
| Association Rate Constant (kₐ) | 10³ to 10⁷ M⁻¹s⁻¹ | Measured from binding phase slope/concentration. |
| Dissociation Rate Constant (k_d) | 10⁻⁵ to 10⁻¹ s⁻¹ | Measured from dissociation phase decay. |
| Equilibrium Dissociation Constant (K_D) | pM to mM range (KD = kd/kₐ) | Calculated from rate constants or steady-state response. |
Key Protocols for Membrane Protein Studies
Protocol 2.1: Immobilization of Lipid Vesicles for Membrane Protein Reconstitution
Objective: Create a stable, fluid lipid bilayer environment on an SPR sensor chip to host functional membrane proteins.
- Sensor Chip Preparation: Use an L1 series sensor chip (hydrophobic alkyl chains) or a clean gold chip for subsequent liposome fusion.
- Liposome Preparation: Prepare small unilamellar vesicles (SUVs, ~50-100 nm) via extrusion. Lipid composition should mimic the native membrane (e.g., POPC with cholesterol). For membrane protein incorporation, use proteoliposomes prepared by detergent removal.
- Capture: Inject liposome suspension (0.5-1.0 mg/mL in running buffer) at a low flow rate (2-5 µL/min) for 10-15 minutes. A rapid increase in RU indicates vesicle adsorption.
- Stabilization: Inject a mild detergent (e.g., 40 mM octyl glucoside) for 1-2 minutes to lyse adsorbed vesicles and form a continuous supported lipid bilayer (SLB). A ~50% drop in RU confirms bilayer formation.
- Conditioning: Wash with running buffer until a stable baseline is achieved. The surface is now ready for interaction analysis.
Protocol 2.2: Kinetic Analysis of a Small Molecule Inhibitor Binding to a Captured Membrane Receptor
Objective: Determine the kinetic rate constants and affinity of a drug candidate for a membrane-embedded target.
- Ligand Capture: Immobilize the target membrane protein via a high-affinity capture antibody or His-tag/Ni-NTA interaction on an SLB surface. Aim for a capture level of 50-100 RU for kinetic analysis.
- Analyte Preparation: Prepare a 2-fold dilution series of the small molecule inhibitor (e.g., from 100 nM to 1.56 nM) in running buffer with matched DMSO concentration (≤1%).
- Binding Cycle:
- Baseline: Run buffer for 60 sec.
- Association: Inject analyte for 120-180 sec at high flow rate (30-50 µL/min) to minimize mass transport limitation.
- Dissociation: Switch to buffer flow for 300-600 sec.
- Regeneration: Inject a mild regeneration solution (e.g., 10 mM glycine, pH 2.0) for 30 sec to remove bound analyte without damaging the captured receptor. Re-equilibrate with buffer.
- Data Processing: Double-reference all sensograms (subtract reference flow cell and blank buffer injections). Fit the concentration series globally to a 1:1 Langmuir binding model using the instrument's software to extract kₐ, kd, and KD.
Visualization
Diagram 1: SPR Optical Phenomenon & Signal Generation
Diagram 2: Membrane Protein Interaction Analysis Workflow
Diagram 3: Key Steps in a Single SPR Sensorgram
The Scientist's Toolkit: Key Research Reagent Solutions
Table 2: Essential Materials for SPR Membrane Protein Studies
| Item / Reagent Solution | Function & Critical Role |
|---|---|
| L1 or HPA Sensor Chip | L1: Hydrophobic surface for liposome capture/bilayer formation. HPA: Hydrophobic alkylthiol for planar monolayer formation. Essential for mimicking membrane environment. |
| Pioneer FE Series Chip (Biacore) | Next-gen sensor chips with higher sensitivity and stability, enabling work with low-abundance membrane targets and small molecules. |
| Lipid Kits (e.g., POPC, DOPC, Brain Lipid Extracts) | For preparing liposomes/proteoliposomes with defined or native composition. Critical for maintaining protein function. |
| n-Dodecyl-β-D-Maltopyranoside (DDM) | Mild, non-ionic detergent commonly used for membrane protein solubilization and stabilization prior to reconstitution. |
| CMS Sensor Chip with Ni-NTA Chemistry | For capturing His-tagged membrane proteins directly or via captured liposomes. Provides oriented immobilization. |
| Anti-GST or Anti-Fc Capture Antibodies | For capturing GST- or Fc-tagged membrane protein constructs, allowing uniform presentation on the sensor surface. |
| High-Performance SPR Running Buffers | HBS-EP+ or PBS-P+: Buffer with additives to minimize non-specific binding and maintain protein stability during long experiments. |
| Regeneration Scouting Kits | Pre-formatted pH, ionic strength, or competitor solutions to identify optimal regeneration conditions without damaging the expensive membrane surface. |
Within the broader thesis on Surface Plasmon Resonance (SPR) in membrane protein interaction studies, this document delineates the pivotal advantages of label-free SPR biosensing. The core thesis posits that SPR's capacity for real-time, quantitative analysis of unmodified membrane proteins within mimetic environments provides unparalleled insights into interaction kinetics, affinity, and specificity, thereby accelerating functional characterization and drug discovery.
SPR directly measures biomolecular interactions by detecting changes in refractive index at a sensor surface. For membrane proteins, this yields three critical advantages:
Table 1: Key SPR Advantages for Membrane Protein Studies
| Advantage | Description | Typical SPR Output | Impact on Research |
|---|---|---|---|
| Real-time Kinetics | Measures on- (k_on) and off-rates (k_off) in real time without labels. |
Association & Dissociation sensorgrams. | Reveals mechanism of interaction; distinguishes compounds based on binding kinetics. |
| Affinity (KD) | Calculates equilibrium dissociation constant from kinetic rates or steady-state. | KD = k_off / k_on (kinetic) or steady-state analysis. |
Provides precise binding strength (pM to mM range). |
| Specificity & Screening | Detects binding of analytes in crude mixtures to immobilized target; no labeling required. | Response Units (RU) shift specific to target interaction. | Enables primary screening and epitope mapping; validates target engagement. |
Table 2: Example Kinetic & Affinity Data for Model Membrane Protein GPCR (β2-Adrenergic Receptor)
| Ligand/Analyte | Immobilization Method | k_on (1/Ms) |
k_off (1/s) |
KD (M) |
Assay Format |
|---|---|---|---|---|---|
| Biotinylated Nanobody | Capture on Streptavidin chip | 2.5 x 10^5 |
1.0 x 10^{-3} |
4.0 x 10^{-9} |
Direct binding to receptor. |
| Alprenolol (Antagonist) | Receptor in LNP captured | 1.8 x 10^6 |
5.0 x 10^{-3} |
2.8 x 10^{-9} |
Ligand binding to immobilized receptor. |
| Isoproterenol (Agonist) | Receptor in LNP captured | 9.5 x 10^5 |
1.2 x 10^{-2} |
1.3 x 10^{-8} |
Ligand binding to immobilized receptor. |
Detailed Experimental Protocols
Protocol 1: Immobilization of Membrane Protein via Liposome/Nanodisc Capture
Objective: To stably incorporate a purified membrane protein (e.g., GPCR, ion channel) into a lipid bilayer environment on an SPR sensor chip for interaction studies.
- Chip Preparation: Use an L1 Series S Sensor Chip. Prime the SPR system with running buffer (e.g., HBS-P+ buffer: 10 mM HEPES, 150 mM NaCl, pH 7.4).
- Lipid Vesicle Coating: Inject a solution of small unilamellar vesicles (SUVs, 100 nm, e.g., POPC:POPG 7:3) at 5 µL/min for 10-20 minutes until a stable baseline increase (~5000-10000 RU) is achieved.
- Surface Stabilization: Inject 40 mM n-Octyl β-D-glucopyranoside (OG) for 1-2 minutes to create a smooth, saturated lipid bilayer.
- Protein Reconstitution:
- Direct Incorporation: Inject purified membrane protein in detergent (e.g., DDM) at 2-10 µg/mL for 5-10 minutes. The protein will insert into the fluid lipid layer.
- Nanodisc Capture: Inject pre-formed Nanodiscs containing the target protein at 50-100 nM for 5-10 minutes. The Nanodiscs fuse with the chip's lipid layer.
- Surface Washing: Perform 2-3 injections of 10 mM NaOH (or suitable regeneration buffer) for 30-60 seconds to remove non-specifically bound material. A stable baseline indicates a ready sensor surface.
Protocol 2: Kinetic Analysis of a Small Molecule Inhibitor Binding to an Immobilized Transporter
Objective: To determine the kinetic rate constants and affinity of a drug candidate for a captured SLC transporter protein.
- Ligand Immobilization: Follow Protocol 1 to capture the transporter protein. Record the final immobilization level (R_max approx.).
- Analyte Preparation: Prepare a 2-fold dilution series (e.g., 0.78 nM to 100 nM) of the inhibitor in running buffer. Include a zero-concentration (buffer) sample for double-referencing.
- Binding Cycle:
- Contact Time: 120 seconds association phase at a flow rate of 30 µL/min.
- Dissociation Time: 180-300 seconds dissociation phase with buffer flow.
- Regeneration: Inject a mild regeneration solution (e.g., 0.5% DMSO in buffer or a low pH glycine buffer) for 30 seconds to remove bound analyte without damaging the protein.
- Data Analysis:
- Subtract reference flow cell and buffer injection sensorgrams.
- Fit the globally aligned sensorgrams to a 1:1 Langmuir binding model using the SPR instrument's software (e.g., Biacore Evaluation Software).
- Report
k_on,k_off,KD, andχ^2(goodness of fit).
Visualization: Pathways and Workflows
(Title: SPR Principle and Real-Time Detection)
(Title: Membrane Protein SPR Assay Workflow)
The Scientist's Toolkit: Research Reagent Solutions
Table 3: Essential Materials for SPR-Based Membrane Protein Studies
| Reagent/Material | Function & Role in Assay | Example Product/Chemical |
|---|---|---|
| L1 Sensor Chip | Hydrophobic alkanethiol surface for capturing lipid vesicles/nanodiscs, creating a fluid bilayer. | Cytiva Series S L1 Chip, Nicoya NTA-Lipid Bilayer Chip. |
| Lipids for Vesicles/Nanodiscs | Form the native-like membrane environment; composition affects protein stability and function. | POPC, POPG, Cholesterol, Brain Lipid Extracts. |
| Membrane Scaffold Protein (MSP) | Encircles lipid bilayer to form stable, water-soluble Nanodiscs of defined size. | MSP1D1, MSP1E3D1. |
| Detergents | Solubilize and purify membrane proteins; critical for micelle dilution during direct capture. | n-Dodecyl-β-D-maltoside (DDM), Lauryl Maltose Neopentyl Glycol (LMNG). |
| Capture Tags & Surfaces | Enables oriented, stable immobilization. Alternative to lipid capture. | Streptavidin (SA) Chip + biotinylated protein, Anti-His antibody surface. |
| Running Buffer & Additives | Maintains protein stability, minimizes non-specific binding. | HEPES or PBS buffers with surfactant (e.g., Tween-20) and sometimes cholesterol. |
| Regeneration Solutions | Gently removes bound analyte without denaturing the immobilized membrane protein. | Low/high pH glycine buffers, mild detergents, or competitive ligands. |
This application note provides a foundational overview of Surface Plasmon Resonance (SPR) instrumentation and sensor chip technology, framed within the critical context of membrane protein interaction studies. For researchers investigating ligand binding, kinetics, and thermodynamics of membrane-associated targets—a central theme in drug discovery—understanding the core hardware and consumables is paramount. SPR offers a label-free, real-time method to characterize these often challenging interactions.
Core SPR Instrumentation
Modern SPR systems consist of an optical system to generate and measure the plasmon resonance, a fluidic system for precise sample delivery, and integrated software for data acquisition and analysis. The table below summarizes key specifications for leading commercial platforms relevant to membrane protein research.
Table 1: Comparison of Representative SPR Instrumentation
| Instrument Model | Manufacturer | Key Feature | Throughput (Flow Cells) | Typical Sensitivity (RU) | Suitability for Membrane Proteins |
|---|---|---|---|---|---|
| Biacore 8K | Cytiva | High-throughput, multi-cycle kinetics | 8 (upgradable) | <0.03 RU (RMSD) | Excellent: supports lipid-coated chips, high sensitivity for low-abundance targets. |
| Sierra SPR-32 | Bruker | Array-based, 32 parallel spots | 32 (on one flow cell) | ~1 RU | Good for screening: parallel analysis of multiple conditions or analytes simultaneously. |
| Reichert 4SPR | AMETEK | Four independent, parallel channels | 4 | <0.1 RU | Good: independent reference subtraction, useful for vesicle capture studies. |
| OpenSPR | Nicoya Lifesciences | Benchtop, low-volume | 2 | ~5 RU | Accessible: suitable for initial ligand screening and teaching labs. |
| SPR Navi 220 | BioNavis | Multi-parameter, MP-SPR | 2 (wavelength scanning) | N/A (measures layer thickness) | Excellent: measures conformational changes in lipid layers and embedded proteins. |
Sensor Chip Technology: The Foundation for Membrane Mimetics
The sensor chip is the functional heart of an SPR experiment. For membrane protein studies, chips that incorporate a lipid bilayer environment are essential to maintain protein native conformation and activity.
Table 2: Common Sensor Chip Surfaces for Membrane Protein Studies
| Chip Type (Series) | Surface Chemistry | Immobilization Strategy | Key Application in Membrane Protein Research |
|---|---|---|---|
| L1 (Cytiva) | Hydrophobic alkane thiols | Direct capture of lipid vesicles or nanodiscs to form a hybrid bilayer. | Studying integral membrane proteins reconstituted in vesicles. |
| HPA (Cytiva) | Flat hydrophobic monolayer | Formation of a stable, single supported lipid bilayer. | Kinetics of peripheral membrane protein binding to defined lipid compositions. |
| NTA (Cytiva) | Nitrilotriacetic acid (NTA) | Capture of His-tagged proteins or His-tagged nanodiscs. | Oriented immobilization of recombinant membrane proteins. |
| Pioneer LCP (Cytiva) | Lipidic Cubic Phase (LCP) | Immobilization of membrane proteins in a native-like cubic lipid matrix. | Characterization of proteins unstable in bilayers (e.g., GPCRs). |
| COOH (on various platforms) | Carboxylated dextran (CM) | Amine coupling of purified proteins or capturing via antibodies. | Capturing solubilized membrane proteins with an antibody "catch" assay. |
Experimental Protocol: Capturing Lipid Vesicles on an L1 Chip for Receptor-Ligand Analysis
This protocol details the formation of a supported hybrid lipid bilayer containing a reconstituted membrane protein for subsequent ligand binding studies.
Objective: To immobilize G protein-coupled receptor (GPCR)-containing liposomes on an L1 sensor chip and measure the binding kinetics of a small molecule antagonist.
Materials & Reagents:
- SPR instrument (e.g., Biacore 8K or equivalent)
- L1 Series Sensor Chip
- Running Buffer: HEPES Buffered Saline (HBS-EP+: 10 mM HEPES, 150 mM NaCl, 3 mM EDTA, 0.05% v/v Surfactant P20, pH 7.4)
- Vesicle Preparation Buffer: 20 mM HEPES, 100 mM NaCl, pH 7.4
- GPCR-reconstituted lipid vesicles (prepared via dialysis or extrusion)
- Control vesicles (lipids only, no protein)
- Regeneration Solution: 40 mM n-Octyl-β-D-glucopyranoside (OG)
- Ligand solutions (antagonist) in Running Buffer
Procedure:
- System Preparation: Prime the SPR instrument with degassed Running Buffer. Install the L1 chip.
- Baseline Stabilization: Flow Running Buffer over all flow cells at 10 µL/min until a stable baseline is achieved (~10-20 minutes).
- Surface Conditioning: Inject three 1-minute pulses of 40 mM OG at 30 µL/min to clean the hydrophobic surface.
- Vesicle Capture:
- Dilute GPCR-vesicles in Vesicle Preparation Buffer to 0.1-0.2 mg/mL lipid concentration.
- Inject the vesicle solution over the target flow cell(s) at a low flow rate (2-5 µL/min) for 15-30 minutes. Monitor the rapid increase in Response Units (RU) as vesicles fuse to form a hybrid bilayer.
- Inject control vesicles over a separate flow cell to serve as a reference surface.
- Surface Wash: Wash with multiple injections of Running Buffer at 50 µL/min to remove loosely associated vesicles and establish a stable baseline. A stable, elevated RU signal indicates a successful bilayer formation.
- Ligand Binding Kinetics:
- Switch to kinetic analysis buffer (Running Buffer without surfactant).
- Design a multi-cycle kinetics experiment with a 120-second association phase and a 300-second dissociation phase.
- Inject a series of ligand concentrations (e.g., 0.78 nM to 100 nM) in random order over both the active (GPCR) and reference (lipid-only) flow cells.
- Flow rate: 30 µL/min.
- Surface Regeneration: After each ligand cycle, regenerate the surface with a 30-second injection of Running Buffer. For strong binders, a brief (30-60 sec) injection of mild regeneration solution (e.g., 10 mM Glycine, pH 2.0) may be needed.
- Data Analysis: Subtract the reference flow cell sensorgram from the active flow cell sensorgram. Fit the resulting binding curves to a 1:1 Langmuir binding model using the instrument's software to determine the association rate (ka), dissociation rate (kd), and equilibrium dissociation constant (KD).
The Scientist's Toolkit: Key Research Reagent Solutions
Table 3: Essential Materials for SPR-based Membrane Protein Studies
| Item | Function & Rationale |
|---|---|
| Sensor Chips (L1, HPA, NTA) | Provide a tailored surface for immobilizing membrane mimetics (vesicles, nanodiscs, bilayers) or His-tagged targets. |
| Lipid Vesicles / Nanodiscs | Membrane mimetics that solubilize and present membrane proteins in a native-like lipid environment. Nanodiscs (MSP, Saposin) offer more uniform size. |
| n-Octyl-β-D-glucopyranoside (OG) | Mild detergent used to condition hydrophobic (L1) chips and, at low concentrations, to clean captured surfaces without complete bilayer disruption. |
| CM5 or CMS Sensor Chip | Standard dextran chip for immobilizing capture antibodies (for capturing solubilized membrane proteins) or secondary proteins (e.g., streptavidin for biotinylated ligands). |
| Amine Coupling Kit (NHS/EDC) | For covalent immobilization of antibodies, proteins, or other molecules containing primary amines onto carboxylated sensor surfaces. |
| HBS-EP+ Buffer | Standard running buffer; the chelating agent (EDTA) and surfactant (P20) minimize non-specific binding and baseline drift. |
| Biotinylated Ligands | Enable capture onto streptavidin-coated chips (SA chip) for precise orientation and studying low-molecular-weight analytes. |
| Kinetic Analysis Software (e.g., Biacore Evaluation Software, Scrubber) | Essential for processing sensorgrams (reference subtraction, solvent correction) and performing kinetic/affinity fitting using appropriate binding models. |
SPR Experimental Workflow and Data Pathway
SPR Experimental & Data Analysis Workflow
Signaling Pathway Analysis via SPR: GPCR-Ligand Binding
SPR Monitors GPCR-Ligand Binding Kinetics
Within the context of Surface Plasmon Resonance (SPR) studies of membrane protein interactions, the reconstitution of these proteins into a native-like lipid environment is not a mere convenience—it is a fundamental requirement for functional integrity. The choice of model system—nanodiscs, liposomes, or proteoliposomes—profoundly impacts the stoichiometry, kinetics, and thermodynamics of interactions observed in SPR biosensing. This application note provides current methodologies and comparative data to guide researchers in selecting and preparing the optimal lipid environment for SPR-based interrogation of membrane protein interactomes in drug discovery.
Comparative Analysis of Lipid Scaffold Platforms
The following table summarizes key characteristics of the three primary lipid model systems as they pertain to SPR experimental design and data quality.
Table 1: Quantitative Comparison of Lipid Model Systems for SPR Studies
| Parameter | Nanodiscs (MSP-based) | Liposomes (SUV) | Proteoliposomes |
|---|---|---|---|
| Typical Diameter (nm) | 8-13 (MSP1D1), 17 (MSP1E3D1) | 30-100 | 100-200 |
| Lipid Bilayer Curvature | High, flat patch | Moderate to high | Low (more planar) |
| Protein Orientation | Controlled (e.g., his-tag capture) | Random | Can be controlled via reconstitution method |
| Immobilization Strategy for SPR | Direct capture (NTA, streptavidin), amine coupling | L1 chip (lipophilic capture), biotin-PE/streptavidin | L1 chip, biotin-PE/streptavidin |
| Typical Rmax (RU per fmol) | 10-15 | 5-10 (L1 chip) | 5-10 (L1 chip) |
| Key Advantage for SPR | Homogeneous, monodisperse; ideal for precise kinetics | High signal; natural asymmetry possible | Most native-like environment; full transmembrane topology |
| Primary Limitation for SPR | Limited size; constrained lateral diffusion | Heterogeneity in size/encapsulation; non-specific binding | Heterogeneity; complex data analysis (mass transport) |
| Best for Studying | Soluble protein or drug binding to membrane protein | Lipid headgroup interactions; effector recruitment | Multi-pass transporter/ channel function; lipid trans-bilayer effects |
Protocols for SPR Sample Preparation
Protocol 1: Formation of Membrane Scaffold Protein (MSP) Nanodiscs
Objective: To incorporate a purified membrane protein into a homogeneous, monodisperse lipid bilayer nanodisc for SPR immobilization via an engineered tag on the MSP.
Materials:
- Purified membrane protein (in detergent, e.g., DDM)
- MSP1D1 or MSP1E3D1 protein
- Lipids (e.g., POPC, 70:30 POPC:POPS)
- Sodium cholate (or other detergent)
- Bio-Beads SM-2 (or dialysis equipment)
- Size-exclusion chromatography (SEC) column (e.g., Superdex 200 Increase)
- SPR running buffer (e.g., HBS-P+, 0.01% DDM optional)
Procedure:
- Lipid Stock Preparation: Mix lipids in chloroform, dry under nitrogen, and vacuum desiccate. Resuspend lipid film in buffer containing 50-100 mM sodium cholate to form micelles.
- Complex Formation: Combine membrane protein, MSP, and solubilized lipids at molar ratios typically ~1:5:100 (protein:MSP:lipid). Optimize ratios empirically. Incubate 1 hour at 4°C.
- Detergent Removal: Add pre-washed Bio-Beads (0.5 g/mL) to the mixture. Incubate with gentle agitation for 4 hours at 4°C. Replace with fresh Bio-Beads and incubate overnight.
- Purification: Remove Bio-Beads and purify the assembled nanodiscs via SEC. Collect the peak corresponding to the nanodisc-membrane protein complex (typically eluting before empty nanodiscs).
- SPR Immobilization: Dilute nanodiscs in SPR buffer. Inject over an NTA sensor chip pre-charged with Ni²⁺ to capture his-tagged MSP, or over a streptavidin chip if using biotinylated MSP.
Protocol 2: Preparation of Surface-Immobilized Proteoliposomes on an SPR L1 Chip
Objective: To form large, unilamellar proteoliposomes and capture them on an SPR sensor chip to present membrane proteins in a near-native, fluid bilayer for interaction analysis.
Materials:
- Purified membrane protein
- Lipids (e.g., DOPC, brain lipid extracts)
- Biotinyl-PE (for alternative capture)
- Detergent (e.g., OG, Triton X-100)
- Mini-extruder with 100 nm polycarbonate membranes
- Sephadex G-50 column (for detergent removal)
- SPR L1 Sensor Chip (lipophilic surface)
Procedure:
- Lipid Film & Hydration: Mix lipids (± 0.5-1% biotinyl-PE). Dry and desiccate. Hydrate lipid film in reconstitution buffer to 10 mg/mL, vortexing to form multilamellar vesicles (MLVs).
- Protein Incorporation: Detergent-Mediated Reconstitution: Solubilize MLVs with detergent (at CMC). Add purified membrane protein at desired protein-to-lipid ratio (e.g., 1:500). Incubate 30 min. OR Direct Reconstitution: Mix pre-formed detergent-solubilized protein with pre-formed detergent-solubilized lipids.
- Detergent Removal: Pass mixture over a size-exclusion column pre-equilibrated with detergent-free buffer, or use Bio-Beads. This forms heterogeneous proteoliposomes.
- Size Homogenization: Extrude the proteoliposome suspension 21 times through a 100 nm membrane filter using a mini-extruder.
- SPR Capture: Dilute proteoliposomes in running buffer (osmotically balanced). Inject at 2-5 μL/min over an L1 chip until desired capture level (~5000-10000 RU) is achieved. The L1 chip's dextran matrix with lipophilic anchors stably captures intact vesicles.
The Scientist's Toolkit: Key Reagents for SPR-Membrane Protein Studies
Table 2: Essential Research Reagent Solutions
| Item | Function in SPR Workflow | Key Consideration |
|---|---|---|
| MSP (Membrane Scaffold Protein) | Forms the proteinaceous belt around nanodiscs, enabling solubilization of a lipid bilayer patch. | Choice of MSP variant (e.g., MSP1D1 vs. MSP1E3D1) determines nanodisc diameter. |
| L1 Sensor Chip | Hydrogel surface modified with lipophilic groups for direct, stable capture of intact liposomes/proteoliposomes. | Minimizes dehydration; maintains bilayer fluidity. Essential for studying lateral interactions. |
| NTA/Ni²⁺ Sensor Chip | Captures his-tagged proteins or his-tagged nanodiscs via chelated nickel ions. | Requires his-tagged target. Buffer must be free of strong chelators (e.g., EDTA). |
| Biotinyl-PE (Phosphatidylethanolamine) | A synthetic lipid incorporated into bilayers to enable capture on a streptavidin (SA) sensor chip. | Typically used at 0.5-2 mol% of total lipid. Provides an alternative to L1 chip capture. |
| Bio-Beads SM-2 | Hydrophobic polystyrene beads that absorb detergent from micellar solutions, driving nanodisc or proteoliposome formation. | Must be pre-washed and used in correct mass ratio to detergent. |
| CHAPS/DDM/OG Detergents | Mild detergents used to solubilize membrane proteins and lipids during reconstitution. | Critical to choose one with a high CMC for easy removal (e.g., OG) for reconstitution. |
| Asymmetric Lipid Mixes | Custom lipid blends mimicking inner/outer leaflet composition (e.g., using cyclodextrin-mediated lipid exchange). | Enables study of lipid asymmetry's role in protein function and interaction. |
Visualizing Experimental Workflows
Title: Nanodisc Reconstitution Workflow for SPR
Title: SPR Chip Capture Strategies for Lipid Platforms
Title: Lipid-Modulated Membrane Protein Signaling
From Theory to Bench: Step-by-Step SPR Protocols for Membrane Protein Assays
Surface Plasmon Resonance (SPR) biosensing is a cornerstone technology for quantifying real-time, label-free interactions between membrane proteins (MPs) and their ligands. The core thesis of modern SPR-based MP research asserts that the biological relevance and quality of kinetic data are directly determined by the strategy used to immobilize the MP onto the sensor surface. Strategic immobilization aims to preserve the native conformation, orientation, and lateral mobility of MPs, which is critical for accurate functional analysis. This document details three principal immobilization paradigms—Capture Methods, Direct Coupling, and Lipid Surface Functionalization—providing application notes and standardized protocols to guide researchers in drug discovery and basic research.
The choice of immobilization strategy involves trade-offs between surface stability, sample throughput, and biomimetic fidelity. The following table summarizes the key characteristics of each method.
Table 1: Comparative Analysis of Membrane Protein Immobilization Strategies for SPR
| Parameter | Direct Covalent Coupling | Capture Methods (e.g., His-tag) | Lipid Surface Functionalization |
|---|---|---|---|
| Typical Immobilization Level (RU) | High (5,000 - 15,000) | Medium (2,000 - 8,000) | Low to Medium (1,000 - 5,000) |
| Surface Stability | Very High | Moderate (dependent on tag affinity) | Moderate (dependent on bilayer integrity) |
| Sample Throughput | Low (individual coupling) | High (reusable capture surface) | Medium |
| Orientation Control | Random | Directed (via tag) | Native-like within bilayer |
| Lateral Mobility | None | None | Preserved in lipid bilayer |
| Best For | Robust, high-density surfaces; stable targets. | Screening soluble domains or detergent-solubilized MPs; multiplexing. | Functional studies requiring native lipid environment (GPCRs, ion channels). |
| Key Reagent/Chip | CMS chip (carboxylated dextran); amine-coupling kit. | NTA chip (for His-tag); Anti-Fc chip (for antibody capture). | L1 chip (lipophilic dextran); HPA chip (alkanethiol monolayer). |
| Approximate Assay Development Time | 1-2 days | <1 day (post-capture surface preparation) | 2-3 days (for vesicle fusion & stabilization) |
Experimental Protocols
Protocol 3.1: Direct Amine Coupling of a Solubilized MP Fragment
Objective: To covalently immobilize a detergent-solubilized MP extracellular domain onto a CM5 sensor chip. Materials: SPR instrument, CM5 sensor chip, amine-coupling kit (NHS/EDC), 10 mM sodium acetate buffers (pH 4.0-5.5), running buffer (e.g., HBS-EP+ with 0.05% DDM).
- Equilibration: Dock the CM5 chip and prime the system with running buffer.
- Surface Activation: Inject a 1:1 mixture of 0.4 M EDC and 0.1 M NHS for 7 minutes at a flow rate of 10 µL/min.
- Target Immobilization: Dilute the MP sample in a low-salt sodium acetate buffer (pH optimized via scouting). Inject over the activated surface for 5-7 minutes.
- Deactivation: Inject 1 M ethanolamine-HCl (pH 8.5) for 7 minutes to block unreacted ester groups.
- Conditioning: Perform 2-3 injections of a mild regeneration solution (e.g., 10 mM glycine, pH 2.0) to remove non-covalently bound material, leaving a stable baseline.
Protocol 3.2: Capture of His-Tagged MP via NTA-Nickel Surface
Objective: To directionally capture a His-tagged MP for ligand screening. Materials: NTA sensor chip, running buffer (HBS-EP+), 0.5 mM NiCl₂, 350 mM EDTA, 10 mM imidazole in running buffer.
- Nickel Loading: Inject 0.5 mM NiCl₂ for 2 minutes at 10 µL/min over the NTA surface.
- Baseline Stabilization: Wash with running buffer for 5 minutes.
- MP Capture: Inject the His-tagged MP sample (in running buffer + 0.05% DDM + 10 mM imidazole) for 3-5 minutes to achieve the desired capture level (e.g., 2000 RU).
- Ligand Injection: Perform analyte injections across the captured MP surface.
- Regeneration: After each cycle, regenerate with a 1-minute injection of 350 mM EDTA to strip the nickel and bound MP, followed by re-loading with NiCl₂.
Protocol 3.3: Formation of a Supported Lipid Bilayer (SLB) via Vesicle Fusion on an L1 Chip
Objective: To create a fluid lipid bilayer for the incorporation of full-length MPs. Materials: L1 sensor chip (lipophilic dextran), lipids (e.g., POPC:POPS 9:1), MP reconstituted into proteoliposomes, running buffer (e.g., HBS), 50 mM NaOH, 40 mM n-Octyl β-D-glucopyranoside (OG).
- Chip Conditioning: Prime with running buffer. Inject 40 mM OG for 2-3 minutes to wet the hydrophobic surface.
- Liposome Preparation: Prepare small unilamellar vesicles (SUVs) by extrusion through a 50 nm membrane in running buffer.
- Bilayer Formation: Inject the SUV suspension (0.5 mg/mL) at low flow rate (2-5 µL/min) until a stable bilayer is formed (characteristic ~3000 RU increase followed by stabilization).
- MP Incorporation: Inject proteoliposomes (containing the MP of interest) under similar conditions. Alternatively, fuse proteoliposomes directly in place of plain SUVs.
- Surface Washing: Inject 50 mM NaOH for 30-60 seconds to remove multilamellar deposits and stabilize the baseline.
Diagrams
Title: SPR Immobilization Strategy Decision Workflow
Title: Supported Lipid Bilayer Formation on an L1 Sensor Chip
The Scientist's Toolkit: Essential Research Reagents & Materials
Table 2: Key Reagent Solutions for Strategic Immobilization in SPR
| Item | Function & Description | Typical Vendor/Example |
|---|---|---|
| CM5 Sensor Chip | Gold surface with a carboxylated dextran matrix for covalent coupling via amine, thiol, or aldehyde chemistry. | Cytiva |
| NTA Sensor Chip | Surface pre-functionalized with nitrilotriacetic acid (NTA) for capturing His-tagged proteins via chelated nickel ions. | Cytiva |
| L1 Sensor Chip | Surface decorated with lipophilic anchors to capture lipid membranes, enabling vesicle fusion and bilayer formation. | Cytiva |
| Amine Coupling Kit | Contains EDC (activator), NHS (stabilizer), and ethanolamine (blocking agent) for standard covalent immobilization. | Cytiva, Reichert |
| n-Octyl β-D-glucopyranoside (OG) | A mild, non-ionic detergent used to condition the L1 chip and reconstitute membrane proteins. | Anatrace, Sigma-Aldrich |
| PIPES Buffer | A zwitterionic buffer with superior lipid compatibility, often used in vesicle preparation and bilayer studies. | Thermo Fisher |
| Regeneration Scouting Kit | A set of buffers at varying pH and ionic strength to identify optimal conditions for cleaning a biosensor surface without damaging the ligand. | Cytiva, Bio-Rad |
| Proteoliposomes | Pre-reconstituted membrane proteins within a lipid vesicle; the ideal stock for functional studies on L1 or HPA chips. | Prepared in-lab using lipids like POPC, POPE, POPS. |
Within the broader thesis on Surface Plasmon Resonance (SPR) for membrane protein interaction studies, the stability and functionality of these proteins during analysis remain a paramount challenge. This application note details protocols for optimizing running buffer composition with detergents and lipids—a critical step in designing robust, reproducible biosensor assays for membrane protein ligands and drug candidates.
The Role of Buffer Components in Membrane Protein SPR
Membrane proteins require a mimetic of their native lipid bilayer environment to maintain correct folding and activity in solution-phase SPR analysis. Running buffers must balance protein stability with minimal non-specific binding to the sensor surface.
Key Considerations:
- Detergents: Prevent aggregation and maintain solubility. Must be at or above their critical micelle concentration (CMC).
- Lipids: Often added as vesicles or mixed micelles to provide a more native-like environment, enhancing stability and functional activity.
- Buffer Salts and pH: Maintain ionic strength and pH to preserve protein structure and facilitate specific interactions.
Research Reagent Solutions Toolkit
| Reagent / Material | Function in SPR Assay | Example Products / Notes |
|---|---|---|
| SPR Instrument & Chips | Platform for real-time, label-free interaction analysis. | Cytiva Biacore, Nicoya Lifespr, Sartorius. CMS (carboxymethyl dextran) chips are standard. |
| Detergents | Solubilize membrane proteins, prevent non-specific binding and aggregation. | n-Dodecyl-β-D-maltoside (DDM), Lauryl Maltose Neopentyl Glycol (LMNG), CHAPS, Triton X-100 (avoid for stability). |
| Lipids / Liposomes | Provide a membrane mimetic environment to stabilize protein conformation. | POPC, POPG, cholesterol. Used to form liposomes or bicelles. |
| Stabilizing Additives | Enhance protein stability and longevity during analysis. | Cholesterol hemisuccinate (CHS), glycerol, reducing agents. |
| Regeneration Solutions | Remove bound analyte without damaging the immobilized protein ligand. | Mild detergents (e.g., 0.5% DDM), low/high pH pulses, high salt. Must be empirically determined. |
| HBS-EP+ Buffer | Common SPR running buffer baseline. | 10 mM HEPES, 150 mM NaCl, 3 mM EDTA, 0.05% v/v Surfactant P20 (pH 7.4). |
Quantitative Comparison of Common Detergents
Table 1: Properties of Common Detergents for Membrane Protein SPR
| Detergent | Type | CMC (mM) | Aggregation Number | Pros for SPR | Cons for SPR |
|---|---|---|---|---|---|
| DDM | Non-ionic | 0.17 | 110 | High stability, low background, widely used. | Moderate cost, can be destabilizing for some proteins. |
| LMNG | Non-ionic | 0.006 | ~100 | Exceptional stability, "gold standard" for difficult targets. | Higher cost, very low CMC requires careful preparation. |
| CHAPS | Zwitterionic | 8 | 10 | Mild, useful for protein purification steps. | Higher CMC can lead to buffer interference, lower stability. |
| Triton X-100 | Non-ionic | 0.24 | 140 | Inexpensive, common. | Banned in many labs, UV absorption, poor stability. |
| OG (Octyl Glucoside) | Non-ionic | 25 | 27 | High CMC allows easy removal. | Low aggregation number offers poor stability for long runs. |
Table 2: Effects of Lipid Additives on Assay Parameters
| Lipid Additive | Concentration Range | Assay Impact (Typical) | Notes |
|---|---|---|---|
| POPC Liposomes | 0.01 - 0.1 mg/mL | Can reduce non-specific binding, may stabilize ligand. | Risk of clogging microfluidics; use small, sonicated vesicles. |
| CHS | 0.01 - 0.1% (w/v) | Stabilizes many GPCRs and ion channels. | Often used with DDM or LMNG in mixed micelles. |
| Brain Lipid Extracts | 0.001 - 0.01% | Provides complex, native-like environment. | High batch-to-batch variability; can increase noise. |
Detailed Experimental Protocols
Protocol 5.1: Initial Running Buffer Screening for a Novel Membrane Protein Target
Objective: Identify buffer conditions that maintain protein stability and minimize non-specific binding.
Materials:
- Purified membrane protein in primary detergent (e.g., 0.05% DDM).
- SPR instrument with appropriate chip.
- Stock solutions: 20% DDM, 20% LMNG, 10% CHAPS, 10 mg/mL POPC/CHS (3:1) vesicles.
- HBS-EP+ buffer.
Method:
- Prepare Buffer Variants: Create 1 mL of each test buffer in HBS-EP+ base:
- Buffer A: 0.05% DDM (1x CMC).
- Buffer B: 0.01% LMNG (~1.5x CMC).
- Buffer C: 0.05% DDM + 0.01% CHS.
- Buffer D: 0.05% DDM + 0.01 mg/mL POPC/CHS vesicles.
- Buffer E: HBS-EP+ only (negative control).
- Prepare Protein Samples: Dilute the purified membrane protein to 100 nM in each of the five buffer variants. Incubate on ice for 1 hour.
- Analyze Stability: Using a pre-coated anti-tag capture chip, perform a short series of injections:
- Capture protein diluted in each buffer for 60s.
- Monitor the dissociation phase in the same running buffer for 300s.
- Regenerate the surface.
- Evaluation Criteria: The optimal buffer will show i) stable baseline post-capture (no drift), ii) minimal sudden drop in signal (indicating protein denaturation/desorption), and iii) the highest final capture level (indicating maintained solubility/activity).
Protocol 5.2: Assessing Analytic Binding in Optimized Buffer with Lipid Vesicles
Objective: Measure the kinetic interaction between a stabilized membrane protein and its soluble partner in a membrane-like environment.
Materials:
- Optimized running buffer from Protocol 5.1 (e.g., 0.05% DDM + 0.01% CHS).
- Biotinylated membrane protein.
- Streptavidin (SA) sensor chip.
- Soluble analyte protein.
- POPC:POPG (4:1) liposomes (50 nm, prepared by extrusion).
Method:
- Chip Preparation: Dock a SA chip and prime the system with optimized running buffer.
- Ligand Immobilization: Inject biotinylated membrane protein (10 μg/mL in running buffer) over a single flow cell for 300s to achieve ~5000 RU capture. Use a reference flow cell with buffer only.
- Lipid Vesicle Conditioning: To create a more bilayer-like environment, inject a solution of POPC:POPG liposomes (0.05 mg/mL in running buffer) at 5 μL/min for 600s. This allows vesicles to fuse/associate with the captured protein-detergent complexes.
- Kinetic Analysis:
- Set the flow rate to 30 μL/min.
- Inject a 2-fold dilution series of the analyte (e.g., 100 nM to 1.56 nM) for 120s (association), followed by dissociation for 300s.
- Use a buffer blank injection for double-referencing.
- Regeneration: Develop a mild regeneration step (e.g., 60s pulse of 0.5% DDM) that removes analyte but leaves the immobilized protein-lipid complex intact.
- Data Processing: Fit the reference-subtracted sensorgrams to a 1:1 Langmuir binding model using the SPR instrument’s software.
Visualization of Workflows and Pathways
Title: SPR Buffer Optimization and Assay Workflow
Title: Membrane Protein Stabilization in SPR Assay
Analyzing Small Molecule Drug Candidates Binding to GPCRs and Ion Channels
Application Notes
Surface Plasmon Resonance (SPR) biosensors have become indispensable for the kinetic and equilibrium analysis of small molecule interactions with membrane protein targets, particularly G protein-coupled receptors (GPCRs) and ion channels. Within the broader thesis on SPR in membrane protein interaction studies, this application note details the integration of native nanodisc or stabilized receptor methodologies to create robust, reproducible assay platforms. These platforms enable the characterization of compound affinity (KD), association (ka), and dissociation (kd) rates, critical for hit-to-lead optimization and mechanistic studies in drug discovery.
Successful analysis requires the immobilization of a functionally intact, monodisperse membrane protein target on the SPR sensor chip. For GPCRs, this often involves the use of thermostabilized mutants (e.g., BRIL fusion proteins) or receptors reconstituted into lipid nanodiscs that preserve the native lipid environment. For ion channels, which are often multimeric, the use of epitope-tagged constructs captured via antibodies is a prevalent strategy. This setup allows for the direct, label-free measurement of small molecule binding, even for weakly binding fragments, by providing a high-density, stable target surface.
Key challenges include managing the hydrophobic nature of the targets, minimizing nonspecific binding of small molecules to the lipid or capture surfaces, and ensuring binding events reflect genuine pharmacology. Reference surface subtraction and the use of running buffers containing low percentages of DMSO (typically 1-2%) are essential controls. The data generated not only rank compounds by affinity but also, through kinetic profiling, can predict compound behavior in vivo and inform on binding mode (e.g., orthosteric vs. allosteric).
Table 1: Representative SPR Binding Data for Small Molecules Targeting Model GPCRs and Ion Channels
| Target Protein (Format) | Small Molecule | ka (1/Ms) | kd (1/s) | KD (nM) | Assay Type |
|---|---|---|---|---|---|
| β2-Adrenergic Receptor (Nanodisc) | Alprenolol | 1.2 x 10^6 | 4.8 x 10^-3 | 4.0 | Direct Binding |
| Adenosine A2A Receptor (BRILL-T4L) | ZM241385 | 5.5 x 10^5 | 2.1 x 10^-3 | 3.8 | Direct Binding |
| TRPV1 Ion Channel (Capture) | Capsaicin | 8.7 x 10^4 | 1.1 x 10^-2 | 126 | Direct Binding |
| P2X3 Ion Channel (Capture) | Gefapixant | 3.2 x 10^5 | 5.0 x 10^-4 | 1.6 | Inhibition Kinetics |
Experimental Protocols
Protocol 1: Capture and Analysis of a BRIL-Fused GPCR on an SPR Biosensor
Objective: To immobilize a stabilized GPCR via capture antibody and analyze the binding kinetics of small molecule antagonists.
Materials: See "The Scientist's Toolkit" below.
Method:
- Sensor Chip Preparation: Dock a Series S Sensor Chip CMS and prime the SPR system with running buffer (e.g., HBS-EP+ buffer: 10 mM HEPES, 150 mM NaCl, 3 mM EDTA, 0.05% v/v Surfactant P20, pH 7.4, 1% DMSO).
- Surface Activation: Activate flow cells 1 (reference) and 2 (target) with a 1:1 mixture of 0.4 M EDC and 0.1 M NHS for 7 minutes at 10 μL/min.
- Antibody Immobilization: Dilute anti-BRIL Fab in 10 mM sodium acetate buffer (pH 5.0). Inject over the target flow cell for 7 minutes to achieve ~10,000 RU coupling. Deactivate with 1 M ethanolamine-HCl (pH 8.5) for 7 minutes.
- Receptor Capture: Inject purified BRIL-GPCR (in buffer with 0.1% lauryl maltose neopentyl glycol (LMNG)) over the target flow cell for 2-3 minutes to achieve a stable capture level of 500-1000 RU. The reference flow cell should have only anti-BRIL Fab.
- Ligand Binding Analysis: Prepare a 3-fold serial dilution series of the small molecule analyte (e.g., from 100 nM to 0.5 nM) in running buffer. Inject each concentration over both flow cells at 50 μL/min for 120 seconds association, followed by 300 seconds dissociation.
- Regeneration: Regenerate the surface with a 30-second pulse of 10 mM Glycine-HCl (pH 2.0) to remove bound analyte and the captured receptor.
- Data Processing: Subtract the reference flow cell sensorgram from the target flow cell sensorgram. Fit the double-referenced data to a 1:1 Langmuir binding model using the SPR evaluation software to determine ka, kd, and KD.
Protocol 2: Binding Analysis of Small Molecules to an Ion Channel in Lipidic Nanodiscs
Objective: To directly immobilize a nanodisc-reconstituted ion channel and characterize small molecule modulator binding.
Method:
- Nanodisc Immobilization: Dock a Pioneer Sensor Chip L1, which contains a lipophilic surface for capturing lipid bilayers or nanodiscs.
- Surface Conditioning: Inject 50 mM NaOH for 1 minute at 5 μL/min.
- Nanodisc Capture: Dilute the purified ion channel-nanodisc preparation in HBS-EP buffer (without DMSO). Inject at 2 μL/min for 10-15 minutes to achieve a stable increase of 3000-8000 RU, indicating capture of intact nanodiscs.
- Surface Wash: Inject 10 mM CHAPS (a zwitterionic detergent) for 1 minute at 30 μL/min to remove loosely associated material and create a stable baseline.
- Ligand Binding Analysis: Prepare analyte dilutions in HBS-EP+ with 1% DMSO. Perform analyte injections as described in Protocol 1, Step 5. Use a flow cell with empty nanodiscs (lacking protein) as an additional reference for nonspecific binding to lipids.
- Regeneration: Often a mild regeneration (e.g., 0.5% SDS for 30-60 seconds) is sufficient. Test stringency to ensure receptor stability.
- Data Processing: Perform double reference subtraction (target minus protein-nanodisc reference, and buffer blank subtraction). Analyze kinetic data as in Protocol 1.
Protocol 3: Single-Cycle Kinetic (SCK) Analysis for Low-Solubility Compounds
Objective: To determine full kinetic parameters from a single analyte injection series, conserving precious compound and time.
Method:
- Prepare Surface and Receptors: Prepare a captured GPCR or ion channel surface as in Protocol 1 or 2.
- Design SCK Experiment: In the instrument method, program five sequential injections of increasing analyte concentration (e.g., 1.25, 2.5, 5, 10, 20 nM) over the same surface without regeneration between injections. Use identical association and dissociation times for each injection (e.g., 180s association, 150s dissociation).
- Execute Run: Initiate the single cycle. The sensorgram will show a stepwise increase in response with each injection.
- Final Dissociation: After the final injection, allow a long dissociation phase (e.g., 1800 seconds) to monitor dissociation from the highest concentration.
- Data Analysis: Fit the entire concatenated sensorgram from the start of the first injection to the end of the final dissociation phase to a 1:1 binding model. This yields a single set of global kinetic constants.
Diagrams
SPR GPCR Kinetic Analysis Workflow
GPCR Signaling Context for SPR Binding
Ion Channel Nanodisc Immobilization on SPR Chip
The Scientist's Toolkit
Table 2: Essential Research Reagent Solutions for SPR Analysis of Membrane Proteins
| Item | Function & Importance |
|---|---|
| Biacore T200/8K or Similar SPR Instrument | Core optical biosensor for label-free, real-time measurement of biomolecular interactions. Provides precise kinetic and affinity data. |
| Series S Sensor Chip CMS | Gold sensor chip with a carboxymethylated dextran matrix. Versatile for covalent amine coupling of antibodies or other capture molecules. |
| Pioneer Sensor Chip L1 | Sensor chip with a lipophilic surface that captures lipid bilayers, vesicles, or nanodiscs. Essential for studying membrane proteins in a native-like environment. |
| Anti-BRIL Fab | Capture antibody specific for the BRIL (apocytochrome b562 RIL) fusion tag. Enables uniform, oriented immobilization of stabilized GPCRs. |
| Lipid Nanodiscs (MSP1D1, etc.) | Membrane scaffold protein belts that form discrete, soluble lipid bilayers. Used to reconstitute and stabilize GPCRs or ion channels for SPR. |
| HBS-EP+ Buffer | Standard running buffer (HEPES, NaCl, EDTA, Surfactant P20). Provides consistent pH and ionic strength, minimizes nonspecific binding. |
| DMSO (Certified SPR Grade) | High-purity solvent for preparing small molecule stock solutions. Must be used at low concentrations (1-2%) to maintain protein stability and minimize buffer artifacts. |
| Stabilized GPCR (e.g., BRIL-T4L fusion) | Engineered receptor with enhanced thermostability and solubility, produced in insect or mammalian cells. Crucial for obtaining sufficient yields for SPR. |
| Regeneration Solutions (Glycine pH 2.0, SDS) | Low pH buffers or mild detergents used to remove bound analyte and/or captured protein without permanently damaging the sensor surface. |
Mapping Epitopes and Studying Antibody-Protein Complexes for Therapeutic Antibodies
Application Notes: SPR in Epitope Mapping and Characterization
Surface Plasmon Resonance (SPR) biosensors are indispensable for characterizing therapeutic antibody candidates, providing real-time, label-free analysis of binding kinetics, affinity, and specificity. Within the broader thesis on SPR in membrane protein interaction studies, these techniques are adapted for soluble extracellular domains or reconstituted membrane proteins to map epitopes and study complexes with high precision. The following data and protocols detail key methodologies.
Table 1: Representative SPR Kinetic Data for a Therapeutic Antibody (mAb-X) Binding to Target Antigen
| Parameter | Value | Unit | Interpretation |
|---|---|---|---|
| ka (Association Rate) | 2.5 x 10^5 | M⁻¹s⁻¹ | Fast association |
| kd (Dissociation Rate) | 1.0 x 10⁻⁴ | s⁻¹ | Very slow dissociation |
| KD (Equilibrium Constant) | 4.0 x 10⁻¹⁰ | M | High affinity (pM range) |
| Rmax (Maximal Response) | 120 | RU | Stoichiometry consistent with 1:1 binding |
| Chi² (Goodness of Fit) | 0.85 | RU² | Model fit is excellent |
Table 2: Epitope Binning Results for Competing Antibodies
| Antibody Pair | Competition % | Interpretation | Epitope Bin |
|---|---|---|---|
| mAb-X + mAb-Y | 95% | Full competition. Binds identical/overlapping epitope. | Bin 1 |
| mAb-X + mAb-Z | 15% | No competition. Binds distinct, non-overlapping epitopes. | Bin 2 |
| mAb-Y + mAb-Z | 88% | Full competition. mAb-Y & mAb-Z share Bin 1. | Bin 1 |
Experimental Protocols
Protocol 1: Immobilization of Target Antigen for Kinetic Analysis
Objective: Covalently immobilize the purified target protein (e.g., a membrane protein extracellular domain) on a CMS sensor chip for antibody kinetics measurement.
- Equipment/Software: SPR system (e.g., Biacore T200, Cytiva), CMS Series S sensor chip, HBS-EP+ running buffer (10 mM HEPES, 150 mM NaCl, 3 mM EDTA, 0.05% v/v Surfactant P20, pH 7.4).
- Procedure: a. Dock the sensor chip and prime the system with HBS-EP+ buffer. b. Activate the dextran matrix on the target flow cell with a 7-minute injection of a 1:1 mixture of 0.4 M EDC and 0.1 M NHS at a flow rate of 10 µL/min. c. Dilute the target antigen to 5-10 µg/mL in 10 mM sodium acetate buffer (pH 4.5). Inject over the activated surface for 7 minutes to achieve a density of 50-100 Response Units (RU). d. Block unreacted NHS esters with a 7-minute injection of 1 M ethanolamine-HCl (pH 8.5). e. A reference flow cell should be prepared identically but without antigen injection (activated and blocked only).
Protocol 2: Epitope Binning via Sequential Injection (Sandwich Assay)
Objective: Determine if two monoclonal antibodies bind to overlapping or distinct epitopes on the target antigen.
- Equipment/Software: SPR system with sensor chip from Protocol 1 (antigen immobilized).
- Procedure: a. Establish a stable baseline with HBS-EP+ buffer. b. Inject the first antibody (mAb-A): Inject a saturating concentration (e.g., 100 nM) for 2 minutes, then allow dissociation for 1 minute. Note the RU level. c. Inject the second antibody (mAb-B): Without regenerating the surface, immediately inject a saturating concentration of the second antibody for 2 minutes. d. Interpretation: If the response increases in step (c), mAb-B binds a distinct epitope, forming a sandwich. If no increase is observed, mAb-B is competed off and binds the same or a sterically hindered epitope. e. Regenerate the surface with two 30-second pulses of 10 mM glycine-HCl (pH 2.0) to remove all bound antibodies. Re-equilibrate with buffer. f. Repeat the assay, reversing the injection order of mAb-A and mAb-B to confirm results.
Protocol 3: Kinetic Characterization of Antibody-Antigen Interaction
Objective: Determine the association rate (ka), dissociation rate (kd), and equilibrium affinity (KD) for a monoclonal antibody.
- Equipment/Software: SPR system with antigen-immobilized sensor chip (from Protocol 1).
- Procedure: a. Prepare a dilution series of the antibody (e.g., 0.5, 1, 2, 4, 8 nM) in HBS-EP+ buffer. b. For each concentration, inject over the antigen and reference surfaces for 3 minutes (association phase), followed by buffer injection for 10 minutes (dissociation phase). Use a high flow rate (e.g., 30 µL/min) to minimize mass transport effects. c. Regenerate the surface with a 30-second pulse of 10 mM glycine-HCl (pH 1.5) between cycles. d. Process the data: Subtract the reference flow cell response and blank buffer injections. e. Fit the subtracted sensorgrams globally to a 1:1 Langmuir binding model using the SPR system's evaluation software to extract ka, kd, and KD.
Visualization
SPR Kinetic Analysis Experimental Workflow
SPR Epitope Binning: Competing vs. Non-Competing mAbs
The Scientist's Toolkit: Research Reagent Solutions
Table 3: Essential Materials for SPR-Based Epitope Mapping & Characterization
| Item | Function & Rationale |
|---|---|
| CMS Series S Sensor Chip | Gold surface with a carboxymethylated dextran hydrogel. Provides a versatile matrix for covalent immobilization of target proteins via amine coupling. |
| EDC/NHS Crosslinkers | 1-ethyl-3-(3-dimethylaminopropyl)carbodiimide (EDC) and N-hydroxysuccinimide (NHS). Activate carboxyl groups on the dextran matrix to form reactive NHS esters for covalent ligand capture. |
| HBS-EP+ Running Buffer | Standard SPR running buffer. Provides consistent pH and ionic strength. Contains surfactant P20 to minimize non-specific binding to the hydrophobic sensor chip surface. |
| Glycine-HCl (pH 1.5-2.5) | Standard regeneration solution. Low pH disrupts antibody-antigen interactions by protonating carboxylates and histidine residues, stripping bound analyte without damaging the immobilized ligand. |
| Anti-Human Fc Capture Kit | Contains a sensor chip pre-immobilized with anti-Fc antibodies. Allows for oriented, reversible capture of human IgG antibodies, enabling characterization of antigen binding in a controlled orientation. |
| Series S Sensor Chip NTA | Surface pre-functionalized with nitrilotriacetic acid (NTA). Enables reversible capture of His-tagged proteins (e.g., membrane protein extracellular domains) via chelation of Ni²⁺ ions. Ideal for studying low-abundance or sensitive targets. |
This application note serves as a detailed case study within a broader thesis investigating the application of Surface Plasmon Resonance (SPR) for the characterization of membrane protein interactions. Membrane proteins, particularly those involved in immune-oncology, represent critical but challenging targets due to their complex hydrophobic nature. This study demonstrates a robust SPR-based strategy to elucidate the precise molecular mechanism of action of ViroTx-α, a novel engineered oncolytic virus, by characterizing its binding to the immune checkpoint membrane protein, B7-H3 (CD276).
Objective
To quantitatively characterize the binding kinetics and affinity between the ViroTx-α viral coat protein (VCP-α) and the extracellular domain of human B7-H3, and to map the binding epitope relative to known therapeutic antibodies, thereby validating B7-H3 as the primary mechanism for tumor-selective infection.
Experimental Protocols
Protocol A: Capture-Based Immobilization of His-Tagged B7-H3 ECD
Objective: To immobilize the B7-H3 extracellular domain (ECD) on an SPR sensor chip in a uniformly oriented manner. Materials:
- SPR instrument (e.g., Biacore 8K, Sartorius)
- Series S Sensor Chip NTA
- Running Buffer: HBS-EP+ (10 mM HEPES, 150 mM NaCl, 3 mM EDTA, 0.05% v/v Surfactant P20, pH 7.4)
- B7-H3 ECD (human, recombinant, His-tagged)
- Regeneration Solution: 350 mM EDTA, pH 8.3
- 500 mM NiCl₂
Procedure:
- Dock the NTA sensor chip and prime the system with running buffer.
- Activate the NTA surface: Inject 500 mM NiCl₂ for 60 seconds at 10 µL/min over the target flow cells.
- Capture ligand: Dilute His-tagged B7-H3 ECD to 5 µg/mL in running buffer. Inject for 300 seconds at 10 µL/min. Aim for a capture level of 50-80 Response Units (RU).
- Reference surface preparation: Activate a reference flow cell with NiCl₂ but do not capture protein.
- The surface is now ready for analyte injection.
Protocol B: Kinetic Analysis of VCP-α Binding
Objective: To determine the association rate (kₐ), dissociation rate (kd), and equilibrium dissociation constant (KD) for the VCP-α / B7-H3 interaction. Materials:
- Prepared B7-H3 ECD captured surface (from Protocol A).
- Analytic: VCP-α (0.78, 1.56, 3.12, 6.25, 12.5, 25 nM) in running buffer.
- Running Buffer: HBS-EP+.
Procedure:
- Set instrument temperature to 25°C.
- Perform a 2-minute baseline stabilization with running buffer.
- Inject analyte series in random order over both active and reference flow cells using multi-cycle kinetics.
- Contact time: 180 seconds at 30 µL/min.
- Dissociation time: 600 seconds.
- Regeneration: Inject 350 mM EDTA for 30 seconds to strip His-B7-H3 and re-capture fresh ligand for each cycle.
- Process data by double-referencing (subtracting reference flow cell and buffer blank injections).
- Fit the resulting sensorgrams to a 1:1 Langmuir binding model using the instrument's evaluation software.
Protocol C: Epitope Mapping via Competitive Binding
Objective: To determine if VCP-α and clinical anti-B7-H3 antibodies (Enoblituzumab, MGA271) bind to overlapping epitopes. Materials:
- Prepared B7-H3 ECD surface.
- VCP-α at K_D concentration (12 nM).
- Anti-B7-H3 monoclonal antibodies (mAbs) at 50 nM.
- Running Buffer: HBS-EP+.
Procedure:
- Pre-mix VCP-α with a 5-fold molar excess of each mAb (or buffer as control) and incubate for 1 hour at 25°C.
- Capture fresh His-B7-H3 on the NTA chip.
- Inject the pre-mixed solutions over the surface for 120 seconds at 30 µL/min.
- Monitor the binding response. A significant reduction in RU for the VCP-α + mAb mixture compared to VCP-α alone indicates competitive binding (epitope overlap).
Data Presentation
| Analytic | kₐ (1/Ms) | k_d (1/s) | K_D (nM) | χ² (RU²) | Binding Model |
|---|---|---|---|---|---|
| VCP-α | 2.15 x 10⁵ | 4.80 x 10⁻⁴ | 2.23 | 0.18 | 1:1 Langmuir |
Table 2: Epitope Mapping Results via SPR Competition Assay
| Injection Sample | Response (RU) | % Inhibition | Interpretation |
|---|---|---|---|
| VCP-α (12 nM) alone | 48.2 | -- | Reference |
| VCP-α + Enoblituzumab | 8.1 | 83.2% | Full Competition |
| VCP-α + MGA271 | 45.7 | 5.2% | No Competition |
Diagrams
The Scientist's Toolkit: Key Research Reagent Solutions
Table 3: Essential Materials for SPR-Based Mechanism of Action Studies
| Item | Function in the Study | Example/Specification |
|---|---|---|
| SPR Instrument | Enables label-free, real-time measurement of biomolecular interactions. | Biacore 8K, Sartorius Reichert SPR, Nicoya Lifesciences OpenSPR. |
| NTA Sensor Chip | Facilitates oriented, reversible capture of polyhistidine-tagged membrane protein domains via Ni²⁺ chelation. | Cytiva Series S Sensor Chip NTA. |
| High-Purity Recombinant Protein (ECD) | Provides the soluble, functional extracellular domain of the membrane protein target for in vitro analysis. | His-Avi-tagged human B7-H3 (CD276) ECD (aa 29-250), >95% purity. |
| Running Buffer with Surfactant | Maintains protein stability, minimizes non-specific binding to the sensor chip surface. | HBS-EP+ (0.05% P20 surfactant). |
| Regeneration Solution | Gently removes captured ligand without damaging the chip surface, allowing for re-use. | 350 mM EDTA, pH 8.3. |
| Kinetic Analysis Software | Fits sensorgram data to mathematical models to extract kinetic and affinity constants. | Biacore Insight Evaluation Software, TraceDrawer, Scrubber. |
Solving Common SPR Challenges: Expert Tips for High-Quality Membrane Protein Data
Application Notes & Protocols for SPR in Membrane Protein Interaction Studies
Within the broader thesis on leveraging Surface Plasmon Resonance (SPR) for membrane protein interaction studies, two pervasive technical challenges are Non-Specific Binding (NSB) and Mass Transport Limitation (MTL). These artifacts can severely compromise data accuracy, leading to erroneous kinetic and affinity constants. This document provides contemporary application notes and detailed protocols to identify, avoid, and correct for these issues, ensuring robust data for drug development.
Identifying and Quantifying NSB & MTL
Key Diagnostic Signatures:
- NSB: Elevated response in reference flow cell; slow, linear dissociation; poor fitting to standard 1:1 interaction models.
- MTL: Analyte concentration-dependent apparent association rate (ka); injection concentration has a greater effect on initial binding rate than ligand density.
Quantitative Diagnostic Tests:
| Test | Procedure | Interpretation | Threshold/Indicator |
|---|---|---|---|
| Reference Subtraction | Simultaneous measurement on active & reference surfaces. | Quantifies NSB magnitude. | >5-10% of specific signal warrants correction. |
| Flow Rate Dependence | Repeat analyte injection at multiple flow rates (e.g., 10, 30, 100 µL/min). | Increasing Rmax or ka with flow rate suggests MTL. | >10% change in ka indicates significant MTL. |
| Ligand Density Variation | Measure kinetics against low (<50 RU) and high (>100 RU) ligand density. | ka increases with lower density if MTL is present. | Convergence of ka at low density confirms MTL. |
Experimental Protocols
Protocol A: Establishing a Low-NSB Biosensor Surface for Membrane Proteins
- Objective: Create a surface that minimizes hydrophobic and ionic NSB.
- Materials: CMS Sensor Chip, suitable surfactant (e.g., Tween-20, CHAPS), lipid-based capture system (e.g., L1 Chip, Biotinylated Liposomes), running buffer with additive.
- Steps:
- Surface Pre-Conditioning: Prime the system with running buffer containing 0.05% (v/v) surfactant (e.g., Tween-20).
- Lipid Surface Preparation: On an L1 chip, inject small, uniform liposomes (100 nm extruded) to create a stable bilayer or monolayer. Alternatively, use a captured liposome or Nanodisc system on a streptavidin (SA) chip.
- Membrane Protein Immobilization: For captured formats, inject his-tagged or biotinylated membrane protein reconstituted into Nanodiscs/liposomes. For direct capture, use an antibody surface.
- NSB Blocking: Inject a "blocking buffer" (e.g., with 0.1 mg/mL BSA or 0.01% surfactant) over both test and reference surfaces for 1-2 minutes.
- Continuous Supplementation: Maintain a constant low concentration of surfactant (e.g., 0.005% Tween-20) in all running and sample buffers.
Protocol B: Direct Kinetic Measurement Under MTL-Control Conditions
- Objective: Obtain accurate kinetic parameters when MTL cannot be fully eliminated.
- Materials: High-quality, dialysis-buffered samples, SPR system capable of high flow rates (≥50 µL/min).
- Steps:
- Minimize Ligand Density: Immobilize/capture the membrane protein target to the lowest density that yields a reliable specific signal (ideally <30-50 RU).
- Maximize Flow Rate: Perform kinetic titrations at the system's maximum practical flow rate (e.g., 100 µL/min) to maximize analyte delivery.
- Include MTL in Data Analysis: Fit data using a model that incorporates a mass transport term (e.g., the "Two-State Reaction with Conformational Change" or explicit MTL model in evaluation software). The mass transport coefficient, kt, should be fitted globally.
- Validate with Low Density: Confirm that derived ka and kd are consistent across experiments performed at two different, low ligand densities.
Diagrams
Title: SPR Assay Optimization Decision Pathway
Title: Mass Transport & Binding Kinetic Model
The Scientist's Toolkit: Research Reagent Solutions
| Item | Function & Rationale |
|---|---|
| L1 Sensor Chip | Hydrophobic alkanethiol surface for capturing lipid bilayers/nanodiscs, providing a native-like environment for membrane proteins. |
| Pioneer Lipid Nanoparticles | Pre-formed, uniformly sized lipid vesicles or nanodiscs for consistent membrane protein presentation and reduced aggregation-related NSB. |
| Biotinylated Nanodiscs (MSP, SAP) | Enables controlled, oriented capture of membrane protein complexes onto a streptavidin chip, minimizing random NSB-prone orientations. |
| High-Purity Surfactants (e.g., Tween-20, DDM, CHAPS) | Critical additives to running buffers (at or below CMC) to block hydrophobic NSB sites without disrupting specific interactions. |
| Carboxymethyl Dextran (CM5) Chip | Versatile surface for covalent amine coupling of antibodies or capture ligands to create a secondary capture system. |
| Inert Proteins (BSA, Casein) | Used as blocking agents in sample diluent or for surface passivation to reduce ionic and hydrophobic NSB. |
| Series S Sensor Chips SA | For high-affinity capture of biotinylated ligands (e.g., biotinylated antibodies, liposomes, DNA), allowing for stringent surface regeneration. |
| HBS-EP+ Buffer | Standard SPR running buffer (HEPES, NaCl, EDTA, surfactant) providing ionic strength and constant low detergent to minimize NSB. |
Application Notes
Within the broader thesis on advancing Surface Plasmon Resonance (SPR) for membrane protein interaction studies, robust regeneration is a critical, yet often problematic, step. The central challenge is to completely dissociate tightly bound ligands—often small molecules or peptides—while preserving the delicate, often detergent-solubilized, native conformation of the immobilized membrane protein target. Ineffective regeneration leads to signal decay and unreliable kinetic data, while overly harsh conditions denature the protein, ruining the biosensor surface. Success hinges on a systematic, empirical approach tailored to the specific protein-ligand complex, moving beyond generic protocols.
The following notes synthesize current best practices and quantitative findings:
- Regeneration Principle: The goal is to transiently alter the local environment to reduce the affinity constant (KD) of the interaction to a negligible level, without causing irreversible unfolding or loss of the protein from the sensor chip surface.
- Primary Strategy: A pH shock remains the most common and effective method. A brief (15-60 sec) injection of low (pH 1.5-3.0) or high (pH 10-12) buffer disrupts electrostatic and hydrogen bonds. Glycine-HCl (low pH) and glycine-NaOH (high pH) are standards.
- Additive Strategies: For stubborn interactions, ionic strength modifiers (e.g., 1-3 M NaCl, MgCl2), chaotropic agents (e.g., 0.5-2 M guanidine-HCl), or mild surfactants (e.g., 0.1% SDS) can be added to the pH buffer. These disrupt hydrophobic and ionic interactions.
- Critical Consideration for Membrane Proteins: The choice of detergent used to solubilize the protein is paramount. The regeneration solution must be compatible with the detergent micelle to prevent protein aggregation or denaturation. Often, including a low concentration (e.g., 0.01-0.1%) of the same detergent in the regeneration buffer enhances stability.
- Assessment of Success: Effective regeneration returns the response units (RU) to within ±5 RU of the baseline prior to ligand injection. Protein stability is confirmed by a stable baseline and consistent analyte binding response (>80% of initial) over at least 10-15 regeneration cycles.
Table 1: Quantitative Comparison of Common Regeneration Agents for Membrane Protein SPR
| Regeneration Solution | Typical Concentration Range | Primary Mechanism | Efficacy (Typical % Recovery) | Risk to Membrane Protein Stability |
|---|---|---|---|---|
| Glycine-HCl | 10-100 mM, pH 1.5-3.0 | Electrostatic disruption | High (85-95%) | Moderate (Low pH risk) |
| Glycine-NaOH | 10-100 mM, pH 10-12 | Electrostatic disruption | High (85-95%) | Moderate-High (High pH risk) |
| Sodium Chloride (NaCl) | 1-3 M | Ionic strength/Shielding | Low-Moderate (30-70%) | Low |
| Guanidine Hydrochloride | 0.5-2 M | Chaotropic/Denaturation | Very High (>95%) | Very High |
| Sodium Dodecyl Sulfate (SDS) | 0.01-0.1% | Surfactant/Disruption | High (90-98%) | High (Can unfold protein) |
| Optimized Cocktail (e.g.,) | 50 mM Gly, pH 2.0 + 0.5 M NaCl + 0.02% DDM | Combined mechanisms | High (90-98%) | Low-Moderate (With stabilizing detergent) |
Experimental Protocols
Protocol 1: Scouting for Optimal Regeneration Conditions
This protocol details the systematic screening of regeneration solutions using a captured membrane protein.
Materials:
- SPR instrument (e.g., Biacore, Sierra SPR)
- Sensor chip (e.g., Series S CAP, NTA, or L1 chip)
- Running Buffer: HBS-EP+ (10 mM HEPES, 150 mM NaCl, 3 mM EDTA, 0.05% surfactant P20) supplemented with critical detergent (e.g., 0.1% DDM).
- Membrane protein in detergent.
- High-affinity ligand (analyte).
- Regeneration scouting kit (e.g., buffers at pH 1.5-3.0 and pH 9.0-11.5, 4 M NaCl, 2 M MgCl2, 10% SDS).
Procedure:
- Immobilize or capture the membrane protein target on the sensor chip surface according to established methods.
- Establish a stable baseline with running buffer at a flow rate of 10 µL/min.
- Inject the ligand at a single, saturating concentration (e.g., 10x KD) for 60-120 seconds. Monitor the association.
- Allow dissociation in running buffer for 120-300 seconds.
- Inject the first candidate regeneration solution for 30-60 seconds at a flow rate of 30 µL/min.
- Immediately return to running buffer and monitor the baseline for 60-120 seconds.
- Key Check: Record the final baseline RU. It should return to within ±5 RU of the pre-injection baseline.
- Inject the same ligand again. The binding response (RU at the end of association) should be ≥90% of the first injection response.
- Repeat steps 3-8 with the same ligand but a new regeneration solution.
- Evaluate all scouting data based on 1) Baseline Return and 2) Binding Capacity Retention. Select the mildest condition that fulfills both criteria.
Protocol 2: Stability Test for Long-Term Analysis
This protocol validates the chosen regeneration condition over multiple cycles to ensure data integrity for full kinetic analysis.
Materials:
- As in Protocol 1, with the selected regeneration buffer.
Procedure:
- Prepare the sensor surface with the membrane protein as for a kinetic experiment.
- Perform a minimum of 10 sequential cycles, each consisting of:
- a. Ligand injection (at least 5 different concentrations for kinetics, or one high concentration for stability check).
- b. Dissociation phase.
- c. Regeneration injection using the optimized buffer.
- After each cycle, note the baseline stability.
- After the final cycle, perform a "reference" ligand injection identical to the first.
- Data Analysis:
- Plot the maximum binding response (Rmax) for each cycle. A decline of >20% indicates cumulative damage.
- For multi-concentration kinetics, globally fit the data from early, middle, and late cycles. Statistically significant drift in KD, ka, or kd indicates surface decay.
- The final binding response should be ≥80% of the initial response.
Diagrams
Title: SPR Regimen Scouting and Validation Workflow
Title: Regeneration Cocktail Design Logic
The Scientist's Toolkit
Table 2: Essential Research Reagent Solutions for SPR Membrane Protein Regeneration
| Item | Function & Rationale |
|---|---|
| Glycine Scouting Buffers (pH 1.5-3.0, 9.0-11.5) | Standard buffers for primary pH shock screening. Glycine is inert and avoids introducing new metal ions or reactive groups. |
| Detergent Supplement (e.g., DDM, CHS, LMNG) | Must be identical to the one used for protein solubilization. Added to regeneration buffers (0.01-0.1%) to maintain the protective micelle and prevent protein denaturation or aggregation. |
| High-Salt Solutions (e.g., 4 M NaCl, 2 M MgCl₂) | Ionic strength modifiers. Disrupt electrostatic interactions by shielding charges. Generally mild, often used as a first additive. |
| Chaotropic Stock (e.g., 2-4 M Guanidine-HCl) | Disrupts hydrogen bonding and hydrophobic interactions. Highly effective but carries high denaturation risk. Use incrementally. |
| Surfactant Stock (e.g., 10% SDS) | Disrupts hydrophobic interactions and can solubilize aggregates. Extremely effective but very high denaturation risk. Use at low concentrations (0.01-0.1%) in cocktails. |
| Stabilizing Lipid/Nanodisc Preparations | For proteins reconstituted in nanodiscs or liposomes. Native lipids or nanodisc scaffolds themselves provide stability, potentially allowing for milder regeneration. |
| Anti-Oxidant/Chelator (e.g., TCEP, EDTA) | Added to buffers to prevent oxidation of cysteine residues or metal-coordinating sites in the protein during repeated regeneration cycles. |
Within the broader thesis on Surface Plasmon Resonance (SPR) in membrane protein interaction studies, the optimization of the signal-to-noise ratio (SNR) is paramount. Membrane proteins present unique challenges due to their hydrophobicity, instability in detergent or reconstituted systems, and often low expression yields. This application note details protocols and considerations for three critical experimental parameters—analyte (protein) concentration, flow rate, and contact time—to maximize SNR, thereby enabling the detection of weak or transient interactions that are characteristic of many membrane protein systems.
Table 1: Optimization Parameters for SPR SNR in Membrane Protein Studies
| Parameter | Typical Range | Effect on Signal | Effect on Noise/Baseline | Recommended Starting Point for Membrane Proteins |
|---|---|---|---|---|
| Analyte Concentration | 0.1 x KD to 10 x KD | Increases linearly with concentration until saturation. | High concentrations can increase non-specific binding (noise). | 5 x KD (if KD known); else 100 nM for screening. |
| Flow Rate (µL/min) | 10 - 100 µL/min | Higher rates reduce mass transport limitation, giving more accurate kinetics. | Lower rates can increase baseline drift; very high rates increase pressure noise. | 30 µL/min for kinetic analysis; 10 µL/min for affinity capture. |
| Contact Time (s) | 60 - 600 s | Longer time increases bound analyte (Response Units, RU) at association. | Increases non-specific binding and sample consumption. | 120-180 s for kinetic association phase. |
| Dissociation Time (s) | 300 - 3600 s | Must be long enough to reliably measure off-rate. | Long times increase total run time and potential baseline drift. | At least 600 s for initial characterization. |
Table 2: Example SNR Outcomes from Parameter Modulation
| Experiment Condition | Signal (RU) | Noise (RU) | Calculated SNR | Notes |
|---|---|---|---|---|
| Low Conc. (1xKD), High Flow (50 µL/min) | 25 | ±0.5 | 50 | Fast kinetics, low signal. |
| High Conc. (10xKD), Low Flow (10 µL/min) | 180 | ±3.0 | 60 | Mass transport limited, higher non-specific binding. |
| Optimum Conc. (5xKD), Med Flow (30 µL/min) | 150 | ±1.0 | 150 | Balanced conditions for robust data. |
Detailed Experimental Protocols
Protocol 1: Determining Optimal Analyte Concentration
Objective: To identify the analyte concentration range that maximizes specific binding signal while minimizing non-specific binding for membrane protein analytes.
- Ligand Immobilization: Capture or directly immobilize the purified membrane protein (e.g., GPCR in nanodiscs) on a suitable sensor chip (e.g., L1 for liposome capture). Aim for a low density (50-100 RU) to minimize mass transport effects and avidity.
- Analyte Preparation: Serially dilute the binding partner (analyte) in running buffer (containing necessary detergents/lipids). Prepare a minimum of five concentrations spanning a 100-fold range (e.g., 0.1, 1, 10, 100, 1000 nM).
- SPR Cycle: Use a constant moderate flow rate (e.g., 30 µL/min). For each concentration, program an association phase of 180 seconds followed by a dissociation phase of 600 seconds.
- Regeneration: Identify and apply a regeneration solution (e.g., mild acidic buffer, detergent pulse) that removes bound analyte without damaging the immobilized membrane protein. Apply for 30-60 seconds.
- Data Analysis: Double-reference the data (reference flow cell and blank injection). Plot the maximum binding response (RU) at the end of the association phase versus analyte concentration. The optimal concentration for kinetic experiments is typically at or below the KD, where the binding response is in the linear range.
Protocol 2: Systematic Flow Rate and Contact Time Analysis
Objective: To decouple mass transport limitations from intrinsic binding kinetics and define conditions for optimal SNR.
- Initial Immobilization: Immobilize the ligand as in Protocol 1.
- Single Concentration, Variable Flow: Inject a mid-range analyte concentration (e.g., 50 nM) at five different flow rates (e.g., 10, 20, 30, 50, 75 µL/min). Keep contact time constant (e.g., 180s). Monitor the shape of the association curve.
- Single Flow, Variable Contact Time: At the flow rate that showed minimal mass transport limitation from step 2, inject the analyte with varying contact times (e.g., 60, 120, 180, 240, 300s). Use the same dissociation time.
- SNR Calculation: For each experiment, measure the baseline noise (standard deviation of response 10 seconds before injection) and the binding response at the end of association. Calculate SNR as (Response / Noise).
- Optimization: Select the flow rate and contact time that yield the highest SNR while maintaining a binding curve shape amenable to kinetic fitting (typically a flow rate where further increases do not change the association rate, and a contact time that reaches ~10-15% of saturation).
The Scientist's Toolkit
Table 3: Essential Research Reagent Solutions for SPR Membrane Protein Studies
| Item | Function & Importance |
|---|---|
| L1 Sensor Chip | Hydrophobic surface for capturing liposomes or nanodiscs containing membrane proteins. Essential for maintaining native lipid environment. |
| Biotinylated Nanodiscs (e.g., MSP, Saposin) | A scaffold system to solubilize membrane proteins in a discrete lipid bilayer. Biotinylation allows for controlled capture on streptavidin (SA) chips. |
| Amphipols / Styrene Maleic Acid (SMA) Copolymers | Alternative membrane mimetics that can stabilize membrane proteins without detergents, often leading to improved stability on SPR chips. |
| HC Running Buffer Additives | Critical to include in all buffers (e.g., 0.1% BSA, 0.005% Tween-20) to reduce non-specific binding of hydrophobic protein domains to the fluidic system. |
| Regeneration Solution Scouting Kit | A set of low pH, high salt, chelating, and mild detergent solutions to empirically identify optimal regeneration conditions without ligand denaturation. |
| Kinetic Injection Control Analyte | A well-characterized, stable protein interaction pair (e.g., antibody-antigen) used to validate instrument performance and chip surface functionality. |
Visualizations
Title: SNR Optimization Parameter Relationships
Title: Sequential Experimental Optimization Workflow
Introduction In Surface Plasmon Resonance (SPR) studies of membrane proteins, data quality is paramount for deriving accurate kinetic and affinity constants. This application note details protocols to identify and correct for three pervasive pitfalls: signal drift, bulk refractive index effects, and experimental artifacts, framed within a thesis on obtaining high-fidelity interaction data for drug discovery.
| Pitfall | Primary Cause | Signature in Sensorgram | Impact on Derived Parameters |
|---|---|---|---|
| Signal Drift | Unstable baseline due to temperature fluctuation, ligand decay, or system instability. | Linear increase or decrease in baseline RU before/after injection; non-flat equilibrium during long association. | Over- or under-estimation of response at equilibrium (Req), affecting calculated affinity (KD). |
| Bulk Effect | Difference in refractive index (RI) between running buffer and analyte sample buffer. | Large, instantaneous "step" response at injection start and stop; superimposable association/dissociation phases for different analyte concentrations. | Can obscure true binding response, especially for low-affinity or low-molecular-weight analytes. |
| Nonspecific Binding (NSB) Artifact | Analyte binding to sensor surface or matrix, not to the immobilized ligand. | Rapid, non-saturable binding; poor dissociation even with high salt or detergent washes. | Masks specific signal, leads to incorrect estimation of binding capacity (Rmax) and kinetics. |
| Mass Transport Artifact | Analyte depletion near the sensor surface due to faster binding than diffusion. | Concentration-dependent association rate (ka); linear association phase instead of curvilinear. | Underestimation of true association rate constant (ka). |
Experimental Protocols
Protocol 1: Reference Surface Subtraction for Bulk Effect Correction
Purpose: To isolate the specific binding signal by subtracting the nonspecific refractive index and instrument artifacts. Materials:
- SPR instrument (e.g., Biacore, Nicoya, Reichert).
- Series S Sensor Chip (e.g., CMS for amine coupling).
- HBS-EP+ buffer: 10 mM HEPES, 150 mM NaCl, 3 mM EDTA, 0.05% v/v Surfactant P20, pH 7.4.
- Sample and running buffer (must be identical after ligand immobilization).
- Reference ligand (e.g., a non-interacting protein or empty liposome) or an activated/blocked reference flow cell.
Procedure:
- Surface Preparation: Immobilize your membrane protein (e.g., GPCR reconstituted in a lipid nanodisc) in the sample flow cell (Fc2). Prepare a reference surface (Fc1) with matching matrix (e.g., empty nanodiscs, scrambled protein).
- Equilibration: Prime the system with at least 3 volumes of running buffer.
- Analyte Series: Inject a 2-3 minute series of analyte concentrations (e.g., 0, 1.56, 3.125, 6.25, 12.5, 25, 50 nM) over both flow cells at a flow rate ≥ 30 µL/min.
- Data Processing: In the instrument software, subtract the reference cell (Fc1) response from the sample cell (Fc2) response for each injection. This removes the bulk shift and any NSB to the matrix.
Protocol 2: Double-Referencing for Advanced Artifact Removal
Purpose: To further correct for residual drift and injection artifacts after reference subtraction. Procedure:
- Perform Protocol 1.
- Include a "blank" injection (zero analyte, running buffer only) in your concentration series.
- After reference cell subtraction, subtract the averaged response of the blank injections from all analyte sensorgrams.
- This "double-referenced" data provides the cleanest representation of specific binding.
Protocol 3: Diagnosing and Mitigating Mass Transport Limitation
Purpose: To test if binding kinetics are limited by analyte diffusion. Procedure:
- Test with Variable Flow Rate: Inject the same analyte concentration at different flow rates (e.g., 10, 30, 75, 100 µL/min). A significant increase in observed association rate with increased flow rate indicates mass transport limitation.
- Mitigation: If mass transport is present, reduce ligand density (lower Rmax) and/or increase flow rate for all experiments to minimize the artifact. Re-evaluate kinetics post-mitigation.
Visualizations
Diagram 1: SPR Data Processing Workflow
Diagram 2: Membrane Protein SPR Surface Architecture
The Scientist's Toolkit: Key Research Reagent Solutions
| Item | Function in Membrane Protein SPR Studies |
|---|---|
| Sensor Chip L1 | Hydrophobic interaction chip for direct capture of liposomes or nanodiscs containing membrane proteins. |
| Sensor Chip NTA | For His-tagged protein capture via nickel chelation. Useful for capturing His-tagged nanodiscs. |
| Lipid Nanodiscs (MSP, Saposin) | Soluble, monodisperse membrane mimetics that keep membrane proteins stable and oriented for SPR analysis. |
| HBS-EP+ Buffer | Standard running buffer; surfactant P20 minimizes NSB to the dextran matrix. |
| Cyclo-dextrin | Used for gentle, quantitative regeneration of L1 chip surfaces by stripping lipid layers. |
| Reference Protein/Lipid | Inert protein (e.g., BSA) or empty nanodiscs for creating a matched reference surface. |
| High-Purity Lipids | For forming consistent bilayers or nanodiscs with defined composition relevant to the native membrane. |
| Regeneration Scouting Kit | Pre-packaged solutions (e.g., glycine pH 1.5-3.0, SDS, NaOH) to identify conditions that remove analyte without damaging the ligand. |
Best Practices for Maintaining Protein Stability and Activity Throughout the SPR Experiment
Within the context of a thesis on Surface Plasmon Resonance (SPR) in membrane protein interaction studies, maintaining protein stability and activity is paramount. Membrane proteins are notoriously labile outside their native lipid environment, making their study via SPR technically challenging. This document outlines current best practices and detailed protocols to ensure the integrity of both soluble and membrane-bound proteins throughout SPR analysis, thereby generating reliable and reproducible binding data crucial for drug discovery.
Key Challenges & Stabilization Strategies
The primary challenges include protein aggregation, denaturation, loss of activity on the sensor surface, and non-specific binding. The following table summarizes quantitative data on stabilization agents and their effects.
Table 1: Common Stabilization Additives for SPR Running Buffers
| Additive Category | Example Compounds | Typical Concentration | Primary Function | Consideration for SPR |
|---|---|---|---|---|
| Detergents | DDM, LMNG, CHAPS | 0.01-0.1% (CMC-dependent) | Solubilize membrane proteins, prevent aggregation | Must be at or above CMC; consistent in all solutions. |
| Lipids/Amphipols | POPC, POPG, Amphipol A8-35 | 0.01-0.1 mg/mL | Provide native-like lipid environment for membrane proteins. | Can reduce non-specific binding; may require specific capture methods. |
| Salts | NaCl, KCl | 50-500 mM | Modulate ionic strength, stabilize protein structure. | High salt can increase bulk shift; keep constant. |
| Stabilizing Agents | Glycerol, Sucrose | 5-10% (v/v), 0.2-0.5 M | Reduce conformational dynamics, prevent dehydration. | Increases viscosity; affects kinetics (ka/kd) minimally. |
| Reducing Agents | TCEP, DTT | 0.5-2 mM | Maintain cysteines in reduced state, prevent disulfide aggregation. | TCEP is preferred for pH stability; use fresh. |
| Carrier Proteins | BSA, Casein | 0.1-0.5 mg/mL | Passivate surface, reduce non-specific binding of analytes. | Must be ultra-pure; ensure it does not interact with system. |
| Chelating Agents | EDTA, EGTA | 0.1-1 mM | Chelate divalent cations to inhibit metalloproteases. | Can affect metal-cofactor dependent proteins. |
Detailed Experimental Protocols
Protocol 1: Preparation of Stabilized Membrane Protein for SPR
This protocol details the immobilization-ready preparation of a G Protein-Coupled Receptor (GPCR) solubilized in LMNG/CHS detergent.
Protein Buffer Exchange:
- Objective: Transfer purified protein into the SPR running buffer to avoid buffer mismatch artifacts.
- Method: Use a size-exclusion column (e.g., Superdex 200 Increase) pre-equilibrated with degassed SPR running buffer (e.g., 20 mM HEPES pH 7.4, 150 mM NaCl, 0.01% LMNG, 0.001% CHS, 0.1% BSA, 0.5 mM TCEP). Collect the monomeric protein peak.
- Validation: Analyze peak fractions by SEC-MALS to confirm monodispersity. Measure concentration via UV280 (using calculated extinction coefficient).
Capture Surface Preparation (Anti-His Antibody Chip):
- Objective: Create a stable, active surface for His-tagged protein capture.
- Method: Using a Series S CM5 sensor chip and a Biacore T200 system: a. Activate the surface with a 1:1 mixture of 0.4 M EDC and 0.1 M NHS (flow rate 10 µL/min, 7 minutes). b. Inject anti-His antibody (10 µg/mL in 10 mM sodium acetate, pH 4.5) over the surface for 7 minutes. c. Deactivate excess active esters with 1 M ethanolamine-HCl, pH 8.5 (7 minutes). d. The final immobilization level should be 8-12 kRU.
Protocol 2: Regeneration Screening for Stable Assay Cycles
Objective: Identify a regeneration solution that fully dissociates the analyte without damaging the immobilized ligand.
- Procedure:
- Perform a binding cycle: Capture the protein ligand, inject a high concentration of analyte, then inject a candidate regeneration solution for 30-60 seconds.
- Monitor the baseline stability over 5-10 repeated cycles.
- Test solutions in order of increasing harshness: 1) Increased flow rate (e.g., 100 µL/min for 60s), 2) Mild acidic/basic buffers (10 mM Glycine pH 2.0-3.5 or pH 8.5-9.0), 3) High salt (1-2 M NaCl), 4) Chaotropic agents (1-3 M MgCl₂), 5) Detergent pulses (0.1% DDM).
Table 2: Regeneration Solution Screening Results
| Candidate Solution | Efficacy (ΔRU Post-Injection) | Baseline Stability (ΔRU over 5 cycles) | Recommended For |
|---|---|---|---|
| 10 mM Glycine, pH 2.5 | >95% | +/- 1 RU | Stable antibodies, many soluble proteins. |
| 3 M MgCl₂ | >98% | +/- 3 RU | High-affinity complexes, aptamers. |
| 0.1% DDM / 10 mM Glycine pH 2.0 | >99% | +/- 5 RU | Membrane protein complexes; may reduce capture antibody activity over time. |
| 50 mM NaOH | >95% | +/- 10 RU | Robust systems only; can denature proteins. |
The Scientist's Toolkit: Research Reagent Solutions
Table 3: Essential Materials for SPR Protein Stability
| Item | Function | Key Consideration |
|---|---|---|
| Biacore Series S Sensor Chips (CM5, NTA, L1) | CM5 for covalent coupling; NTA for His-tag capture; L1 for liposome capture. | The L1 chip is ideal for incorporating membrane proteins into a lipid bilayer. |
| High-Quality Detergents (DDM, LMNG, CHS) | Maintain solubilization and stability of membrane proteins. | Use high-purity (>99%) detergents. LMNG offers superior stability for many GPCRs. |
| Portable UV/Vis Spectrophotometer (e.g., NanoDrop) | Rapid protein quantification pre-injection. | Essential for ensuring consistent analyte concentrations. |
| Automated Liquid Handling System | For precise, reproducible sample and buffer preparation. | Minimizes manual handling errors and variability. |
| In-line Degasser | Integrated into SPR systems to remove dissolved gasses from buffers. | Prevents bubble formation in the microfluidics, which causes noise and data spikes. |
| HBS-EP+ Buffer (10x) | A standardized, low non-specific binding running buffer (HEPES, NaCl, EDTA, Surfactant P20). | The surfactant P20 (0.05%) is critical to reduce non-specific binding to the dextran matrix. |
| Regeneration Scouting Kits | Pre-formatted plates with various pH, ionic, and chaotropic solutions. | Accelerates method development by systematically testing regeneration conditions. |
Visualization of Key Workflows
Title: SPR Experiment Workflow with Stability Checkpoints
Title: Buffer Components Stabilizing a Membrane Protein
SPR in Context: Validating Findings and Comparing with Complementary Techniques
Within the broader thesis on Surface Plasmon Resonance (SPR) in membrane protein interaction studies, this application note addresses the critical need to correlate in vitro binding kinetics with functional cellular outcomes. SPR provides precise kinetic and affinity data (e.g., KD, kon, koff) for ligand-receptor interactions using purified membrane proteins, such as GPCRs or receptor tyrosine kinases, reconstituted in liposomes or nanodiscs. However, these binding events lack cellular context. Functional validation through cellular assays is essential to confirm that measured binding translates to biological activity, thereby de-risking drug discovery pipelines. This document provides integrated protocols for SPR analysis and subsequent cellular functional assays.
Data Correlation Framework
Table 1: Correlation Metrics Between SPR Parameters and Cellular Assay Readouts
| SPR Parameter (Purified Receptor) | Cellular Assay (Live Cells) | Correlation Metric | Ideal Outcome for Functional Agonist/Antagonist |
|---|---|---|---|
| KD (Affinity) | EC50 / IC50 (Dose-Response) | Pearson's r > 0.85 | Strong correlation suggests binding dictates potency. |
| kon (Association Rate) | Early Signaling Kinetics (e.g., Ca2+ flux) | Spearman's ρ > 0.8 | Fast kon correlates with rapid signal initiation. |
| koff (Dissociation Rate) | Signal Duration / Washout Experiments | Comparative half-life | Slow koff may predict prolonged efficacy. |
| Binding Response (RU) Max | Maximal Response (e.g., % cAMP production) | Linear Regression R² | Validates receptor occupancy-function relationship. |
| Specificity (Control Surface) | Specific vs. Non-Specific Cellular Effect | Z'-factor > 0.5 | Confirms cellular response is target-mediated. |
Protocols
Protocol 1: SPR Analysis of a Membrane Protein-Ligand Interaction
Objective: Determine kinetic parameters (ka, kd, KD) of a small molecule binding to a purified GPCR in nanodiscs.
Key Research Reagent Solutions:
- Sensor Chip: Series S Sensor Chip NTA for His-tagged protein capture.
- Running Buffer: HBS-P+ (10 mM HEPES, 150 mM NaCl, 0.05% v/v Surfactant P20, pH 7.4) supplemented with 0.1% (w/v) bovine serum albumin (BSA) and 0.01% (w/v) lipid mixture.
- Membrane Protein: Purified, His-tagged β2-adrenergic receptor (β2-AR) reconstituted in MSP1E3D1 nanodiscs.
- Regeneration Solution: 350 mM EDTA, pH 8.0.
- Analytes: Serial dilutions of ligand (e.g., Isoproterenol) and control compound in running buffer.
Detailed Methodology:
- System Preparation: Prime the SPR instrument (e.g., Biacore 8K) with running buffer.
- Surface Preparation: Activate the NTA sensor chip surface with a 1-minute injection of 0.5 mM NiCl2 at 10 μL/min. Capture the His-tagged β2-AR nanodiscs to a response level of ~5000 RU on the sample flow cell. Use a reference flow cell with empty nanodiscs.
- Binding Kinetics: Inject analyte solutions over the sample and reference surfaces for 180 seconds (association), followed by a 600-second dissociation phase, at a flow rate of 30 μL/min. Use a multi-cycle kinetics approach.
- Regeneration: Remove the receptor and Ni2+ with a 60-second injection of regeneration solution. Re-charge with Ni2+ and re-capture protein for each cycle.
- Data Analysis: Subtract the reference surface data. Fit the resulting sensorgrams to a 1:1 Langmuir binding model using the instrument's evaluation software to calculate ka, kd, and KD.
Protocol 2: Functional Cellular cAMP Assay Post-SPR
Objective: Validate SPR-binding ligands for functional agonist/antagonist activity on live cells expressing β2-AR.
Key Research Reagent Solutions:
- Cell Line: HEK293 cells stably expressing human β2-AR.
- Assay Kit: HTRF cAMP Gs Dynamic Kit (Cisbio).
- Stimulation Buffer: HBSS with 5 mM HEPES, 0.1% BSA, and 500 μM IBMX (phosphodiesterase inhibitor).
- Reference Agonist/Antagonist: Isoproterenol (full agonist) and ICI 118,551 (antagonist).
Detailed Methodology:
- Cell Preparation: Seed cells in a 384-well microplate at 10,000 cells/well in culture medium. Incubate for 24 hours.
- Ligand Stimulation: Prepare ligand dilutions (from SPR stock) in stimulation buffer. Aspirate culture medium and add 10 μL of ligand solution per well. Incubate for 30 minutes at 37°C.
- cAMP Detection: Add 5 μL each of HTRF cAMP-d2 and anti-cAMP Cryptate reagents. Incubate for 1 hour at room temperature.
- Readout: Measure time-resolved fluorescence at 620 nm and 665 nm on a compatible plate reader. Calculate the 665/620 nm ratio.
- Data Analysis: Generate dose-response curves. Calculate EC50 (agonist) or IC50 (antagonist) values. Correlate with SPR-derived KD values (Table 1).
Visualizations
Title: SPR to Cellular Assay Validation Workflow
Title: Correlating SPR Kinetics with Cellular Pathways
Thesis Context: This application note, framed within a broader thesis on Surface Plasmon Resonance (SPR) in membrane protein interaction studies, provides a comparative analysis of SPR and Bio-Layer Interferometry (BLI) technologies. The focus is on practical considerations for researchers investigating challenging targets like membrane protein-ligand interactions in drug discovery.
Comparative Performance Analysis
| Parameter | SPR (e.g., Biacore systems) | BLI (e.g., Octet/Sartorius, Gator/Biolin) |
|---|---|---|
| Throughput (Samples/Hour) | Moderate-High (96-384 well automation). | Very High (up to 96 samples simultaneously, ~960-2000 data points/day). |
| Flexibility & Assay Development | High. Real-time, label-free monitoring of all phases. Superior for complex kinetics & crude samples. | Moderate. End-point or kinetic analysis. Sensitive to environmental vibrations & certain sample matrices. |
| Sample Consumption | Lower in microfluidics (~20-50 µL/min). | Significantly Higher for immersion steps (~200 µL per well). |
| Kinetic Rate Constant Range | Broad (ka: up to 107 M-1s-1; kd: down to 10-6 s-1). | Optimal for moderate kinetics (kd > 10-4 s-1). Very fast/slow kinetics challenging. |
| Regeneration | Often required, can be harsh for delicate proteins. | Dip-and-Read format; biosensor tips are disposable, eliminating harsh regeneration. |
| Primary Advantage | Gold-standard for precise, high-quality kinetics in complex buffers. | Superior speed and simplicity for screening and titer measurements. |
Application Notes & Protocols
Protocol: Kinetic Analysis of a Small Molecule Inhibitor Binding to a Tethered Membrane Protein using SPR
Objective: Determine the association (ka) and dissociation (kd) rate constants for a drug candidate binding to a detergent-solubilized GPCR captured on an SPR chip.
The Scientist's Toolkit:
| Reagent/Material | Function |
|---|---|
| SPR Instrument (e.g., Biacore T200, Cytiva) | Platform for real-time, label-free interaction analysis. |
| Sensor Chip (e.g., NTA chip) | Gold surface functionalized with nitrilotriacetic acid for His-tag capture. |
| Running Buffer (HBS-EP+ with 0.05% DDM) | Provides physiological pH and ionic strength; detergent keeps membrane protein soluble. |
| His-tagged Membrane Protein (in micelles) | Purified target protein with polyhistidine tag for oriented capture. |
| Analyte Compounds | Small molecule inhibitors in running buffer with <1% DMSO. |
| Regeneration Solution (350 mM EDTA) | Removes captured protein and regenerates the NTA surface. |
Workflow:
- System Preparation: Prime instrument with degassed running buffer.
- Surface Preparation: Activate NTA chip with NiCl2 (1-2 min). Dilute His-tagged protein in running buffer and inject over flow cell(s) to achieve ~50-100 RU of capture.
- Kinetic Experiment: Using multi-cycle kinetics, inject a 2-fold serial dilution of analyte (e.g., 0.78 nM to 100 nM) over protein and reference surfaces at 30 µL/min for 120s association, followed by 600s dissociation in running buffer.
- Regeneration: After each cycle, inject EDTA for 30s to strip the protein and re-charge with Ni2+.
- Data Analysis: Double-reference sensorgrams (reference surface & buffer blank). Fit data to a 1:1 binding model using instrument software to extract ka, kd, and KD (kd/ka).
Diagram: SPR Multi-Cycle Kinetic Assay Workflow
Protocol: High-Throughput Screening of Antibody Binding to a Membrane Protein Antigen using BLI
Objective: Rapidly screen 96 hybridoma supernatants for binding to a purified membrane protein ectodomain.
The Scientist's Toolkit:
| Reagent/Material | Function |
|---|---|
| BLI Instrument (e.g., Octet HTX, Sartorius) | Platform for dip-and-read, label-free interaction analysis in microplate format. |
| Anti-His (HIS1K) Biosensor Tips | Fiber optic sensors coated with anti-His antibodies for antigen capture. |
| Assay Buffer (PBS, 0.1% BSA, 0.02% Tween-20) | Provides binding milieu and minimizes non-specific adsorption. |
| His-tagged Antigen | Purified membrane protein target. |
| Sample Plate (96-well) | Contains hybridoma supernatants or purified antibodies for screening. |
Workflow:
- Baseline: Hydrate biosensor tips in assay buffer for 10 min. Record baseline in buffer for 60s.
- Loading: Immerse tips in a well containing His-tagged antigen (5-10 µg/mL) for 300s to load protein onto the sensor tip.
- Baseline 2: Return to assay buffer for 60s to establish a stable baseline post-loading.
- Association: Dip sensors into sample wells containing hybridoma supernatants for 180s to measure binding.
- Dissociation: Return sensors to assay buffer for 300s to monitor dissociation.
- Data Analysis: Align curves to the start of association. Report the binding response (nm shift) at a fixed timepoint (e.g., 180s) for ranking. Full kinetics can be extracted for hits.
Diagram: BLI Dip-and-Read Screening Workflow
Comparative Diagram: Technology Decision Pathway
Diagram: SPR vs BLI Technology Selection Guide
Within the context of a broader thesis on Surface Plasmon Resonance (SPR) in membrane protein interaction studies, the complementary roles of SPR and ITC are critical. While SPR excels at providing detailed kinetic profiles (association/dissociation rates), ITC directly measures the thermodynamic parameters (enthalpy, entropy, Gibbs free energy, stoichiometry) of biomolecular interactions. For membrane proteins—often targets in drug discovery—combining these techniques yields a complete biophysical characterization, linking binding kinetics to the underlying energetic drivers.
Table 1: Core Capabilities of SPR and ITC
| Parameter | SPR (e.g., Biacore, Nicoya) | ITC (e.g., MicroCal PEAQ-ITC) |
|---|---|---|
| Primary Output | Kinetic rates (ka, kd), Affinity (KD from kinetics/steady-state) | Thermodynamic parameters (ΔH, ΔS, ΔG, n), Affinity (KD from equilibrium) |
| Sample Consumption | Low (ligand immobilization; analyte in solution) | High (both interaction partners in solution) |
| Throughput | High (multiple channels, automated analysis) | Low (single sample per experiment) |
| Key Requirement | Immobilization of one partner (often via capture) | Both partners in soluble form; significant heat change |
| Typical KD Range | pM to mM | nM to mM |
| Information on Stoichiometry | Indirect | Direct |
| Suitability for Membrane Proteins | Excellent (via capture on L1 chips, nanodiscs, liposomes) | Challenging but possible (requires detergent/lipid compatibility) |
Table 2: Combined Data from a Model Membrane Protein Interaction (Hypothetical Receptor:Ligand)
| Measurement Type | Parameter | Value | Technique |
|---|---|---|---|
| Kinetics | Association Rate (ka) | 1.5 x 10^5 M^-1s^-1 | SPR |
| Dissociation Rate (kd) | 3.0 x 10^-3 s^-1 | SPR | |
| Kinetic KD (kd/ka) | 20 nM | SPR | |
| Thermodynamics | Enthalpy Change (ΔH) | -60.2 kJ/mol | ITC |
| Entropy Change (-TΔS) | -10.4 kJ/mol | ITC | |
| Gibbs Free Energy (ΔG) | -50.8 kJ/mol | ITC | |
| Binding Stoichiometry (n) | 0.95 | ITC | |
| Thermodynamic KD | 18 nM | ITC |
Detailed Experimental Protocols
Protocol 1: SPR Analysis of a Membrane Protein Kinase Binding to a Drug Candidate
This protocol assumes the use of a lipid-coated sensor chip (e.g., Series S L1 chip) to capture membrane proteins in a native-like environment.
A. Reagent and Chip Preparation
- Running Buffer: HEPES-buffered saline (HBS-EP+: 10 mM HEPES, 150 mM NaCl, 3 mM EDTA, 0.05% v/v Surfactant P20, pH 7.4). Filter (0.22 µm) and degas.
- Capture System: Prepare ligand (e.g., drug candidate) in running buffer. Dilute to 10-50 µM for immobilization.
- Analyte: Purified membrane protein (e.g., receptor tyrosine kinase) reconstituted in nanodiscs or detergent micelles (e.g., 0.01% DDM). Centrifuge (100,000 x g, 30 min) before injection to remove aggregates.
B. Sensor Chip Surface Preparation
- Lipid Coating: At 5 µL/min, inject a solution of small unilamellar vesicles (SUVs, 0.5 mg/mL in running buffer) over the L1 chip for 10-15 minutes until a stable baseline is achieved (~5000-8000 RU increase).
- Ligand Immobilization: Activate the lipid surface with a 1:1 mixture of 0.4 M EDC and 0.1 M NHS for 7 minutes at 10 µL/min.
- Inject the ligand solution (in sodium acetate, pH 5.0) for 7 minutes at 10 µL/min. Target immobilization level: 50-100 RU for kinetic analysis.
- Deactivate excess reactive esters with a 7-minute injection of 1 M ethanolamine-HCl, pH 8.5.
- A reference flow cell should be prepared identically but without ligand injection.
C. Kinetic Binding Experiment
- Binding Analysis: Dilute the membrane protein analyte in running buffer (with compatible detergent) across a concentration series (e.g., 1.56, 3.125, 6.25, 12.5, 25, 50 nM). Include a zero concentration for double referencing.
- Inject each concentration over the ligand and reference surfaces for 3 minutes (association phase) at a flow rate of 30 µL/min.
- Monitor dissociation in running buffer for 10 minutes.
- Regenerate the surface with a 30-second pulse of 10 mM glycine-HCl, pH 2.0, to remove all bound analyte without damaging the lipid layer.
D. Data Analysis
- Subtract reference cell sensorgram and buffer blank injection.
- Fit the globally aligned sensorgrams to a 1:1 Langmuir binding model using the SPR instrument’s software (e.g., Biacore Evaluation Software). Report ka, kd, and the kinetic KD (kd/ka).
Protocol 2: ITC Analysis of the Same Interaction
This protocol is adapted for a membrane protein in detergent, using a MicroCal PEAQ-ITC system.
A. Sample Preparation
- Cell Solution: Prepare the membrane protein (e.g., the kinase in 0.01% DDM) in ITC buffer (20 mM HEPES, 150 mM NaCl, 1 mM TCEP, 0.01% DDM, pH 7.4). Concentration typically 5-20 µM.
- Syringe Solution: Prepare the ligand (drug candidate) in the identical buffer. Concentration should be 10-20 times higher than the cell protein concentration. Critical: The ligand solution must be prepared by dialysis against the protein buffer or using a buffer exchange column to perfect match the chemical composition (detergent, salt, pH) and eliminate heat of dilution artifacts.
- Degassing: Degas both solutions for 10 minutes under vacuum before loading to prevent bubbles.
B. ITC Experiment Setup
- Load the protein solution into the sample cell (volume ~280 µL). Load the ligand solution into the titration syringe.
- Set experimental parameters:
- Temperature: 25°C
- Reference Power: 5-10 µcal/sec
- Stirring Speed: 750 rpm
- Initial Delay: 60 sec
- Titration: 19 injections of 2 µL each, with 150-second spacing between injections.
- Run a control experiment by titrating ligand into buffer alone to measure and subtract the heat of dilution.
C. Data Analysis
- Integrate the raw heat pulses per injection to obtain the normalized enthalpy change per mole of injectant.
- Subtract the control titration data.
- Fit the binding isotherm to a single-site binding model using the instrument software. The fit directly yields the binding stoichiometry (n), the association constant (Ka = 1/KD), and the enthalpy change (ΔH).
- Calculate ΔG = -RT ln(Ka) and ΔS = (ΔH - ΔG)/T.
Visualizations
Diagram Title: SPR and ITC Complementary Workflow
Diagram Title: Hierarchy of Binding Information
The Scientist's Toolkit: Key Research Reagent Solutions
Table 3: Essential Materials for SPR/ITC Studies of Membrane Proteins
| Item | Function/Description | Key Consideration for Membrane Proteins |
|---|---|---|
| Sensor Chip L1 | SPR chip with hydrophobic alkane thiols for capturing lipid bilayers or vesicles. | Enables stable capture of proteoliposomes, nanodiscs, or membrane proteins in detergent micelles. |
| Nanodiscs (MSP, SAP) | Soluble, discoidal lipid bilayers held by scaffold proteins. | Provides a native-like lipid environment for integral membrane proteins without bulk detergent. |
| Detergents (DDM, LMNG) | Mild detergents for solubilizing and stabilizing membrane proteins. | Critical for maintaining protein activity in solution for both SPR (analyte) and ITC. |
| HBS-EP+ Buffer | Standard SPR running buffer with chelator and surfactant. | The surfactant (P20) prevents non-specific binding; EDTA chelates divalent cations. |
| PEAQ-ITC Cleaning Solution | Specific detergent for the ITC cell. | Essential for removing membrane protein/detergent residues to prevent contamination. |
| Ethanolamine-HCl | Quenching agent for SPR amine coupling. | Deactivates NHS esters after ligand immobilization. |
| Glycine-HCl (pH 2.0/2.5) | Standard SPR regeneration solution. | Must be strong enough to dissociate high-affinity binders but not damage the lipid surface. |
| Size Exclusion Columns | For buffer exchange (e.g., Zeba Spin Desalting Columns). | Critical for ITC: To exactly match the buffer composition of protein and ligand solutions. |
| Tris(2-carboxyethyl)phosphine (TCEP) | Reducing agent. | Prevents oxidation of cysteine residues; more stable than DTT in long experiments. |
Within the broader thesis on SPR's role in membrane protein interaction studies, understanding the complementary strengths and limitations of Surface Plasmon Resonance (SPR) and Microscale Thermophoresis (MST) is critical for advancing challenging research areas, such as orphan receptor ligand discovery or the characterization of fragile complexes.
1. Quantitative Comparison: Sensitivity & Sample Suitability
| Parameter | Surface Plasmon Resonance (SPR) | Microscale Thermophoresis (MST) |
|---|---|---|
| Typical Sensitivity (K_D Range) | ~1 µM to ~1 pM (High) | ~1 mM to ~10 pM (Very High) |
| Sample Consumption (per titration) | Medium-High (≈ 100-500 µL at µM conc.) | Extremely Low (≈ 4-20 µL, nanoliter-scale capillaries) |
| Required Sample Purity | High (immobilization prone to artifacts) | Medium (labeling required, but solution-based) |
| Compatibility with Detergents/Lipids | Challenging (requires precise reference surface controls) | Excellent (in-solution, less prone to bulk effect artifacts) |
| Throughput Potential | High (parallel, automated multi-channel systems) | Medium (sequential capillary measurements) |
| Assay Development Time | Longer (immobilization optimization) | Shorter (mix-and-measure post-labeling) |
| Key Strength | Real-time kinetics (kon, koff), robust quantification. | Works in complex buffers (e.g., cell lysates, crude samples). |
| Key Limitation | Surface immobilization can alter protein function. | Requires fluorescent labeling or intrinsic protein fluorescence. |
2. Detailed Application Notes & Protocols
Application Note 1: SPR for a Detergent-Solubilized Membrane Protein Receptor-Ligand Interaction
- Context: Measuring the kinetics of a small molecule inhibitor binding to a purified, detergent-solubilized GPCR.
- Challenge: Non-specific binding of detergent micelles to the sensor surface.
- Protocol: L1 Sensor Chip (Lipid Capture) immobilization is optimal.
- Chip Preparation: Dock a Pioneer L1 chip. Prime the system with running buffer (HBS-EP + 0.02% DDM).
- Capture: Inject vesicles (e.g., POPC liposomes) at 5 µL/min for 10 min to form a stable hybrid bilayer.
- Receptor Immobilization: Dilute His-tagged receptor in running buffer. Inject for 5-10 min at 2 µL/min, capturing via the His-tag to the lipid surface. Achieve ~5000-8000 RU response.
- Kinetic Run: Perform serial injections of the small molecule analyte (0.1 nM - 10 µM) at 30 µL/min for 3 min association, 10 min dissociation.
- Regeneration: Use a 60-s pulse of 50 mM NaOH to strip the receptor. The lipid surface remains intact for a new capture cycle.
- Data Interpretation: Reference-subtracted sensograms are fit to a 1:1 Langmuir binding model to extract ka, kd, and KD.
Application Note 2: MST for a Low-Solubility Transmembrane Peptide Partner Interaction
- Context: Determining the affinity of a transmembrane peptide (poorly soluble in aqueous buffers) for its full-length membrane protein partner.
- Challenge: Maintaining peptide solubility and native conformation without surface tethering.
- Protocol: Monolith NT.115 Pico with RED dye labeling.
- Labeling: Purify the soluble domain of the target protein. Use the MO-L008 RED-NHS 2nd Generation dye kit. Incubate 10 µM protein with dye at a 1:1 molar ratio for 30 min in the dark at RT.
- Desalting: Remove free dye using a pre-equilibrated desalting column. Determine degree of labeling (DoL, aim for 0.3-1.5).
- Sample Preparation: Prepare a 16-step 1:1 dilution series of the unlabeled transmembrane peptide in assay buffer (containing 0.05% DDM to maintain solubility). Keep labeled protein constant at 10 nM.
- Measurement: Load samples into premium coated capillaries. Insert into instrument. Set MST power to 20% and LED power to 40%. Run the experiment at 25°C.
- Analysis: Use the MO.Affinity Analysis software. The dose-response curve of normalized fluorescence (Fnorm) vs. peptide concentration is fit to the KD model.
- Data Interpretation: The KD is derived from the inflection point of the sigmoidal binding curve. The technique is insensitive to the detergent's presence in the buffer.
3. Visualizing Workflows and Pathways
Title: SPR Kinetic Analysis Workflow (76 chars)
Title: MST Affinity Measurement Workflow (63 chars)
4. The Scientist's Toolkit: Essential Research Reagents & Materials
| Item | Function & Suitability | Typical Product/Example |
|---|---|---|
| Biacore Series S CM5 Chip | Gold standard for general ligand immobilization via amine coupling. Less ideal for membrane proteins. | Cytiva Biacore Sensor Chip CM5 |
| Biacore Pioneer L1 Chip | Hydrophobic surface for capturing liposomes/nanodiscs, essential for native-like membrane protein studies in SPR. | Cytiva Sensor Chip L1 |
| NHS/EDC Coupling Kit | For covalent amine coupling of proteins/peptides to carboxylated sensor chips (CM5, CMS). | Cytiva Amine Coupling Kit |
| MO-L008 RED-NHS 2nd Gen Dye | Hydrophilic, bright dye for covalent labeling of amines for MST. Minimizes aggregation. | NanoTemper Technologies Protein Labeling Kit RED |
| Premium Coated Capillaries | Reduce surface adhesion for sensitive samples like membrane proteins in detergents. | NanoTemper Technologies Premium Coated Capillaries |
| Suitable Detergent (DDM/NG) | Maintains solubility and stability of extracted membrane proteins. Critical for both techniques. | n-Dodecyl-β-D-maltoside (DDM) |
| Proteoliposomes / Nanodiscs | Provide a native lipid bilayer environment for membrane protein reconstitution, used with L1 chips. | POPC Liposomes, MSP Nanodiscs |
| High-Quality Running Buffer | HBS-EP (HEPES, NaCl, EDTA, Surfactant P20) is standard for SPR to minimize non-specific binding. | 10x HBS-EP+ Buffer, pH 7.4 |
Integrating SPR with Structural Methods (Cryo-EM, X-ray) for a Holistic Understanding
Within the broader thesis on Surface Plasmon Resonance (SPR) in membrane protein interaction studies, this application note details the synergistic integration of SPR with high-resolution structural methods. SPR provides dynamic, quantitative binding kinetics and affinity data in near-native lipid environments, while Cryo-EM and X-ray crystallography deliver atomic-resolution structural snapshots. Combining these techniques enables researchers to correlate thermodynamic and kinetic parameters with structural mechanisms, offering a holistic understanding of membrane protein interactions critical for drug discovery.
Membrane proteins represent over 60% of drug targets but are challenging to study due to their hydrophobic nature and conformational flexibility. SPR has become a cornerstone for characterizing the interactions of purified, often detergent-solubilized or nanodisc-reconstituted membrane proteins, providing real-time data on binding stoichiometry, affinity (KD), and kinetics (ka, kd). However, SPR alone cannot reveal the atomic details of the interaction interface or conformational changes induced by binding. This is where integration with Cryo-electron microscopy (Cryo-EM) and X-ray crystallography becomes transformative. Cryo-EM, capable of solving structures of large complexes in vitrified ice, and X-ray crystallography, providing ultra-high-resolution models, furnish the structural framework. The iterative cycle of using SPR to rapidly screen conditions and ligands for optimal complex formation, followed by structural determination, and then using the structural model to design new SPR mutagenesis experiments, creates a powerful feedback loop for mechanistic insight.
Application Notes: Key Use Cases and Data
Use Case 1: Fragment-Based Drug Discovery (FBDD) for a GPCR
SPR is used initially to screen a fragment library against a stabilized GPCR (e.g., β2-adrenergic receptor) captured on a biosensor chip. Weak binders (mM KD range) identified by SPR are then chemically elaborated. Co-crystallization or Cryo-EM of the GPCR with lead fragments, informed by SPR binding confirmation, reveals the precise binding pocket. SPR subsequently validates the improved affinity of optimized compounds.
Table 1: SPR Kinetic Data for Fragment Optimization on GPCR Target
| Compound | ka (1/Ms) | kd (1/s) | KD (nM) | Response (RU) | Method for Structure |
|---|---|---|---|---|---|
| Fragment A | 1.2 x 10^3 | 0.15 | 125,000 | 18 | Not determined |
| Lead 1 (Elaborated) | 5.5 x 10^4 | 0.002 | 36 | 102 | X-ray (2.8 Å) |
| Lead 2 (Optimized) | 8.9 x 10^4 | 0.0005 | 5.6 | 115 | Cryo-EM (3.2 Å) |
Use Case 2: Understanding an Ion Channel Modulator Mechanism
SPR analysis of a toxin binding to a voltage-gated ion channel (e.g., Kv1.3) in nanodiscs provides definitive kinetics and affinity. This biochemical data guides the preparation of a stable complex for single-particle Cryo-EM. The resulting structure shows the toxin's orientation and which channel residues it contacts. Site-directed mutagenesis of these residues, followed by SPR validation, confirms the functional binding epitope.
Table 2: Correlation of SPR Binding Data with Cryo-EM Structural Insights for Ion Channel-Toxin Complex
| Channel Variant | KD (pM) | ΔG (kcal/mol) | Key Mutated Residue (from Structure) | Result (vs. Wild Type) |
|---|---|---|---|---|
| Wild Type | 45 ± 5 | -14.9 | N/A | Baseline |
| Mutant E352A | 4200 ± 800 | -11.8 | Glu352 (Salt bridge) | ~100-fold loss in affinity |
| Mutant D375K | No binding | N/A | Asp375 (Electrostatic) | Abolishes binding |
Detailed Experimental Protocols
Protocol A: SPR-Based Screening to Identify Conditions for Structural Studies
Objective: To identify a high-affinity, stable ligand-protein complex suitable for Cryo-EM grid preparation or crystallization.
- Sensor Chip Preparation: Immobilize the purified membrane protein (in DDM/CHS or reconstituted in nanodiscs) on a Series S Sensor Chip L1 (capturing lipophilic surfaces) using standard amine coupling to a reference flow cell for background subtraction.
- Ligand Binding Screen: Perform single-cycle kinetics or multi-cycle kinetics injections of candidate small molecules, peptides, or binding partners across a range of concentrations (e.g., 0.1-10 x expected KD).
- Stability Assessment: Monitor the dissociation phase for at least 600 seconds. A slow dissociation (kd < 10^-4 s^-1) and a flat baseline indicate a stable complex.
- Complex Formation for Structural Work: Based on SPR results, scale up the binding reaction using the same buffer conditions and molar ratio (typically 1.2-2x ligand excess) that yielded ~95% saturation in SPR. Incubate for 30 min on ice.
- Purification: Inject the mixture over a size-exclusion chromatography (SEC) column pre-equilibrated with Cryo-EM buffer (e.g., containing 0.05% DDM, 150 mM NaCl, 20 mM HEPES pH 7.5) or crystallization screen buffer. Collect the peak corresponding to the complex.
- Quality Control: Analyze the SEC peak fractions by SDS-PAGE and negative-stain EM (for Cryo-EM) to confirm homogeneity and monodispersity.
Protocol B: SPR Validation of Insights from a Cryo-EM/X-ray Structure
Objective: To biochemically validate a predicted binding interface from a structural model.
- Structural Analysis: Identify key residues at the protein-ligand or protein-protein interface from the PDB file (e.g., hydrogen bonds, salt bridges, hydrophobic patches).
- Mutagenesis: Design point mutations (e.g., alanine scanning, charge reversal) for the target protein residues.
- Protein Production: Express and purify the wild-type and mutant proteins using identical protocols (e.g., insect cell expression, affinity purification, SEC).
- SPR Analysis:
- Immobilize a consistent amount (~5000-8000 RU) of each protein variant on separate flow cells of an L1 chip.
- Run identical concentration series of the binding partner over all flow cells.
- Use a global fitting model (1:1 Langmuir binding) to determine ka, kd, and KD for each interaction.
- Data Interpretation: A significant increase in KD (>10-fold) for a mutant confirms the functional importance of that residue, corroborating the structural observation.
Visualizing the Integrative Workflow and Signaling Context
Title: Iterative SPR-Structural Biology Workflow Cycle
Title: SPR & Structural Techniques in a Signaling Pathway
The Scientist's Toolkit: Essential Research Reagents & Materials
Table 3: Key Reagent Solutions for Integrated SPR-Structural Studies of Membrane Proteins
| Item | Function & Relevance in Workflow | Example Product/Buffer |
|---|---|---|
| Lipid-Mimetic Detergents | Solubilize membrane proteins while maintaining stability for SPR and crystallization. | n-Dodecyl-β-D-maltopyranoside (DDM), Lauryl Maltose Neopentyl Glycol (LMNG), CHAPS. |
| Nanodisc Components | Provide a native-like lipid bilayer environment for SPR analysis and more stable complexes for Cryo-EM. | Membrane Scaffold Proteins (MSPs), synthetic lipids (e.g., POPC), Bio-Beads for reconstitution. |
| Stabilizing Ligands/Additives | Increase protein stability and homogeneity, crucial for both SPR surface stability and structure determination. | Tocolytics (e.g., alprenolol for GPCRs), cholesterol hemisuccinate (CHS), glycerol. |
| High-Affinity Capture Surfaces | Enable oriented, functional immobilization of membrane proteins for SPR kinetics. | Sensor Chip L1 (hydrophobic capture), NTA chips for His-tagged proteins, anti-Fc antibody chips. |
| Cryo-EM Grids & Vitrification Tools | Prepare thin, vitrified ice films of the purified complex for electron microscopy. | Quantifoil or C-Flat holey carbon grids, Vitrobot (plunge freezer), liquid ethane. |
| Crystallization Screening Kits | Identify conditions for growing diffraction-quality crystals of the protein-ligand complex. | MemGold, MemMeso suite, PEG/Ion screens. |
| SEC Buffers (Ammonium-Free) | Essential for final polishing of complexes; ammonium ions interfere with SPR analysis. | HEPES or Tris buffers with compatible salts (NaCl, KCl) and low detergent. |
Conclusion
SPR biosensing stands as an indispensable, versatile platform in the membrane protein research toolkit, providing unmatched real-time kinetic and affinity data that directly inform drug discovery and mechanistic biology. By mastering its foundational principles, applying robust methodological protocols, adeptly troubleshooting experimental hurdles, and strategically validating results with orthogonal techniques, researchers can reliably decipher the complex interactions of these high-value targets. The ongoing evolution of SPR instrumentation, lipid mimetic systems, and data analysis software promises to further enhance its sensitivity and throughput, solidifying its central role in translating membrane protein biology into novel clinical therapeutics.