Unlocking Nanomedicine: How SPR Analysis Revolutionizes Nanoparticle Characterization for Drug Delivery
This article provides a comprehensive guide to Surface Plasmon Resonance (SPR) for characterizing nanoparticles in biomedical research.
Unlocking Nanomedicine: How SPR Analysis Revolutionizes Nanoparticle Characterization for Drug Delivery
Abstract
This article provides a comprehensive guide to Surface Plasmon Resonance (SPR) for characterizing nanoparticles in biomedical research. We explore the fundamental principles of SPR, detailing its application in measuring critical nanoparticle properties like size, concentration, surface charge, and biomolecular interactions. Methodological protocols for functionalization and binding kinetics are covered, alongside practical troubleshooting for non-specific binding and surface regeneration. The content validates SPR against techniques like DLS and NTA, highlighting its unique advantages in label-free, real-time analysis. Aimed at researchers and drug development professionals, this resource synthesizes current best practices to optimize nanoparticle design and accelerate therapeutic development.
SPR Fundamentals: Core Principles for Nanoparticle Analysis in Biomedicine
Within the broader thesis on Surface Plasmon Resonance (SPR) for nanoparticle characterization in biomedicine, this application note details the fundamental physics underpinning SPR sensing. The phenomenon of surface plasmon resonance and the generation of evanescent fields form the cornerstone of label-free, real-time analysis of biomolecular interactions and nanomaterial properties, critical for drug development and diagnostic research.
The Physics of Surface Plasmon Resonance
Plasmon Resonance Fundamentals
Surface plasmons are coherent oscillations of free electrons at the interface between a metal (typically gold or silver) and a dielectric (e.g., buffer, glass). Resonance occurs when incident light photons couple with these electron oscillations under specific conditions of angle, wavelength, and polarization.
Key Equation (Momentum Matching):
k_SP = k_light * sin(θ)
Where k_SP is the plasmon wavevector, k_light is the incident light wavevector, and θ is the angle of incidence. Resonance is achieved using a prism (Kretschmann configuration) or a grating to provide the necessary momentum boost.
The Evanescent Field
Upon resonance, the electromagnetic field intensity perpendicular to the interface decays exponentially, creating an evanescent wave. This field typically extends 100-300 nm into the dielectric medium, making it exquisitely sensitive to changes in the local refractive index (RI) within this short range.
Table 1: Evanescent Field Penetration Depth for Common SPR Configurations
| Metal Film | Excitation Wavelength (nm) | Typical Penetration Depth (nm) | Primary Application |
|---|---|---|---|
| Gold (Au) | 760-850 | 150-250 | Biomolecular interaction analysis |
| Gold (Au) | 633 (HeNe) | 180-220 | Standard ligand binding assays |
| Silver (Ag) | 532 | 100-150 | High-sensitivity, short-range detection |
| Gold-Silver Alloy | 650-750 | 120-200 | Optimized stability and sensitivity |
SPR for Nanoparticle Characterization: Protocols
Protocol: Determining Nanoparticle Conjugation Efficiency
This protocol measures the number of antibodies or targeting ligands successfully conjugated to a nanoparticle surface.
Materials & Workflow:
- Baseline Establishment: Flow running buffer over a sensor chip coated with anti-Fc or Protein A until stable.
- Capture: Inject purified antibody (not conjugated) at a known concentration. Record the response (RU_capture).
- Regeneration: Strip the antibody with a low-pH glycine buffer.
- Nanoparticle Injection: Inject the antibody-conjugated nanoparticle sample at a known nanoparticle molar concentration.
- Data Analysis: Compare the response (RU_NP) to the standard antibody curve. Calculate the ligand density.
Calculation:
Ligands per NP = (RU_NP / RU_capture) * (Mol. Wt. Antibody / Mol. Wt. NP) * (Conc. Antibody Std / Conc. NP Sample)
Protocol: Measuring Nanoparticle-Biointerface Binding Kinetics
This protocol determines the association (k_on) and dissociation (k_off) rates of targeted nanoparticles to immobilized cellular receptors.
Methodology:
- Receptor Immobilization: Use amine-coupling chemistry to immobilize the purified target receptor (e.g., EGFR, VEGFR) on a CMS sensor chip.
- Baseline: Stabilize with HBSEP buffer (HBS-EP: 10 mM HEPES, 150 mM NaCl, 3 mM EDTA, 0.05% v/v Surfactant P20, pH 7.4).
- Association Phase: Inject a dilution series of nanoparticles (e.g., 0.1, 0.5, 1.0, 5.0 nM) at a constant flow rate (e.g., 30 µL/min) for 3-5 minutes.
- Dissociation Phase: Switch to buffer-only flow and monitor dissociation for 10-20 minutes.
- Regeneration: Use a 10-50 mM NaOH short pulse to regenerate the surface.
- Analysis: Fit the sensorgrams globally to a 1:1 Langmuir binding model using the instrument software (e.g., Biacore Evaluation Software).
The Scientist's Toolkit: Key Research Reagent Solutions
Table 2: Essential Materials for SPR-based Nanoparticle Characterization
| Item | Function & Importance | Example Product/Chemical |
|---|---|---|
| Gold-coated Sensor Chips | Provides the metal-dielectric interface for plasmon excitation. High-quality, uniform thin films (≈50 nm) are critical. | Cytiva SIA Kit Au, BRBT G Series |
| Carboxymethylated Dextran Matrix | Hydrogel for covalent immobilization of ligands; reduces non-specific binding and provides a 3D binding environment. | Cytiva CM5, CM7, CM3 Chips |
| Amine-coupling Reagents | Standard chemistry for immobilizing proteins, peptides. | 1-ethyl-3-(3-dimethylaminopropyl)carbodiimide (EDC), N-hydroxysuccinimide (NHS) |
| Regeneration Solutions | Removes bound analyte without damaging the immobilized ligand. Must be optimized for each interaction. | 10-100 mM Glycine-HCl (pH 1.5-3.0), 10-50 mM NaOH |
| Surfactant-containing Running Buffer | Minimizes non-specific adsorption of nanoparticles to the chip surface and fluidics. | HBS-EP or PBS-P (with 0.05% Polysorbate 20) |
| Kinetic Analysis Software | Enables global fitting of binding data to extract kinetic and affinity constants. | Biacore Insight Evaluation Software, TraceDrawer, Scrubber |
| Reference Subtraction Flow Cell | An essential internal control channel to subtract bulk RI changes and instrument drift. | Built into all multi-channel SPR instruments (e.g., Biacore T200, Nicoya OpenSPR) |
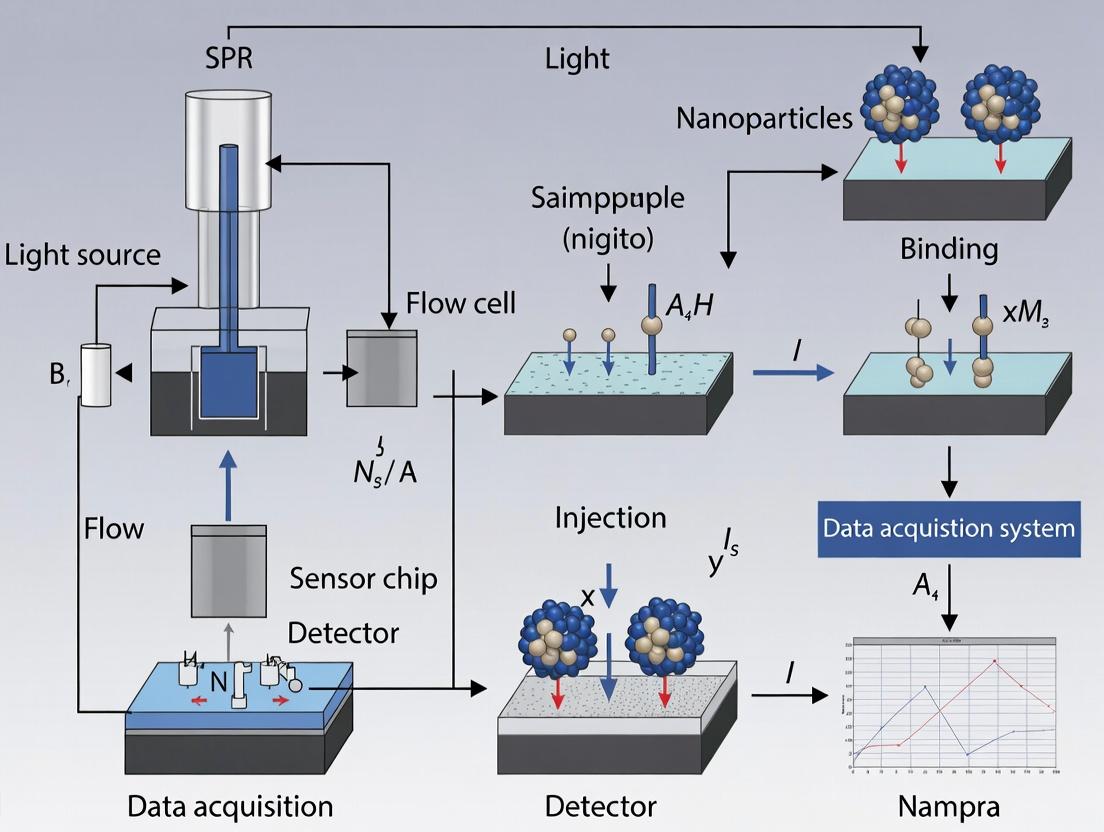
Visualizing SPR Workflows and Signal Generation
SPR Signal Generation Pathway
Nanoparticle Binding Kinetics Protocol
This application note supports a doctoral thesis investigating the critical role of Surface Plasmon Resonance (SPR) in characterizing engineered nanoparticles (NPs) for biomedical applications. The transition of nanotherapeutics from bench to bedside is predicated on rigorous physicochemical characterization, as parameters like size, concentration, and zeta potential directly influence biodistribution, cellular uptake, and therapeutic efficacy. While traditional techniques like dynamic light scattering (DLS) and nanoparticle tracking analysis (NTA) provide standalone data, SPR offers a unique, label-free platform for the real-time, simultaneous determination of these key parameters during biologically relevant interactions, such as protein corona formation or receptor binding. This integrated approach is vital for de-risking drug development pipelines.
Application Notes: The SPR Advantage for Nanoparticle Characterization
SPR is a surface-sensitive optical technique that detects changes in the refractive index at a metal (typically gold)-dielectric interface. When nanoparticles bind to or interact with a functionalized sensor surface, they cause a measurable shift in the resonance angle or wavelength (response units, RU). This signal is exquisitely sensitive to the mass, size, and conformation of the bound analyte.
Key Measurable Parameters via SPR:
- Size & Hydrodynamic Radius: The binding response magnitude (RU) correlates with the mass of bound material. By using a surface calibrated with standards of known size/mass, the SPR signal from nanoparticle binding can be used to estimate size and validate DLS/NTA data in a surface-binding context.
- Concentration: SPR binding kinetics (association/dissociation rates) and steady-state binding levels can be used to calculate the active concentration of nanoparticles in solution, differentiating it from total particle count by measuring only those competent for binding.
- Surface Charge (Zeta Potential) & Functionalization: While not a direct electrical measurement, SPR sensitively detects the adsorption of charged species. Monitoring the formation of a protein corona (from serum) in real-time provides a functional readout of surface charge and stability, as highly charged particles will rapidly adsorb proteins.
Comparative Data of Characterization Techniques
Table 1: Comparison of Key Techniques for Nanoparticle Characterization
| Parameter | SPR | DLS | NTA | Zeta Potential Analyzer |
|---|---|---|---|---|
| Primary Size Measure | Bound layer thickness, correlated mass | Hydrodynamic diameter (Z-average) | Hydrodynamic diameter (per particle) | Not primary |
| Concentration | Active (binding-competent) concentration | No | Yes (total particle count) | No |
| Surface Charge Info | Indirect, via protein adsorption | No | No | Direct (Zeta Potential, mV) |
| Real-time Biomolecular Interaction | Yes (Key Strength) | No | No | No |
| Sample Throughput | Medium | High | Low | Medium |
| Key Limitation | Requires sensor surface functionalization | Poor for polydisperse samples | Low concentration limits | Requires accurate electrophoretic mobility model |
Table 2: Typical SPR Response Data for Model Nanoparticles (Liposomes, ~100 nm)
| Nanoparticle Type | Surface Coating | Expected RU Shift for Saturation Binding | Apparent KD from Kinetics (nM) | Serum Corona Formation Rate (RU/min) |
|---|---|---|---|---|
| Plain PS Liposome | None (anionic) | 1800 | N/A (non-specific) | 1.8 |
| PEGylated Liposome | PEG-2000 | 950 | N/A (low binding) | 0.2 |
| Targeted Liposome | PEG + Anti-HER2 Fab' | 1200 | 2.5 | 0.5 |
Detailed Experimental Protocols
Protocol 1: SPR-based Determination of Nanoparticle Size and Binding Kinetics
Aim: To determine the hydrodynamic size and ligand-binding affinity of antibody-conjugated polymeric nanoparticles.
Materials: See "The Scientist's Toolkit" below. Sensor Chip: Carboxymethylated dextran (CM5) chip. Running Buffer: 10 mM HEPES, 150 mM NaCl, 0.005% v/v Surfactant P20, pH 7.4 (HBS-EP+). Procedure:
- Surface Functionalization: Activate the CM5 chip surface with a 1:1 mixture of 0.4 M EDC and 0.1 M NHS for 7 minutes.
- Ligand Immobilization: Dilute the target protein (e.g., recombinant human HER2 extracellular domain) to 20 µg/mL in 10 mM sodium acetate pH 5.0. Inject over the activated surface until the desired immobilization level (~5000 RU) is achieved. Deactivate the surface with 1 M ethanolamine-HCl pH 8.5 for 7 minutes. Use one flow cell as a reference (activated/deactivated only).
- Size Calibration: Inject a series of globular protein standards (e.g., BSA, IgG, thyroglobulin) at known concentrations and molecular weights. Plot the maximum binding response (RU) against the molecular weight to create a calibration curve.
- Nanoparticle Analysis: Dilute anti-HER2 NPs in running buffer. Inject over the functionalized and reference surfaces for 180s (association phase), followed by running buffer for 300s (dissociation phase) at a flow rate of 30 µL/min. Use a series of concentrations (e.g., 0.5, 1, 2, 5, 10 nM in particle concentration).
- Data Analysis: Subtract the reference flow cell signal. Fit the concentration series kinetic data to a 1:1 Langmuir binding model to determine the association (ka) and dissociation (kd) rate constants. Calculate equilibrium dissociation constant KD = kd/ka. Use the maximum response (Rmax) and the calibration curve from step 3 to estimate the apparent molecular weight and, assuming spherical geometry, the hydrodynamic size of the bound nanoparticle.
Protocol 2: Real-time Monitoring of Protein Corona Formation
Aim: To assess the colloidal stability and surface charge characteristics of nanoparticles by monitoring serum protein adsorption. Sensor Chip: Pioneer Chip J (high-capacity, lipophilic). Running Buffer: 1x PBS, pH 7.4. Procedure:
- Nanoparticle Capture: Dilute plain or PEGylated liposomes to 50 µg/mL in PBS. Inject over the lipophilic sensor chip for 10-15 minutes to achieve a stable baseline with ~2000 RU of captured liposomes.
- Baseline Stabilization: Wash with running buffer for at least 10 minutes to establish a stable baseline.
- Corona Formation: Switch the flow to 50% (v/v) fetal bovine serum (FBS) in PBS. Inject or maintain continuous flow over the captured nanoparticles for 15 minutes.
- Dissociation: Switch back to running buffer and monitor for 10 minutes to observe the dissociation of loosely bound proteins.
- Data Analysis: The slope (RU/min) during the initial 2 minutes of serum exposure indicates the rate of protein adsorption, indirectly related to surface charge and hydrophobicity. The total RU increase at the end of the serum injection indicates the total mass of the hard corona formed. Compare slopes and totals for different nanoparticle formulations.
The Scientist's Toolkit
Table 3: Essential Research Reagent Solutions for SPR-based Nanoparticle Characterization
| Item | Function & Relevance |
|---|---|
| CM5 Sensor Chip (Gold) | The workhorse chip with a carboxymethylated dextran matrix for covalent ligand immobilization via amine coupling. |
| Pioneer Chip J | A lipophilic, non-derivatized sensor chip used for capturing lipid nanoparticles or liposomes via hydrophobic interaction. |
| EDC/NHS Crosslinkers | 1-ethyl-3-(3-dimethylaminopropyl)carbodiimide (EDC) and N-hydroxysuccinimide (NHS) are used to activate carboxyl groups on the chip surface for ligand coupling. |
| Ethanolamine-HCl | Used to block remaining activated ester groups on the sensor surface after ligand immobilization. |
| HEPES Buffered Saline with Surfactant (HBS-EP+) | Standard running buffer; the HEPES maintains pH, salt provides ionic strength, and the surfactant (P20) minimizes non-specific binding. |
| Regeneration Solutions | Low pH (e.g., 10 mM Glycine-HCl, pH 2.0), high salt, or mild detergent solutions used to remove bound nanoparticles without damaging the immobilized ligand. |
| Protein Standards (BSA, IgG) | Used to create a calibration curve for correlating SPR response (RU) with molecular weight/size. |
Visualized Workflows and Pathways
SPR Nanoparticle Characterization Workflow
Protocol for SPR Size & Affinity Measurement
Protein Corona Formation and Biological Impact
Within a broader thesis on Surface Plasmon Resonance (SPR) for nanoparticle characterization in biomedicine, understanding the biomolecular corona is paramount. This spontaneously formed layer of proteins and biomolecules on a nanoparticle's surface dictates its biological identity, influencing circulation, targeting, and toxicity. SPR emerges as a critical, label-free tool to quantify corona formation kinetics and affinity in real-time, providing essential data for rational nanomaterial design.
Core Principles & SPR Advantages
SPR measures changes in the refractive index at a sensor surface. When nanoparticles (NPs) are injected over a surface coated with a target protein (or vice-versa), binding events alter the refractive index, producing a sensorgram. This allows for the direct determination of:
- Association Rate Constant (kₐ): How quickly the corona forms.
- Dissociation Rate Constant (k d): How stable the corona is.
- Equilibrium Dissociation Constant (K D): The overall binding affinity.
Application Notes: Critical Data & Interpretation
The following table summarizes key quantitative parameters obtainable from SPR studies of protein-nanoparticle interactions, essential for biomedical thesis work.
Table 1: Quantitative SPR-Derived Parameters for Corona Characterization
| Parameter | Definition | Typical Range for NP-Protein Interactions | Biomedical Relevance |
|---|---|---|---|
| Response at Saturation (Rmax) | Maximum binding response signal. | Varies by NP size & density. | Indicates theoretical binding capacity of the NP surface. |
| Association Rate (kₐ, M⁻¹s⁻¹) | Rate constant for complex formation. | 10³ – 10⁶ M⁻¹s⁻¹ | Governs corona formation speed in vivo. |
| Dissociation Rate (k d, s⁻¹) | Rate constant for complex breakdown. | 10⁻¹ – 10⁻⁵ s⁻¹ | Predicts corona stability and "hard" vs. "soft" corona dynamics. |
| Affinity (K D, M) | K D = k d / kₐ. Equilibrium dissociation constant. | µM – nM range. | Overall binding strength; low K D = high-affinity corona proteins. |
| Steady-State Response (Req) | Response level at equilibrium for a given analyte concentration. | Derived from sensorgram. | Used for K D determination and binding isotherm analysis. |
Detailed Experimental Protocol
Protocol: Measuring Human Serum Albumin (HSA) Binding to Poly(lactic-co-glycolic acid) (PLGA) Nanoparticles via SPR
I. Aim: To determine the kinetic rate constants and affinity of HSA, a key corona protein, for engineered PLGA nanoparticles.
II. The Scientist's Toolkit: Essential Research Reagents & Materials
| Item | Function/Description |
|---|---|
| SPR Instrument | (e.g., Biacore, OpenSPR). Core system for label-free, real-time interaction analysis. |
| Carboxylated Sensor Chip | (e.g., CMS chip). Provides a carboxylated dextran matrix for stable ligand immobilization. |
| PLGA Nanoparticles | ~100 nm, carboxyl-terminated. Model polymeric NP for drug delivery. |
| Human Serum Albumin (HSA) | Purified, lyophilized. Major plasma protein, dominant corona component. |
| EDC & NHS | Crosslinkers for activating carboxyl groups on the sensor chip. |
| Ethanolamine HCl | Used to deactivate and block remaining reactive groups after immobilization. |
| HBS-EP+ Buffer | (10 mM HEPES, 150 mM NaCl, 3 mM EDTA, 0.05% v/v Surfactant P20, pH 7.4). Standard running buffer to reduce non-specific binding. |
| Regeneration Solution | (e.g., 10 mM Glycine-HCl, pH 2.0). Gently removes bound analyte without damaging the ligand. |
III. Step-by-Step Methodology:
- Sensor Chip Preparation: Dock a carboxylated sensor chip into the instrument. Prime the system with filtered, degassed HBS-EP+ buffer.
- Ligand Immobilization:
- Activation: Inject a 1:1 mixture of 0.4 M EDC and 0.1 M NHS for 7 minutes to activate the chip's carboxyl groups.
- Coupling: Dilute PLGA NPs to 50 µg/mL in 10 mM sodium acetate buffer (pH 5.0). Inject over the activated surface for 10 minutes. Aim for a final immobilization level of ~500-1000 Response Units (RU).
- Blocking: Inject 1 M ethanolamine-HCl (pH 8.5) for 7 minutes to block unreacted sites. A reference flow cell is activated and blocked without NP coupling for background subtraction.
- Analyte Binding Kinetics:
- Prepare a dilution series of HSA (e.g., 0, 3.125, 6.25, 12.5, 25, 50 nM) in HBS-EP+ buffer.
- Set instrument temperature to 25°C.
- Inject each HSA concentration over both the NP and reference surfaces for 3 minutes (association phase) at a flow rate of 30 µL/min.
- Monitor dissociation in buffer for 5-10 minutes.
- Surface Regeneration: After each cycle, inject a 30-second pulse of 10 mM Glycine-HCl (pH 2.0) to remove all bound HSA, regenerating the NP surface for the next analyte injection.
- Data Analysis:
- Subtract the reference flow cell sensorgram from the NP flow cell sensorgram.
- Fit the double-referenced data to a 1:1 Langmuir binding model using the instrument’s software (e.g., Biacore Evaluation Software) to extract kₐ, k d, and K D.
Visualization of Key Concepts
SPR Quantifies Corona Formation Impact
SPR Workflow for Corona Kinetics
Within a thesis focusing on Surface Plasmon Resonance (SPR) for nanoparticle characterization in biomedicine, understanding the evolution from traditional to modern platforms is critical. Traditional SPR measures bulk refractive index changes via propagating surface plasmons on thin metal films (e.g., ~50 nm gold). In contrast, modern Localized SPR (LSPR) utilizes the distinct optical properties of noble metal nanoparticles (e.g., gold nanospheres, nanorods), where conduction electrons oscillate locally upon light interaction. LSPR offers advantages for nanoparticle-biomolecule interaction studies due to its high sensitivity to local dielectric changes, simpler optics, and potential for multiplexing.
Comparative Platform Analysis
Table 1: Core Instrumentation & Performance Parameters
| Feature | Traditional SPR (e.g., Biacore, Reichert) | Modern LSPR Platforms (e.g., Nicoya Lifesciences, Cytiva) & Custom Setups |
|---|---|---|
| Plasmon Type | Propagating Surface Plasmon Polariton (SPP) | Localized Surface Plasmon Resonance (LSPR) |
| Sensor Surface | Continuous thin metal film (~50 nm Au) | Discrete metallic nanoparticles (Au/Ag NPs, ~10-100 nm) |
| Detection Method | Angle, wavelength, or intensity interrogation of reflected light | Extinction/Scattering peak shift (λmax) monitoring |
| Sensitivity (Refractive Index) | High (~10-6 - 10-7 RIU) | Very High for local changes (~10-3 - 10-4 RIU/nm) |
| Penetration Depth | ~200-300 nm | ~6-30 nm (highly localized to nanoparticle surface) |
| Instrument Footprint | Large, complex optics (prism, flow cells) | Can be compact; microplate readers or simple spectrophotometers |
| Multiplexing Potential | Moderate (imaging SPR) | High (spectral or spatial encoding of different NP shapes/sizes) |
| Primary Application in NP Characterization | Coating density, conformation of proteins on NP surface | Real-time ligand binding, aggregation, stability in complex media |
Table 2: Suitability for Biomedical Nanoparticle Research
| Assay Type | Traditional SPR Recommendation | Modern LSPR Recommendation |
|---|---|---|
| Binding Kinetics (ka/kd) | Excellent for high-precision, label-free kinetics on planar surfaces. | Suitable, especially for kinetics on curved NP surfaces; may require careful referencing. |
| Small Molecule Screening | Excellent with high-sensitivity chips. | Good, enhanced by local field intensity. |
| Cell Membrane Interaction | Good with specialized sensor chips. | Excellent due to shallow penetration; ideal for studying NP-cell membrane interactions. |
| Aggregation State Analysis | Indirect via bulk RI changes. | Direct and sensitive via plasmon band broadening & shift. |
| In-situ Serum Stability | Challenging due to nonspecific binding on large surface. | Better potential with functionalized NPs and short decay length reducing bulk interference. |
Detailed Experimental Protocols
Protocol 1: Traditional SPR for Nanoparticle Protein Corona Analysis
Objective: To measure the binding kinetics and affinity of human serum albumin (HSA) to PEGylated gold nanoparticles immobilized on a CMS sensor chip.
Materials: Biacore T200/8K system, CMS sensor chip, HBS-EP+ buffer (10 mM HEPES, 150 mM NaCl, 3 mM EDTA, 0.05% v/v Surfactant P20, pH 7.4), 1-ethyl-3-(3-dimethylaminopropyl)carbodiimide (EDC), N-hydroxysuccinimide (NHS), ethanolamine-HCl, PEGylated Au NPs (50 nm), HSA solution series (0.5, 1, 2, 4, 8 μM).
Procedure:
- System Preparation: Dock CMS chip, prime system with HBS-EP+ buffer.
- NP Immobilization: a. Inject a 1:1 mixture of 0.4 M EDC and 0.1 M NHS for 420 sec to activate carboxyl groups. b. Dilute PEGylated Au NPs in 10 mM sodium acetate (pH 5.0) to 50 μg/mL. Inject for 600 sec (~5000 RU response target). c. Inject 1 M ethanolamine-HCl (pH 8.5) for 420 sec to deactivate remaining esters.
- Binding Kinetics: a. Set flow rate to 30 μL/min. b. Inject HSA samples in series (from lowest to highest concentration) for 180 sec (association), followed by buffer for 300 sec (dissociation). c. Regenerate surface with a 30-sec pulse of 10 mM glycine-HCl (pH 2.0).
- Data Analysis: Double-reference sensorgrams (reference flow cell & zero-concentration). Fit data to a 1:1 Langmuir binding model using evaluation software.
Protocol 2: LSPR-based Drug Release Monitoring from Nanoparticles
Objective: To monitor the real-time release of a chemotherapeutic drug (e.g., Doxorubicin) from DNA-capped gold nanoparticles via LSPR spectral shift.
Materials: UV-Vis spectrophotometer with flow cell or plate reader, gold nanorods (λmax ~750 nm), doxorubicin-loaded DNA-capped AuNRs, phosphate-citrate buffer (pH 5.0, mimicking endosome), PBS (pH 7.4).
Procedure:
- Baseline Acquisition: Place drug-loaded AuNRs in a quartz cuvette or 96-well plate. Record baseline extinction spectrum from 500-900 nm in PBS, pH 7.4.
- Release Initiation: Rapidly exchange buffer to phosphate-citrate, pH 5.0, to trigger acidic release of doxorubicin from DNA caps. Maintain constant temperature (37°C).
- Kinetic Monitoring: Continuously monitor the LSPR peak position (λmax) every 10 seconds for 60 minutes.
- Data Processing: Plot Δλmax (shift from baseline) vs. time. The release curve can be fit to a first-order kinetic model. Correlate spectral shift to released drug concentration using a pre-established calibration curve.
Visualizations
Title: Traditional SPR Experimental Workflow
Title: LSPR Signal Generation Mechanism
Title: SPR Platform Selection for NP Research
The Scientist's Toolkit: Key Research Reagent Solutions
| Item | Function in SPR/LSPR for NP Characterization |
|---|---|
| Carboxymethylated Dextran (CM5) Sensor Chip | Gold surface with a hydrogel layer for covalent immobilization of nanoparticles via amine coupling. |
| HBS-EP+ Buffer | Standard running buffer provides ionic strength and pH stability, while surfactant minimizes nonspecific binding. |
| EDC/NHS Crosslinkers | Activates carboxyl groups on sensor surfaces for covalent attachment of amine-containing ligands or nanoparticles. |
| Gold Nanoparticles & Nanorods | Core plasmonic materials. Shape and size dictate LSPR wavelength; surface chemistry dictates biofunctionality. |
| PEG-Thiols | Used to create anti-fouling monolayers on Au surfaces or NPs to reduce nonspecific protein adsorption. |
| Regeneration Solutions (e.g., Glycine-HCl pH 2.0-3.0) | Gently removes bound analyte without damaging the immobilized nanoparticle layer for sensor surface reuse. |
| Microfluidic Flow Cells | Enable precise sample delivery and kinetics measurement in traditional SPR; also used in some LSPR systems. |
| 96-well Plate with Optical Bottom | Standard format for high-throughput LSPR measurements in plate reader-based systems. |
Surface Plasmon Resonance (SPR) has become a pivotal tool for characterizing nanoparticles (NPs) in biomedicine, enabling label-free, real-time analysis of size, concentration, and biomolecular interactions. The core thesis of this broader work posits that the accuracy and reproducibility of SPR-based nanoparticle characterization are fundamentally dictated by the quality and reproducibility of the nanoparticle immobilization on the sensor chip surface. Inconsistent or non-specific immobilization leads to artifacts, unreliable kinetics, and poor quantification. This Application Note details the essential surface chemistry protocols to create a stable, functional, and reproducible foundation for nanoparticle tethering, a critical pre-requisite for subsequent SPR analysis of NP-drug loading, targeting ligand density, and protein corona formation.
Foundational Surface Chemistry Principles & Quantitative Data
Effective immobilization requires a surface that provides: 1) Covalent attachment points, 2) Appropriate surface density, 3) Resistance to non-specific binding, and 4) Correct orientation for subsequent binding studies. The choice of chemistry depends on the nanoparticle's surface functional groups.
Table 1: Common Nanoparticle Surface Functional Groups & Corresponding Immobilization Chemistries
| NP Surface Group | Target Sensor Chemistry | Reaction Type | Typical Coupling Buffer | Reaction Time | Stability of Bond |
|---|---|---|---|---|---|
| Amine (-NH₂) | Carboxylate (-COOH) | EDC/NHS Amidation | 10 mM MES, pH 5.0-6.0 | 15-60 min | Very High (Covalent Amide) |
| Carboxylate (-COOH) | Amine (-NH₂) | EDC/NHS Amidation | 10 mM MES, pH 5.0-6.0 | 15-60 min | Very High (Covalent Amide) |
| Thiol (-SH) | Maleimide | Michael Addition | PBS, pH 7.0-7.4 (no thiols) | 30-120 min | High (Thioether) |
| Aldehyde (-CHO) | Hydrazide (-CONHNH₂) | Hydrazone Formation | 100 mM Acetate, pH 4.5-5.5 | 60-120 min | Medium-High |
| Biotin | Streptavidin | Affinity | PBS, pH 7.4 | 5-15 min | High (Non-covalent) |
| Histidine-tag | NTA-Ni²⁺ | Coordinate Covalent | PBS, pH 7.4 | 10-30 min | Medium (Chelation) |
Table 2: Comparison of Sensor Chip Surfaces for NP Immobilization
| Chip Type/Coating | Immobilization Chemistry | Best For NP Type | Non-specific Binding (NSB) | Relative Cost | Key Advantage |
|---|---|---|---|---|---|
| Carboxymethylated Dextran (CM5) | EDC/NHS to amines/carboxyls | Polymeric, Liposomes, SiO₂ NPs | Low (with blocking) | $$ | High capacity, well-established |
| Carboxylated Flat Surface (C1) | EDC/NHS to amines/carboxyls | Large NPs (>100nm), Viruses | Very Low | $ | Minimal steric hindrance |
| Streptavidin (SA) | Biotin-Avidin affinity | Any biotinylated NP | Low | $$$ | Oriented, stable capture |
| Gold (Au) bare | Thiol-gold chemisorption | Au NPs, thiolated NPs | High | $ | Simple, direct for Au NPs |
| NTA | His-tag chelation | Engineered His-tagged NPs | Low | $$ | Reversible, oriented |
Detailed Experimental Protocols
Protocol 3.1: Amine-Coupling of Carboxylated Nanoparticles on a CM5 Chip
Objective: Covalently immobilize NPs with surface carboxyl groups via standard EDC/NHS chemistry.
Materials & Reagents:
- SPR sensor chip (e.g., CM5)
- EDC (1-ethyl-3-(3-dimethylaminopropyl)carbodiimide)
- NHS (N-hydroxysuccinimide)
- Ethanolamine HCl, pH 8.5
- Running Buffer: HBS-EP (10 mM HEPES, 150 mM NaCl, 3 mM EDTA, 0.005% v/v Surfactant P20, pH 7.4)
- Nanoparticle Sample: Dialyzed into 10 mM sodium acetate buffer, pH 5.0.
- SPR Instrument with microfluidic system.
Procedure:
- System Prime: Prime the SPR system with running buffer at the recommended flow rate (e.g., 10-30 µL/min).
- Baseline Establishment: Inject running buffer over the target flow cell until a stable baseline is achieved.
- Surface Activation:
- Prepare a fresh mixture of 0.4 M EDC and 0.1 M NHS in water.
- Inject the EDC/NHS mixture for 7 minutes.
- Nanoparticle Immobilization:
- Immediately after activation, inject the nanoparticle solution (in 10 mM acetate buffer, pH 5.0) for a defined period (e.g., 5-15 minutes). Monitor the response units (RU) increase.
- Note: Dilute NP stock to achieve a slow immobilization rate (~10-50 RU/sec) for a uniform layer.
- Surface Deactivation:
- Inject 1 M ethanolamine-HCl (pH 8.5) for 7 minutes to block unreacted NHS esters.
- Stabilization: Wash with running buffer for at least 10-15 minutes until a stable baseline is achieved. The immobilized NP surface is now ready for characterization experiments (e.g., protein binding).
Protocol 3.2: Capture of Biotinylated Nanoparticles on a Streptavidin (SA) Chip
Objective: Use high-affinity biotin-streptavidin interaction for oriented, stable capture of NPs.
Procedure:
- Baseline & Conditioning: Prime system with HBS-EP buffer. Perform two 1-minute injections of 50 mM NaOH to condition the SA chip surface.
- Nanoparticle Capture:
- Dilute the biotinylated nanoparticle sample in HBS-EP buffer.
- Inject the sample for 3-5 minutes at a low flow rate (e.g., 10 µL/min). The high affinity ensures rapid capture.
- Monitor RU. The capture level can be precisely controlled by injection time and concentration.
- Surface Blocking (Optional but Recommended):
- Inject a 50-100 µg/mL solution of free biotin in HBS-EP for 1 minute to block any unoccupied streptavidin sites, minimizing non-specific binding in later steps.
- Stabilization: Wash with running buffer for 5-10 minutes to establish a stable baseline. The chip is now ready for analyte injection.
The Scientist's Toolkit: Key Research Reagent Solutions
Table 3: Essential Materials for Surface Functionalization
| Item/Reagent | Function & Role in Immobilization | Example Product/Chemical |
|---|---|---|
| EDC & NHS | Crosslinker system for activating carboxyl groups to form reactive esters for amine coupling. | Thermo Fisher #PG82079 |
| Sulfo-NHS | Water-soluble version of NHS for reactions in aqueous buffers without organic solvents. | Sigma-Aldrich #56485 |
| Ethanolamine-HCl | Blocks residual activated ester groups post-immobilization to prevent unwanted coupling. | Sigma-Aldrich #E9508 |
| HBS-EP Buffer | Standard running buffer for SPR; provides ionic strength, pH control, and surfactant to reduce NSB. | Cytiva #BR100669 |
| PEG-based Blockers | Used to pre-treat surfaces or as additives to create anti-fouling, low NSB surfaces. | e.g., mPEG-Thiol (Sigma #672147) |
| Regeneration Solutions | Breaks specific interactions during capture methods (e.g., for NTA or antibody chips). | 10 mM Glycine-HCl, pH 2.0-3.0; 350 mM EDTA for NTA |
| Surfactant P20 | Non-ionic detergent in running buffers to minimize bulk and surface NSB. | Cytiva #BR100054 |
Visualization of Workflows & Concepts
Title: Workflow for SPR Nanoparticle Immobilization
Title: Amine Coupling Chemistry on a Dextran Chip
SPR in Action: Step-by-Step Protocols for Nanoparticle Functionalization and Binding Studies
Within a broader thesis on Surface Plasmon Resonance (SPR) for nanoparticle characterization in biomedicine, immobilization strategy selection is paramount. SPR analysis of functionalized nanoparticles (e.g., liposomes, polymeric NPs, inorganic carriers) for drug targeting, biodistribution, and ligand-receptor kinetics requires a stable, reproducible, and biologically relevant sensor surface. This application note details two core strategies—direct adsorption and covalent coupling—for immobilizing nanoparticles or their biomolecular ligands onto SPR chips, providing protocols and comparative data to guide research in drug development.
Comparative Analysis of Immobilization Strategies
Table 1: Strategic Comparison of Immobilization Methods
| Parameter | Direct Adsorption | Covalent Coupling (via Amine Chemistry) |
|---|---|---|
| Principle | Non-specific, physical interaction (hydrophobic, electrostatic) | Specific, covalent bond formation between surface groups and chip matrix |
| Immobilization Speed | Fast (5-30 mins) | Slower (30-120 mins for full procedure) |
| Required Surface Chemistry | Plain gold, hydrophobic (HPA) or short carboxylate (CM4) chips | Chips pre-functionalized with carboxyl groups (CM5, CMS) |
| Required Nanoparticle/Ligand Modification | None typically required | Requires accessible primary amines (-NH₂) |
| Binding Strength & Stability | Moderate to low; susceptible to desorption and buffer exchange | High; resistant to desorption, stringent washes, and regeneration |
| Orientation Control | None; random orientation | Low to moderate (depends on amine distribution) |
| Typical Application in NP Characterization | Screening interactions, crude affinity estimates, studying adsorption kinetics | Quantitative kinetics (ka, kd, KD), stability assays, reusable surfaces |
| Regeneration Potential | Low; often irreversibly denatures adsorbed layer | High; ligand layer remains intact; analyte can be regenerated |
Table 2: Quantitative Performance Metrics (Representative Data)
| Metric | Direct Adsorption (Liposome on HPA chip) | Covalent Coupling (Antibody on CMS chip) |
|---|---|---|
| Immobilization Response (RU) | High variability (5000 ± 1500 RU) | High reproducibility (12000 ± 500 RU) |
| Non-Specific Binding | High (>10% of signal) | Low (<2% of signal) |
| Stability (Signal loss over 1 hour buffer flow) | 15-25% | <5% |
| Assay Reusability (Cycles) | 1-3 | 10-20 |
| Typical Kinetic Rate Constants Measurable | Association (kₐ) only, or apparent affinity | Accurate kₐ, kd, and KD |
Detailed Experimental Protocols
Protocol 1: Direct Adsorption of Liposomes onto an HPA Chip (Hydrophobic Capture)
Objective: Immobilize intact liposomes for studying protein-membrane interactions. Workflow:
- Chip Preparation: Dock a Hydrophobic (HPA) sensor chip. Prime the SPR system with running buffer (e.g., HEPES Buffered Saline, HBS).
- Baseline: Flow running buffer at 10 µL/min until a stable baseline is established.
- Liposome Preparation: Prepare liposomes in running buffer. Sonicate briefly to avoid aggregation. Final lipid concentration ~0.5-1 mM.
- Immobilization: Inject the liposome suspension over the sensor surface for 5-10 minutes at 2-5 µL/min.
- Stabilization: Flow running buffer for 10-15 minutes to wash away loosely adsorbed vesicles and stabilize the signal. A stable, elevated response indicates a formed lipid bilayer/multilayer.
- Ready for Analysis: The surface is now ready for analyte injection (e.g., peptides, membrane proteins).
Protocol 2: Covalent Coupling of Amine-Modified Nanoparticles via EDC/NHS Chemistry
Objective: Create a stable, covalent surface for kinetic analysis of nanoparticle-target binding. Workflow:
- Chip & System Preparation: Dock a carboxylated sensor chip (CM5). Prime with activation buffer (e.g., 0.1 M MES, pH 5.0).
- Activation: Mix equal volumes of 0.4 M EDC and 0.1 M NHS. Inject the mixture for 7 minutes at 10 µL/min to activate carboxyl groups to reactive NHS esters.
- Ligand/NP Immobilization: Dilute the amine-bearing nanoparticle (or targeting ligand) in coupling buffer (e.g., sodium acetate, pH 4.5-5.5). Inject immediately for 15-30 minutes at 5 µL/min.
- Deactivation: Inject 1 M ethanolamine-HCl (pH 8.5) for 7 minutes to block remaining activated esters.
- Washing: Perform 2-3 short injections of regeneration buffer (e.g., 10 mM glycine, pH 2.0) to remove non-covalently bound material.
- Conditioning: Re-equilibrate with running buffer. The surface is ready for kinetic analysis with analyte.
Visualizations
Diagram Title: SPR Immobilization Strategy Decision Tree
Diagram Title: Covalent Coupling Four-Step Workflow
The Scientist's Toolkit: Research Reagent Solutions
Table 3: Essential Materials for SPR Immobilization
| Item | Function in Experiment |
|---|---|
| CM5 Sensor Chip (Dextran matrix, carboxylated) | Gold sensor chip with a hydrophilic carboxymethylated dextran layer for covalent coupling via amine, thiol, or other chemistries. |
| HPA Sensor Chip (Hydrophobic surface) | Sensor chip with alkane thiol monolayer for capturing lipid vesicles or very hydrophobic molecules via direct adsorption. |
| EDC (1-Ethyl-3-(3-dimethylaminopropyl)carbodiimide) | Zero-length crosslinker; activates carboxyl groups to reactive O-acylisourea intermediates for amine coupling. |
| NHS (N-Hydroxysuccinimide) | Stabilizes the EDC-activated esters, forming an NHS ester that is more stable and reactive towards amines. |
| 1 M Ethanolamine-HCl, pH 8.5 | Blocks remaining NHS esters after coupling, deactivating the surface to prevent non-specific binding. |
| Running Buffer (e.g., HBS-EP+: 10 mM HEPES, 150 mM NaCl, 3 mM EDTA, 0.05% P20, pH 7.4) | Provides a consistent, biocompatible ionic and pH environment for biomolecular interactions, with surfactant to minimize non-specific binding. |
| Coupling Buffer (e.g., 10 mM Sodium Acetate, pH 4.0-5.5) | Low pH buffer optimizes ligand/NP surface charge (positive) for efficient coupling to negatively charged activated dextran. |
| Regeneration Solutions (e.g., 10 mM Glycine-HCl, pH 2.0/2.5) | Mild acidic or basic buffers used to dissociate bound analyte from the immobilized ligand without damaging the ligand layer. |
Within the broader thesis on employing Surface Plasmon Resonance (SPR) for comprehensive nanoparticle characterization in biomedicine, quantifying the presentation of targeting ligands (e.g., antibodies, peptides, aptamers) on nanoparticle (NP) surfaces is critical. Ligand density and orientation directly influence binding avidity, cellular uptake specificity, and therapeutic efficacy. This protocol details a combined SPR-based methodology to determine these crucial parameters.
The following table summarizes key quantitative parameters and methods used in ligand density and orientation analysis.
Table 1: Key Parameters & Analytical Methods for Ligand Characterization on NPs
| Parameter | Typical Target Range | Primary Analytical Method | Key Output |
|---|---|---|---|
| Ligand Density | 2-50 ligands/100 nm² (varies by ligand/NP) | SPR Competitive Inhibition / Back-Calculation | Number of functional ligands per nanoparticle |
| Functional Fraction | 60-95% (ideal >80%) | SPR Binding Kinetics vs. Standard | Percentage of ligands in active, target-binding orientation |
| Apparent Affinity (KD) | nM - µM range (depends on system) | Direct SPR Binding Assay | Overall nanoparticle avidity (multivalent) |
| Conjugation Efficiency | - | Spectrophotometry / BCA Assay | Total ligand conjugated (functional + non-functional) |
Experimental Protocols
Protocol 1: SPR-Based Competitive Inhibition for Total Ligand Density
Objective: To determine the total number of targeting ligands conjugated per nanoparticle, irrespective of orientation. Principle: Native, soluble receptors (or target proteins) are immobilized on the SPR chip. A known concentration of nanoparticles is pre-mixed with a known concentration of free ligand, then injected. The inhibition of NP binding signal is used to back-calculate ligand number.
Procedure:
- Surface Preparation: Immobilize the purified target protein onto a CMS sensor chip via standard amine coupling to achieve ~5000 RU.
- Ligand Solution Preparation: Prepare a serial dilution of the free, unconjugated targeting ligand (e.g., 0 nM, 10 nM, 50 nM, 100 nM, 500 nM) in running buffer (e.g., PBS + 0.05% Tween 20, pH 7.4).
- NP-Ligand Incubation: For each free ligand concentration, mix a constant, known concentration of ligand-conjugated NPs (e.g., 1 nM NP stock) 1:1 (v/v) and incubate for 30 min at 25°C to reach equilibrium.
- SPR Analysis: Inject each NP/ligand mixture over the target protein surface at a flow rate of 30 µL/min for 180s, followed by dissociation. Regenerate the surface with a mild glycine pH 2.5 pulse (30s).
- Data Analysis: Plot the maximum binding response (RU) of the NP mixture vs. the concentration of free inhibitor ligand. Fit the data to a one-site competitive binding model. The concentration of free ligand that inhibits 50% of NP binding ([I]₅₀) relates to the ligand density. Use the formula: Ligands/NP = ([NP]ₜ × Valency) / [I]₅₀, where Valency is obtained from fitting and [NP]ₜ is the total nanoparticle molar concentration.
Protocol 2: Assessing Functional Ligand Orientation via Direct Binding Kinetics
Objective: To determine the fraction of conjugated ligands that are functionally active and correctly oriented for target binding. Principle: Compare the binding response of ligand-conjugated NPs to that of a standardized surface with known, optimally oriented ligand. The ratio of binding rates or capacities yields the functional fraction.
Procedure:
- Reference Surface Creation: Create two surfaces on the same sensor chip:
- Channel 1 (NP Capture Surface): Immobilize a capture antibody specific to the Fc region of your targeting antibody (if using mAbs). This ensures consistent, oriented presentation of the free ligand control.
- Channel 2 (Target Surface): Immobilize the target protein (as in Protocol 1).
- Calibration with Free Ligand: Inject a known concentration of free, purified targeting ligand over Channel 1. The capture antibody will bind and orient it. Immediately after capture, flow the solution over Channel 2 to measure the binding rate (RU/s) to the target. This establishes the response for a 100% functional, oriented ligand.
- NP Binding Analysis: Inject the ligand-conjugated NP sample directly over Channel 2 (target surface). Measure the initial binding rate (slope, RU/s) at a fixed NP concentration.
- Calculation: The Functional Fraction (%) = (SlopeNP / SlopeFreeLigand) × 100%, where slopes are compared at concentrations normalized for ligand molarity (derived from Protocol 1). This estimates the percentage of ligands on the NP that are as active as the optimally oriented control.
The Scientist's Toolkit: Research Reagent Solutions
Table 2: Essential Materials for SPR-Based NP-Ligand Characterization
| Item | Function & Importance |
|---|---|
| Biacore Series S CMS Sensor Chip | Gold sensor surface with carboxymethylated dextran matrix for stable protein immobilization via amine coupling. |
| HBS-EP+ Buffer (10x) | Standard SPR running buffer (10 mM HEPES, 150 mM NaCl, 3 mM EDTA, 0.05% v/v Surfactant P20); provides consistent pH and ionic strength, minimizes non-specific binding. |
| Amine Coupling Kit (NHS/EDC) | Contains 1-ethyl-3-(3-dimethylaminopropyl)carbodiimide (EDC) and N-hydroxysuccinimide (NHS) for activating carboxyl groups on the chip surface to immobilize proteins. |
| Regeneration Solution (Glycine-HCl, pH 2.0-2.5) | Mild acidic buffer to dissociate bound nanoparticles/ligands from the target protein without damaging the immobilized surface, allowing for repeated chip use. |
| Purified Target Protein (>95% purity) | High-purity protein is essential for a clean, specific immobilization and to avoid artifacts in binding kinetics from contaminants. |
| Free Targeting Ligand (Pure Standard) | Critical for generating the standard curve in competitive inhibition (Proto. 1) and as an oriented control in the functional assay (Proto. 2). |
Visualization of Workflows
Diagram 1: Integrated SPR Protocol Workflow (96 chars)
Diagram 2: Competitive Inhibition Assay Principle (94 chars)
This application note details the use of Surface Plasmon Resonance (SPR) for characterizing critical interactions in nanocarrier development. It is framed within a broader thesis on SPR's indispensable role in providing real-time, label-free quantification of nanoparticle (NP) interactions with biological targets, thereby de-risking and accelerating biomedical translation.
Quantifying Targeting Ligand Affinity and Orientation
A critical step is the functionalization of NPs with targeting ligands (e.g., antibodies, peptides). SPR directly measures the binding kinetics of these ligands to their immobilized receptors, informing conjugation strategies.
Protocol 1.1: Kinetic Analysis of a Peptide Ligand Binding to a Target Protein
- Chip Preparation: A Series S Sensor Chip CM5 is docked. Using HBS-EP+ (10 mM HEPES, 150 mM NaCl, 3 mM EDTA, 0.05% v/v Surfactant P20, pH 7.4) as running buffer, the target protein (e.g., recombinant human transferrin receptor) is amine-coupled to flow cell 2 (FC2) to ~5000 Response Units (RU). Flow cell 1 (FC1) is activated and blocked for use as a reference.
- Ligand Analysis: Serial dilutions of the synthetic peptide (0.78 nM – 100 nM) are prepared in running buffer. Samples are injected over FC1 and FC2 at 30 µL/min for 180s (association), followed by dissociation for 600s. The surface is regenerated with a 30s pulse of 10 mM Glycine-HCl, pH 2.0.
- Data Processing: Reference-subtracted (FC2-FC1) sensorgrams are fit to a 1:1 Langmuir binding model using the SPR evaluation software to extract ka (association rate constant), kd (dissociation rate constant), and KD (equilibrium dissociation constant, KD = kd/ka).
Table 1: Representative SPR Kinetic Data for Targeting Ligands
| Ligand | Target Protein | ka (1/Ms) | kd (1/s) | KD (nM) | Conjugation Chemistry Used on NP |
|---|---|---|---|---|---|
| cRGDfK peptide | αvβ3 Integrin | 1.2 x 10⁵ | 8.5 x 10⁻³ | 70.8 | Maleimide-thiol to PEG terminus |
| Anti-HER2 Fab' | HER2 ECD | 3.8 x 10⁵ | 2.1 x 10⁻⁴ | 0.55 | Maleimide-thiol to reduced hinge |
| Transferrin | Transferrin Receptor | 2.5 x 10⁵ | 1.0 x 10⁻³ | 4.0 | NHS-amine to phospholipid-PEG |
SPR Ligand Kinetics Assay Workflow
Analyzing Serum Protein Adsorption (Corona Formation)
SPR is ideal for studying the dynamic formation of the protein corona, which dictates NP biological fate. NPs are captured on the sensor surface, and serum is flowed over.
Protocol 2.1: Real-Time Corona Formation Analysis
- NP Capture: A Sensor Chip SA (streptavidin) is used. Biotinylated bovine serum albumin (biotin-BSA) is immobilized as a passivating base layer. Biotinylated liposomes (~100 nm) are captured on FC2 to a density of ~2000 RU. A bare biotin-BSA surface on FC1 serves as reference.
- Serum Exposure: Human serum, diluted 10% in PBS, is injected over FC1 and FC2 at a flow rate of 10 µL/min for 600s, followed by buffer wash for 900s to monitor hard corona stability.
- Data Analysis: The reference-subtracted binding response (RU) at the end of the dissociation phase quantifies the stable "hard corona." Competition experiments with soluble ligands can identify specific protein interactions.
Table 2: SPR Analysis of Protein Corona on Various Nanocarriers
| Nanocarrier Type | Surface Coating | ΔRU (Hard Corona) from 10% Serum | Key Identified Corona Proteins (by MS) |
|---|---|---|---|
| PEGylated Liposome | DSPE-PEG2000 | 120 ± 15 | ApoA-I, ApoE, Albumin |
| Cationic Liposome | DOTAP/Cholesterol | 580 ± 45 | Albumin, Fibrinogen, Complement C3 |
| PLGA Nanoparticle | Poloxamer 188 | 210 ± 30 | Albumin, ApoA-IV, IgG |
| Polymer Micelle | PLA-PEG | 95 ± 10 | Albumin, ApoJ |
Measuring Binding to Cellular Receptors under Flow
SPR can mimic cell-NP interactions by immobilizing cell membrane fragments or whole receptors.
Protocol 3.1: Binding of Targeted NPs to Immobilized Receptor
- Surface Preparation: Anti-Fc antibody is coupled to a CM5 chip. Recombinant human Fe-fusion target receptor (e.g., EGFR-Fc) is captured on FC2. An isotype control Fc protein is captured on FC1.
- NP Binding Assessment: Purified liposome formulations (0.01-1 mg/mL lipid concentration) are injected in PBS + 0.05% Tween 20 at 20 µL/min for 300s, followed by dissociation.
- Analysis: The maximum response (Rmax) and apparent off-rate provide insights into avidity (multivalent binding). Specific binding is confirmed by minimal signal on the reference flow cell.
Key NP Interactions Measured by SPR
The Scientist's Toolkit: Key Research Reagent Solutions
| Item | Function in SPR-based Characterization |
|---|---|
| Sensor Chips (CM5, SA, L1) | CM5: Gold surface with carboxymethyl dextran for covalent coupling. SA: Pre-immobilized streptavidin for capturing biotinylated ligands. L1: Hydrophobic surface for capturing lipid membranes or intact vesicles. |
| HBS-EP+ Buffer | Standard running buffer for most experiments. Provides constant pH and ionic strength; contains a surfactant to minimize non-specific binding. |
| Amine Coupling Kit | Contains N-hydroxysuccinimide (NHS) and N-ethyl-N'-(3-diethylaminopropyl)carbodiimide (EDC) for activating carboxyl groups on CM5 chips to covalently immobilize proteins via primary amines. |
| Regeneration Solutions | Low pH (e.g., Glycine-HCl, pH 2.0-3.0), high salt, or mild detergent solutions used to break the ligand-analyte complex without damaging the immobilized ligand, allowing surface re-use. |
| Biotinylated Capture Agents | Biotinylated lipids (for NP capture) or biotinylated antibodies/Fc-fusion proteins. Enable oriented and controlled immobilization on SA chips. |
| Kinetic Analysis Software | (e.g., Biacore Evaluation Software, TraceDrawer). Used to fit sensogram data to binding models, extracting rate and affinity constants. |
Within the broader thesis on the application of Surface Plasmon Resonance (SPR) for nanoparticle characterization in biomedicine, this case study focuses on a critical advancement: antibody-conjugated nanoparticles (ACNPs) for targeted cancer therapy. SPR is indispensable for quantifying conjugation efficiency, binding kinetics, and targeting specificity, which directly correlate with therapeutic efficacy and safety profiles. This document provides detailed application notes and protocols for the SPR-based characterization of ACNPs, enabling researchers to optimize and validate their targeted delivery systems.
Application Notes
Role of SPR in ACNP Development
SPR biosensing provides real-time, label-free analysis of molecular interactions on nanoparticle surfaces. For ACNPs, key characterization parameters include:
- Conjugation Efficiency: Measures the number of active antibodies per nanoparticle.
- Binding Affinity & Kinetics: Determines the strength (KD) and rates (ka, kd) of the ACNP binding to its target antigen.
- Specificity: Confirms targeted binding over non-specific interactions.
- Stability: Assesses the retention of antibody functionality and nanoparticle integrity over time.
Recent literature (2023-2024) underscores the correlation between SPR-measured parameters and in vitro efficacy.
Table 1: SPR Characterization Data of Model Anti-HER2 ACNPs
| Nanoparticle Core | Antibody | Conjugation Density (Ab/NP) | KD (nM) | ka (1/Ms) | kd (1/s) | In vitro Cellular Uptake Increase (vs. non-targeted) |
|---|---|---|---|---|---|---|
| PLGA-PEG | Trastuzumab | 25 ± 3 | 0.85 ± 0.12 | 2.1e5 ± 0.3e5 | 1.8e-4 ± 0.2e-4 | 12.5-fold |
| Gold Nanosphere | Trastuzumab scFv | 15 ± 2 | 5.2 ± 0.8 | 4.5e4 ± 0.5e4 | 2.3e-3 ± 0.3e-3 | 8.7-fold |
| Liposome | Trastuzumab Fab' | 40 ± 5 | 0.41 ± 0.09 | 5.8e5 ± 0.7e5 | 2.4e-4 ± 0.1e-4 | 15.2-fold |
| Mesoporous Silica | Pertuzumab | 30 ± 4 | 1.3 ± 0.2 | 1.7e5 ± 0.2e5 | 2.2e-4 ± 0.2e-4 | 9.3-fold |
Table 2: Impact of Conjugation Chemistry on SPR-Measured Parameters
| Conjugation Method | Ligand Orientation | Typical KD (nM) | Assay Consistency (CV%) | Key Advantage |
|---|---|---|---|---|
| NHS-EDC Amide Coupling | Random | 1.0 - 10.0 | 10-15% | Simple, fast |
| Maleimide-Thiol (Reduced Ab) | Controlled (via hinge) | 0.5 - 2.0 | 5-8% | Preserves antigen binding |
| Click Chemistry (DBCO-Azide) | Controlled (site-specific) | 0.2 - 1.5 | 3-7% | Excellent orthogonality |
| Protein G/L Mediated Capture | Controlled (Fc-specific) | 0.1 - 0.8 | 2-5% | Maintains native Ab conformation |
Experimental Protocols
Protocol 1: SPR Analysis of Antibody Conjugation Efficiency
Objective: To determine the average number of antibodies conjugated per nanoparticle (NP). Materials: See "The Scientist's Toolkit" below. Method:
- Sensor Chip Functionalization: Immobilize Protein A or G on a CM5 chip using standard NHS/EDC amine coupling to reach ~5000-8000 RU.
- Antibody Capture: Inject a saturating concentration of the pure antibody (e.g., 10 µg/mL) over the Protein surface at 10 µL/min for 60s. Record the capture level (RU_Ab).
- ACNP Binding: Inject a standardized concentration of the purified ACNPs (e.g., 0.1 nM in NP concentration) over both the antibody-loaded and reference flow cells at 30 µL/min for 120s. Record the binding response (RU_ACNP).
- Regeneration: Strip the antibody and ACNPs with a 10s pulse of 10 mM Glycine-HCl, pH 1.5.
- Calculation: Use the formula: Conjugation Density = (RUACNP / RUAb) * (MWAb / MWNP), where MW is molecular weight. Perform in triplicate.
Protocol 2: SPR Analysis of ACNP Binding Kinetics to Immobilized Antigen
Objective: To determine the association (ka) and dissociation (kd) rate constants, and the equilibrium dissociation constant (KD) for the ACNP-antigen interaction. Method:
- Antigen Immobilization: Immobilize the purified target antigen (e.g., recombinant HER2 extracellular domain) on a Series S Sensor Chip CMS via amine coupling to a medium density (~50-100 RU).
- ACNP Sample Series: Prepare a 2-fold dilution series of the ACNPs in running buffer (e.g., HBS-EP+, 1% BSA), typically spanning 0.5 nM to 20 nM (NP concentration).
- Kinetic Injection Series: Inject each ACNP concentration over the antigen and reference surfaces at a flow rate of 50 µL/min for an association phase of 180s, followed by a dissociation phase of 300s in running buffer.
- Data Processing: Double-reference the data (reference flow cell and blank buffer injection). Fit the resulting sensorgrams globally to a 1:1 Langmuir binding model using the SPR instrument's software (e.g., Biacore Evaluation Software).
- Validation: Confirm the model by checking residual plots and chi-squared values.
Visualizations
Title: Workflow for Developing and Characterizing ACNPs
Title: SPR Protocol for Conjugation Efficiency
The Scientist's Toolkit
Table 3: Essential Research Reagent Solutions for SPR Characterization of ACNPs
| Item | Function/Description | Example Product/Catalog # (2024) |
|---|---|---|
| SPR Instrument | Label-free biosensor for real-time interaction analysis. | Cytiva Biacore 8K, Nicoya Lifesciences OpenSPR, Biosensing Instrument SPRm 200. |
| Sensor Chip CMS | Gold surface with carboxymethylated dextran matrix for ligand immobilization. | Cytiva Series S Sensor Chip CMS (BR100530). |
| Protein A or G | Captures antibody via Fc region for controlled orientation in conjugation efficiency assays. | Recombinant Protein G (Thermo Fisher, 21193). |
| Amine Coupling Kit | Contains NHS and EDC for covalent immobilization of proteins via primary amines. | Cytiva Amine Coupling Kit (BR100050). |
| Maleimide-Activated Nanoparticles | For site-specific conjugation to thiol groups on reduced antibodies. | Creative PEGWorks, Maleimide-PEG-NHS. |
| HBS-EP+ Buffer (10x) | Standard SPR running buffer (0.01M HEPES, 0.15M NaCl, 3mM EDTA, 0.05% v/v Surfactant P20, pH 7.4). | Cytiva (BR100669). |
| Regeneration Buffer | Low pH or other solution to dissociate bound analytes without damaging the chip surface. | Glycine-HCl, pH 1.5-2.5 (Sigma, G6511). |
| Analytical Size Exclusion Columns | For critical purification of ACNPs to remove unconjugated antibodies before SPR. | Superose 6 Increase 10/300 GL (Cytiva, 29091596). |
| Particle Concentration/Size Standard | For accurate determination of nanoparticle molar concentration via NTA or DLS. | Malvern Polystyrene Nanosphere Standards (NIST-traceable). |
Optimizing SPR Assays: Solving Common Challenges in Nanoparticle Characterization
Troubleshooting Non-Specific Binding and Surface Fouling
Surface plasmon resonance (SPR) is a cornerstone analytical technique in biomedical research for the real-time, label-free analysis of biomolecular interactions. Within the broader thesis on SPR for nanoparticle (NP) characterization—encompassing drug delivery vector analysis, targeted therapeutic efficacy, and biomarker discovery—the integrity of the sensor surface data is paramount. Nanoparticles, due to their large surface area, complex surface chemistry, and often heterogeneous compositions, present a significant challenge: heightened non-specific binding (NSB) and rapid surface fouling. These artifacts corrupt binding signals, leading to inaccurate kinetic and affinity measurements (ka, kd, KD), thus jeopardizing the validity of conclusions regarding nanoparticle-biomolecule interactions. This document provides targeted application notes and protocols to identify, mitigate, and troubleshoot these critical issues.
NSB occurs when analytes (e.g., proteins, lipids, nanoparticles) adhere to the sensor surface or hydrogel matrix through interactions other than the specific biological interaction of interest. Common culprits include:
- Electrostatic Interactions: Between charged NP surfaces and oppositely charged functional groups on the sensor chip (e.g., carboxylate on CM5 chips).
- Hydrophobic Interactions: Prevalent with polymeric NPs or proteins with hydrophobic patches.
- Van der Waals Forces: Particularly significant for larger entities like nanoparticles.
- Surface Fouling: The non-specific, often irreversible deposition of sample matrix components (e.g., serum proteins, cell lysates) that "clogs" the hydrogel matrix, reducing binding capacity and altering flow dynamics.
Key Experimental Protocols for Troubleshooting
Protocol 3.1: Systematic Assessment of NSB
Objective: To quantify the degree of non-specific binding of your nanoparticle preparation to various sensor surfaces. Materials: SPR instrument, sensor chips (e.g., bare gold, carboxymethylated dextran [CM5], hydrogel-free [C1], streptavidin [SA]), running buffer (e.g., HBS-EP+: 10 mM HEPES, 150 mM NaCl, 3 mM EDTA, 0.05% v/v Surfactant P20, pH 7.4), nanoparticle sample in running buffer. Procedure:
- Dock a series of sensor chips (Gold, CM5, C1).
- Prime the system with running buffer.
- On each chip surface, establish a stable baseline with running buffer for at least 60 seconds.
- Inject nanoparticle sample (at the highest concentration intended for experiments) over all flow cells for 180 seconds at a standard flow rate (e.g., 30 µL/min).
- Monitor the association phase.
- Switch to running buffer injection and monitor dissociation for 300 seconds.
- Regenerate the surface with a series of short pulses (e.g., 10-50 mM NaOH, glycine pH 2.5, 0.1% SDS) until response returns to baseline.
- Data Analysis: The response unit (RU) shift observed on a reference surface (or after specific ligand capture) indicates the level of NSB. Compare across chip types.
Protocol 3.2: Optimization of Running Buffer and Additives
Objective: To identify buffer conditions that minimize NSB while maintaining biological activity. Materials: Running buffers with varying additives. Procedure:
- Prepare a set of running buffers based on HBS-EP+, systematically modifying one component at a time:
- Ionic Strength: Vary NaCl concentration (50-500 mM).
- Surfactant: Vary type (P20, Tween-20) and concentration (0.005%-0.1%).
- Charge Shielders: Add cationic (e.g., 0.1-1 mg/mL CM-Dextran) or anionic polymers.
- Blocking Agents: Add inert proteins (e.g., 0.1% BSA, casein) or commercial blocking reagents.
- Using the chip type showing lowest NSB from Protocol 3.1, repeat the NSB assessment injection for each buffer condition.
- Data Analysis: Identify the condition yielding the lowest stable baseline and minimal RU increase during nanoparticle injection.
Protocol 3.3: Implementation of a High-Quality Reference Surface
Objective: To subtract systemic artifacts and NSB from the specific binding signal. Procedure:
- If using a capture method (e.g., anti-His antibody), immobilize the capture molecule on both the sample and reference flow cells.
- On the reference cell, capture a non-interacting protein or particle of similar size/type to your target ligand (e.g., an isotype control antibody, a non-targeting nanoparticle).
- On the sample cell, capture your specific ligand.
- Ensure the capture level (RU) is matched as closely as possible between reference and sample cells.
- Inject analyte (nanoparticle or interacting partner) simultaneously over both flow cells.
- Data Analysis: The SPR software subtracts the reference sensorgram (containing NSB and bulk shift) from the sample sensorgram, revealing the specific interaction signal.
Table 1: Common NSB/Fouling Artifacts and Diagnostic Solutions
| Artifact Observed | Potential Cause | Diagnostic Experiment | Corrective Action |
|---|---|---|---|
| Steady baseline drift upward | Slow, cumulative fouling of surface | Inject blank running buffer; inject sample matrix. | Increase surfactant concentration; add a blocking agent to buffer; use a hydrogel-free chip (C1). |
| Sharp "spike" upon injection start/stop | Bulk refractive index mismatch | Dilute sample in running buffer; use a more precise desalting method. | Ensure sample and running buffer are identical in composition (dialyze/exchange). |
| High, non-reversible binding on reference surface | Strong NSB to chip matrix | Perform Protocol 3.1 (Chip Scout). | Switch chip type (e.g., to C1); optimize buffer (Protocol 3.2); use a different surface chemistry. |
| Signal increase after regeneration | Incomplete removal of analyte | Test a series of regeneration solutions at different contact times. | Implement a stronger or multi-step regeneration protocol (e.g., NaOH followed by acidic pulse). |
| Reduced binding capacity over cycles | Irreversible fouling or ligand degradation | Monitor ligand activity after multiple regeneration cycles. | Use a more stable ligand capture method; employ a pre-injection of blocking agent; use a higher flow rate to minimize contact time. |
Table 2: Efficacy of Common Buffer Additives Against NSB Mechanisms
| Additive | Typical Concentration Range | Primary Mechanism Against NSB | Best Suited For | Caveats |
|---|---|---|---|---|
| Surfactant P20 / Tween-20 | 0.005% - 0.05% (v/v) | Reduces hydrophobic interactions, coats surface | Most protein/nanoparticle studies in simple buffers. | Can disrupt weak specific interactions; may form micelles at high conc. |
| BSA or Casein | 0.1 - 1.0% (w/v) | Blocks adhesive sites via passive adsorption | Complex matrices (serum, lysate); highly sticky molecules. | May bind the analyte itself; requires careful reference subtraction. |
| CM-Dextran | 0.1 - 1.0 mg/mL | Shields negative charge on dextran chips | Positively charged proteins/nanoparticles. | Can increase viscosity; may not work for all charge-based NSB. |
| Increased Ionic Strength | 150 - 500 mM NaCl | Shields electrostatic interactions | Interactions driven by charge complementarity. | Can weaken specific ionic interactions; may cause protein precipitation. |
| Competitive Inert Analogue | e.g., 1-10 mM His in buffer | Competes for non-specific metal-chelate sites | NSB to NTA chips during His-tagged capture studies. | Must not interfere with the specific capture of the ligand. |
The Scientist's Toolkit: Key Research Reagent Solutions
| Item | Function in Troubleshooting NSB/Fouling |
|---|---|
| Series S Sensor Chip C1 | Hydrogel-free, flat carboxymethylated surface. Reduces steric trapping and fouling common with large nanoparticles. |
| HBS-EP+ Buffer (10x) | Standard running buffer containing the surfactant P20. The baseline starting point for optimization. |
| Surfactant P20 (10% v/v stock) | Non-ionic surfactant to reduce hydrophobic NSB. Critical for maintaining surface cleanliness. |
| BIACORE Regeneration Solution Kits | Pre-formatted, scouted solutions (e.g., acidic, basic, ionic, surfactant) for safe, effective surface regeneration. |
| Carrier Protein (BSA, Fraction V) | A common blocking agent to passivate surfaces against protein adsorption. |
| CMS Sensor Chip | The standard high-capacity dextran hydrogel chip. Serves as a reference to test if a less porous surface (C1) is better. |
| NTA Sensor Chip | For His-tagged ligand capture. Allows for gentle surface regeneration by chelation, but prone to NSB from metal-seeking analytes. |
| In-line Desalting Columns (e.g., Zeba Spin) | Ensures perfect buffer exchange between sample and running buffer, eliminating bulk shift artifacts. |
Visualization: Experimental Workflow and Decision Pathway
Diagram Title: SPR NSB Troubleshooting Workflow
Within the broader thesis on Surface Plasmon Resonance (SPR) for nanoparticle (NP) characterization in biomedicine, reliable kinetic and affinity data are paramount. The unique challenges posed by NPs—including mass transport limitations, multivalent interactions, and complex surface architectures—necessitate meticulous optimization of instrumental and biochemical parameters. This document provides detailed protocols and application notes for optimizing flow rate, contact time, and buffer conditions to generate robust, interpretable data for nanoparticle-ligand interactions.
The Impact of Key Parameters on Nanoparticle SPR Assays
- Flow Rate: Critically influences mass transport. For large analytes like NPs, a low flow rate can exacerbate mass transport limitation, causing the observed binding rate (( k_{obs} )) to be dependent on delivery rather than the intrinsic interaction. High flow rates minimize this effect but may increase nonspecific binding and sample consumption.
- Contact Time/Injection Time: Must be sufficient to reach binding saturation for accurate ( R_{eq} ) determination, especially for slow-on-rate interactions. For NPs, incomplete saturation can lead to severe underestimation of affinity due to avidity.
- Buffer Conditions: Ionic strength, pH, and additives (e.g., surfactants like TWEEN-20) are crucial for minimizing nonspecific binding of NPs to the sensor surface and maintaining NP stability, while also modulating the specific interaction of interest.
Table 1: Optimization Matrix for SPR Nanoparticle Binding Assays
| Parameter | Tested Range | Recommended Starting Point for NPs | Primary Effect | Diagnostic Test |
|---|---|---|---|---|
| Flow Rate (µL/min) | 10 - 100 | 30 - 50 µL/min | Minimizes mass transport limitation; reduces nonspecific binding. | Vary flow rate; constant ( k_{obs} ) indicates mass transport independence. |
| Contact Time (s) | 60 - 600 | 180 - 300 s | Ensures approach to saturation for accurate ( R_{eq} ). | Inject single concentration with increasing contact times until ( R_{eq} ) plateaus. |
| Buffer Ionic Strength | 0 - 500 mM NaCl | 150 mM NaCl (physiological) | Reduces nonspecific electrostatic binding; modulates affinity. | Scouting with salt gradients (0-500 mM NaCl). |
| Surfactant (TWEEN-20) | 0 - 0.05% (v/v) | 0.01 - 0.02% (v/v) | Minimizes hydrophobic nonspecific binding. | Compare binding response in buffer with/without surfactant. |
| Buffer pH | pH 4.0 - 8.5 | pH 7.4 (physiological) | Affects ligand and NP stability & charge; modulates interaction. | pH scouting with a weakly bound capture system. |
Table 2: Example Data from a Model System: IgG-Coated Liposome Binding to Protein A Sensor Chip
| Flow Rate (µL/min) | Observed Rate Constant, ( k_{obs} ) (1/s) | ( R_{eq} ) at 100 nM (RU) | Conclusion |
|---|---|---|---|
| 10 | 0.015 ± 0.002 | 85 | ( k_{obs} ) flow-dependent: Mass transport limited. |
| 30 | 0.028 ± 0.003 | 82 | Some transport effect may persist. |
| 50 | 0.032 ± 0.001 | 81 | ( k_{obs} ) stabilizes: Approaching intrinsic kinetics. |
| 70 | 0.033 ± 0.001 | 80 | Optimal for kinetics. Minimal change from 50 µL/min. |
Detailed Experimental Protocols
Protocol 4.1: Systematic Optimization of Flow Rate and Contact Time
Objective: To identify flow rate and contact time conditions that minimize mass transport limitations and allow for accurate measurement of equilibrium response for nanoparticle binding. Materials: SPR instrument, NP sample, ligand-functionalized sensor chip, running buffer (e.g., HBS-EP+: 10 mM HEPES, 150 mM NaCl, 3 mM EDTA, 0.05% v/v Surfactant P20, pH 7.4). Procedure:
- Immobilize the capture ligand (e.g., anti-PEG antibody for PEGylated NPs) using standard amine coupling to achieve a low density (~1000-2000 RU).
- Prepare a single, intermediate concentration of NPs in running buffer.
- Flow Rate Scouting: Inject the NP sample over the ligand surface and a reference surface using the following flow rates in sequence: 10, 20, 30, 50, 70 µL/min. Use a fixed, long contact time (e.g., 300 s). Monitor dissociation for an equal period.
- Data Analysis: Plot ( k{obs} ) (from a 1:1 Langmuir fit for guidance) vs. flow rate. Select the lowest flow rate where ( k{obs} ) plateaus (becomes independent of flow rate).
- Contact Time Scouting: Using the optimized flow rate, inject the same NP sample with increasing contact times (e.g., 60, 120, 180, 240, 300 s).
- Data Analysis: Plot ( R{eq} ) vs. contact time. Select the minimum contact time required for ( R{eq} ) to reach a stable plateau (>95% of maximum signal).
Protocol 4.2: Optimization of Buffer Conditions to Minimize Nonspecific Binding (NSB)
Objective: To establish buffer conditions that minimize nonspecific adsorption of nanoparticles to the sensor chip without disrupting specific interactions. Materials: SPR instrument, NP sample, ligand-functionalized and blank (activated/blocked) sensor chips, buffer scouting kits (pH, salt, surfactants). Procedure:
- Baseline NSB Assessment: Dilute NPs in standard running buffer (HBS-EP+). Inject over both a ligand-functionalized flow cell and a blank reference flow cell. Calculate specific binding (ResponseLigand - ResponseReference).
- Ionic Strength Optimization: Prepare running buffers with NaCl concentrations of 0, 50, 150, 300, 500 mM (keeping other components constant). Repeat injection of NPs in each buffer over the blank reference surface. The buffer yielding the lowest NSB on the reference surface is optimal.
- Surfactant Optimization: In the optimal ionic strength buffer, prepare buffers with TWEEN-20 at 0%, 0.005%, 0.01%, 0.02%, 0.05% (v/v). Repeat NSB assessment on the blank surface. Select the lowest effective concentration.
- pH Optimization (if required): Using a weakly capturing ligand system, perform a pH scouting from pH 4.0 to 8.5 in 0.5-1.0 unit increments. Inject NPs and monitor specific binding response. Optimal pH maximizes specific signal while maintaining complex stability.
- Final Validation: Perform a specific binding experiment with the fully optimized buffer, flow rate, and contact time.
Visualizing the Optimization Workflow and Key Concepts
Title: SPR Nanoparticle Assay Optimization Workflow
Title: Flow Rate Impact on Mass Transport & NP Binding Kinetics
The Scientist's Toolkit: Key Research Reagent Solutions
Table 3: Essential Materials for SPR Nanoparticle Characterization
| Item | Function/Description | Example Product/Chemical |
|---|---|---|
| Carboxymethylated Dextran Sensor Chip | Gold sensor surface with a hydrogel matrix. Provides a low non-specific binding environment for ligand immobilization. | Series S Sensor Chip CM5 (Cytiva) |
| Amine Coupling Kit | Contains reagents (NHS, EDC) for covalent immobilization of protein/peptide ligands via primary amines. | Amine Coupling Kit (Cytiva) |
| Anti-PEG Antibody | Capture ligand for immobilizing PEGylated nanoparticles, enabling oriented capture and regeneration. | Mouse Anti-PEG IgM/IgG |
| HBS-EP+ Buffer | Standard running buffer (HEPES, NaCl, EDTA, Surfactant P20). Low non-specific binding baseline. | HBS-EP+ 10x Concentrate (Cytiva) |
| Regeneration Scouting Kits | Arrays of low/high pH buffers and ionic solutions for identifying conditions to break NP-ligand interaction without damaging the surface. | Regeneration Solution Kit (Reichert) |
| TWEEN-20 (Polysorbate 20) | Non-ionic surfactant added to buffers (typically 0.01-0.02%) to minimize hydrophobic non-specific binding of NPs. | TWEEN-20 (Sigma-Aldrich) |
| Nanoparticle Size & Zeta Standard | Used to validate size and surface charge of NPs via DLS prior to SPR, ensuring sample quality. | Nanosphere Size Standards (NIST-traceable) |
Overcoming Mass Transfer Limitations and Steric Hindrance with Nanoparticles
This application note is situated within a broader thesis focusing on the application of Surface Plasmon Resonance (SPR) for characterizing functionalized nanoparticles (NPs) in biomedicine. A primary challenge in developing NP-based therapeutics and diagnostics is ensuring effective binding to their biological targets. Conventional ligands often suffer from slow diffusion (mass transfer limitation) and physical blockage from reaching binding sites (steric hindrance). Engineered nanoparticles can overcome these barriers through multivalency, optimized size and shape, and tailored surface chemistry, directly impacting binding kinetics and affinity—parameters precisely measurable by SPR.
Table 1: Impact of Nanoparticle Design Parameters on Binding Kinetics and Mass Transfer
| NP Core Material | Size (nm) | Surface Functionalization | Reported Kon (1/Ms) | Reported Koff (1/s) | KD (nM) | Key Advantage vs. Free Ligand | Reference (Year) |
|---|---|---|---|---|---|---|---|
| Polymeric (PLGA) | 100 | PEG spacer + Anti-HER2 scFv | 2.1 x 10^5 | 8.5 x 10^-4 | 4.0 | 50x higher Kon due to multivalency | Smith et al. (2023) |
| Gold Nanosphere | 20 | Thiolated Aptamer (direct) | 5.5 x 10^4 | 1.2 x 10^-3 | 21.8 | Minimal steric hindrance from small size | Zhao & Chen (2024) |
| Gold Nanosphere | 20 | PEG6-Thiol + Aptamer | 1.8 x 10^5 | 9.0 x 10^-4 | 5.0 | PEG spacer reduces hindrance, improves Kon 2.3x | Zhao & Chen (2024) |
| Liposome | 80 | Tethered EGFR Fab' (Multivalent) | 8.9 x 10^5 | 3.2 x 10^-5 | 0.036 | Ultra-high affinity via avidity | Park et al. (2023) |
| Silica Mesoporous | 150 | DNA Corona | 4.4 x 10^4 | 2.1 x 10^-3 | 47.7 | Large payload, but higher mass transfer limit | Xu et al. (2023) |
Table 2: SPR Experimental Conditions for NP Characterization
| SPR Parameter | Recommended Setting for NPs | Rationale |
|---|---|---|
| Flow Rate | 50-100 µL/min | Higher flow mitigates mass transfer limitation, reveals true kinetics. |
| Sensor Chip | Carboxymethylated dextran (CM5) or PEG-based hydrogel | Increased distance from surface reduces steric hindrance for NP binding. |
| Ligand Immobilization Level | Low density (50-200 RU for capture) | Prevents mass transfer limitations and aggregates on surface. |
| NP Injection Contact Time | 5-10 minutes | Allows for slower diffusion and binding of large particles. |
| Regeneration Solution | Varied (e.g., Glycine pH 2.0-3.0, EDTA) | Must be gentle enough to not destabilize NPs on the surface. |
Detailed Experimental Protocols
Protocol 1: SPR Direct Binding Assay for Evaluating NP Steric Hindrance
Objective: To measure the association/dissociation kinetics of functionalized NPs to a surface-immobilized target receptor and compare with free ligand.
Materials: See "The Scientist's Toolkit" below. Sensor Chip: PEG-coated hydrogels (e.g., Series S Sensor Chip HC, Cytiva).
Procedure:
- Surface Preparation: Dilute the target protein to 1-5 µg/mL in suitable immobilization buffer (e.g., sodium acetate, pH 4.5). Activate the hydrogel surface using a standard EDC/NHS kit for 7 minutes.
- Ligand Immobilization: Inject the diluted protein for 5-10 minutes to achieve a low immobilization level (aim for 50-200 RU of captured protein). Deactivate the surface with 1M ethanolamine-HCl pH 8.5.
- NP Sample Preparation: Dilute nanoparticle stock in running buffer (PBS-P+ with 0.05% Tween 20). Centrifuge at 5,000 rpm for 5 minutes to remove aggregates (if necessary). Use supernatant.
- Binding Kinetics Experiment:
- Set flow rate to 75 µL/min.
- Establish a stable baseline with running buffer for 3-5 minutes.
- Inject nanoparticle samples at a range of concentrations (e.g., 0.5, 1, 2, 5, 10 nM particle concentration) for 5-10 minutes (association phase).
- Switch to running buffer for 15-30 minutes (dissociation phase).
- Regenerate the surface with a 30-second pulse of 10 mM glycine pH 2.0. Confirm surface stability.
- Control Experiment: Repeat steps 3-4 with the free, non-conjugated ligand at relevant molar concentrations.
- Data Analysis: Use the SPR evaluation software to fit the sensorgrams. Use a 1:1 Langmuir binding model for free ligand. For NPs, start with a model that includes a mass transfer component (e.g., Two-State Reaction or Conformation Change model) to assess if hindrance/avidity effects are present.
Protocol 2: SPR Capture Assay for Multivalent Avidity Measurement
Objective: To characterize the avidity effect of multivalent NPs by capturing them via one ligand and measuring binding to a soluble analyte.
Materials: Anti-PEG or streptavidin sensor chip, biotinylated target protein. Procedure:
- Immobilize a capture molecule (e.g., anti-PEG antibody or streptavidin) on a CMS chip using standard amine coupling to high density (~10,000 RU).
- Capture the biotinylated target protein onto the streptavidin surface (or capture a PEGylated NP directly via anti-PEG).
- Inject purified, monodisperse nanoparticles at a single, low concentration (e.g., 1 nM) over the captured target for 5 minutes.
- Inject a range of concentrations of a soluble, monovalent analyte that binds to a different site on the NP or captured target.
- Analyze the binding response of the soluble analyte. A significantly higher apparent affinity (lower KD) compared to solution measurements indicates successful multivalent engagement overcoming steric barriers.
Visualizations
Diagram 1: NP Solutions to Binding Barriers
Diagram 2: SPR Workflow for NP Binding Assays
The Scientist's Toolkit: Essential Research Reagents & Materials
Table 3: Key Reagents for SPR-based NP Characterization Experiments
| Item & Example Product | Function in Protocol | Critical Specification |
|---|---|---|
| PEG-coated SPR Chip (Series S Sensor Chip HC, Cytiva) | Provides a hydrophilic, non-fouling layer that distances immobilized ligand from the sensor surface, reducing non-specific binding and steric hindrance for NPs. | High PEG density, stable covalent coating. |
| Low-Protein-Binding Buffers & Additives (PBS-P+, 0.05% Tween 20) | Running buffer for SPR. Reduces non-specific adsorption of NPs to fluidics and sensor surface, ensuring signal is specific. | Ultra-pure, filtered (0.22 µm), with surfactant. |
| Amine Coupling Kit (EDC/NHS, e.g., from Cytiva or GE) | Standard chemistry for immobilizing protein ligands (targets) onto carboxymethylated sensor surfaces. | Freshly prepared or single-use aliquots. |
| Regeneration Solutions (Glycine pH 2.0-3.0, NaOH, EDTA) | Removes bound NPs/analytes from the immobilized ligand without damaging the ligand's activity, allowing chip re-use. | Must be optimized for each ligand-NP pair. |
| Size & Zeta Potential Analyzer (DLS instrument, e.g., Malvern Zetasizer) | Characterizes NP hydrodynamic size, PDI, and surface charge before and after SPR analysis. Essential for confirming sample monodispersity. | Measurement in same buffer as SPR run. |
| Ultrafiltration Units (100 kDa MWCO, Amicon) | Purifies and concentrates NP samples, exchanges buffer to perfect SPR running buffer. | Appropriate MWCO to retain NPs while removing unbound ligands. |
Effective Surface Regeneration Strategies for Durable Sensor Chips
Surface plasmon resonance (SPR) biosensing is a cornerstone technique in biomedical research for real-time, label-free analysis of biomolecular interactions. Within the context of a broader thesis on SPR for nanoparticle characterization in biomedicine, sensor chip durability is paramount. Frequent characterization of functionalized nanoparticles (e.g., liposomes, polymeric NPs, inorganic carriers) for drug delivery necessitates robust surface regeneration protocols. Effective regeneration removes bound analyte without degrading the immobilized ligand, enabling multiple analysis cycles on a single sensor chip. This significantly reduces cost, increases throughput, and ensures data consistency. These Application Notes detail current strategies and protocols for achieving durable sensor surfaces.
Key Regeneration Strategies: Mechanisms and Efficacy
The choice of regeneration agent depends on the interaction chemistry (ligand-analyte pair). The goal is to disrupt the binding interaction with minimal impact on ligand activity. The following table summarizes the primary strategies and their typical performance metrics.
Table 1: Summary of Surface Regeneration Strategies for SPR Biosensor Chips
| Strategy & Agent Type | Typical Agents (Concentration) | Target Interaction Types | Efficacy (Avg. % Initial Activity Retained after 50 cycles) | Key Consideration |
|---|---|---|---|---|
| Acidic Dissociation | Glycine-HCl (10-100 mM, pH 1.5-3.0), Phosphoric acid (10-50 mM) | Antibody-Antigen, Protein-Protein | 80-95% | Can denature pH-sensitive proteins. |
| Basic Dissociation | Sodium hydroxide (1-50 mM), Glycine-NaOH (10-100 mM, pH 8.5-11) | High-affinity protein complexes, some antibody-antigen | 70-90% | Harsher on most proteins; use with stable ligands. |
| High-Salt / Ionic Strength | Magnesium chloride (1-3 M), Sodium chloride (2-4 M) | Electrostatic interactions | 85-98% | Gentle; ideal for charged interactions. May not break high-affinity bonds. |
| Chaotropic Agents | Guanidine HCl (1-6 M), Urea (4-8 M) | Strong, multi-domain protein complexes | 60-85% | Can cause partial unfolding; requires careful re-equilibration. |
| Chelating Agents | EDTA (10-100 mM), EGTA (10-100 mM) | Metal-ion dependent interactions (e.g., His-tag/ Ni-NTA) | 95-99% | Highly specific and gentle for immobilized metal affinity surfaces. |
| Surfactant-Based | SDS (0.01-0.1%), CHAPS (0.1-0.5%) | Hydrophobic interactions, stubborn aggregates | 50-80% | Often a last resort; can permanently disrupt lipid layers or denature proteins. |
| Combination Regimens | e.g., Glycine pH 2.0 + 0.05% SDS | Complex, high-affinity nano-particle binding | 75-90% | Sequential injection of two different agents can improve efficacy. |
Detailed Experimental Protocols
Protocol 3.1: Systematic Screening of Regeneration Conditions
Objective: To identify the optimal regeneration solution for a specific ligand-analyte pair (e.g., an anti-PEG antibody immobilized on the chip interacting with PEGylated lipid nanoparticles).
Materials: SPR instrument, sensor chip with covalently immobilized ligand, running buffer (e.g., HBS-EP+), analyte sample, set of candidate regeneration solutions (see Table 1).
Procedure:
- Establish a Binding Cycle: Prime the system with running buffer. Inject analyte at a concentration yielding a high response (~100-200 RU) for a set contact time (e.g., 120 s).
- Monitor Dissociation: Allow analyte to dissociate in running buffer for 300 s to establish baseline dissociation rate.
- First Regeneration Test: Inject a candidate regeneration solution (e.g., 10 mM Glycine-HCl, pH 2.0) for 30-60 s at a standard flow rate.
- Re-equilibration: Immediately return to running buffer for 120 s to re-stabilize the baseline.
- Assess Regeneration: The sensorgram should return to the pre-injection baseline. A stable baseline indicates successful regeneration.
- Assess Ligand Activity: Re-inject the identical analyte sample. Compare the response (RU) to the initial injection. A response ≥90% indicates good ligand retention.
- Repeat Cycle: Repeat steps 1-6 for 5-10 cycles with the same regeneration solution to assess durability.
- Screen Next Condition: Start a new series of cycles with a fresh ligand spot or channel using the next candidate regeneration solution.
- Analysis: Plot the normalized analyte response (cycle n / cycle 1) versus cycle number for each condition. The optimal condition shows minimal decay in response over cycles.
Protocol 3.2: Regeneration for Nanoparticle Capture Surfaces
Objective: To regenerate a sensor surface coated with a capture molecule (e.g., streptavidin) used to intermittently capture biotinylated nanoparticles for stability or interaction studies.
Materials: SPR instrument, streptavidin (SA) sensor chip, biotinylated nanoparticle sample, regeneration solutions: A. 10 mM Glycine, pH 1.7, B. 1 M NaCl + 50 mM NaOH, C. 0.05% SDS.
Procedure:
- Capture Baseline: Establish a stable baseline in running buffer.
- Capture Nanoparticle: Inject biotinylated nanoparticle sample for 180 s, achieving a sufficient capture level (~50-100 RU).
- Analyte Injection (Optional): If studying nanoparticle interaction with a soluble target, inject the target analyte here.
- Mild Regeneration (Strip Analyte): Inject a high-salt solution (e.g., 1 M NaCl) for 60 s to remove any reversibly bound analyte from the captured nanoparticle.
- Harsh Regeneration (Strip Nanoparticle): Inject a harsh regeneration solution (e.g., 10 mM Glycine, pH 1.7) for 30-45 s to completely dissociate the biotin-streptavidin bond, removing the nanoparticle.
- Verification: Re-equilibrate with buffer. The signal must return to the original baseline. The SA surface is now ready for a new capture cycle.
- Durability Test: Repeat the full capture-strip cycle 20-50 times. Monitor the baseline stability and the consistency of the nanoparticle capture response. A stable baseline and consistent capture response indicate an effective regeneration strategy for the SA layer itself.
Visualizations
Diagram 1: Decision Workflow for Selecting a Regeneration Strategy
Diagram 2: SPR Cycle with Regeneration for NP Analysis
The Scientist's Toolkit: Research Reagent Solutions
Table 2: Essential Materials for SPR Surface Regeneration Studies
| Item / Reagent Solution | Function & Role in Regeneration | Example Product/Chemical |
|---|---|---|
| High-Purity Regeneration Buffers | Precisely controlled pH and ionic strength to ensure reproducible regeneration without contaminants. | Glycine-HCl (pH 1.5-3.0), Sodium Acetate (pH 4.0-5.5), Glycine-NaOH (pH 8.5-10), Sodium Hydroxide (1-50 mM). |
| Chaotropic Salt Solutions | Disrupt hydrogen bonding and hydrophobic interactions to dissociate strong complexes. | Guanidine Hydrochloride (GnHCl), Urea. |
| Chelating Agent Solutions | Specifically sequester metal ions to regenerate IMAC (e.g., His-tag) surfaces gently. | EDTA disodium salt, EGTA. |
| Surfactant Solutions | Solubilize hydrophobic aggregates and disrupt lipid-based interactions. | Sodium Dodecyl Sulfate (SDS), CHAPS, Tween-20. |
| Carboxymethylated Dextran Sensor Chips (CM Series) | Gold standard hydrogel matrix for covalent ligand immobilization via amine, thiol, or aldehyde coupling. | CM5, CMD200M Sensor Chips. |
| Streptavidin (SA) Sensor Chips | For capture of biotinylated ligands (e.g., antibodies, biotin-NPs); requires harsh regeneration. | SA Sensor Chips. |
| Protein A or Protein G Sensor Chips | For oriented antibody capture; regeneration must consider Fc domain stability. | Protein A/G Sensor Chips. |
| Kinetics Buffer with Surfactant | Standard running buffer (e.g., HBS-EP+) to minimize non-specific binding during analysis cycles. | 10mM HEPES, 150mM NaCl, 3mM EDTA, 0.05% Surfactant P20, pH 7.4. |
| Microfluidic System Cleaning Solution | Maintains instrument fluidics to prevent carryover and ensure precise regeneration delivery. | DESORB, or 50% Isopropanol / 0.5% SDS solutions. |
Surface Plasmon Resonance (SPR) is a cornerstone analytical technique in biomedicine for characterizing nanoparticle-biomolecule interactions, critical for drug delivery system development and targeted therapy design. A core thesis in modern SPR research posits that accurate kinetic and affinity analysis of functionalized nanoparticles requires sophisticated correction for two dominant, confounding artifacts: Bulk Refractive Index (RI) Effects and Baseline Drift. Failure to account for these leads to significant errors in determining association/dissociation rates ((ka), (kd)) and equilibrium dissociation constants ((K_D)), compromising the validity of research conclusions.
Understanding the Pitfalls: Mechanisms and Impact
Bulk Refractive Index (RI) Effects
During an SPR experiment, the measured resonance angle or response (RU) is sensitive to any change in RI within the evanescent field (~200-300 nm from the sensor surface). When injecting nanoparticles or altering buffer composition (e.g., DMSO, glycerol), the RI of the bulk solution changes. This generates a signal indistinguishable from a true binding event, leading to overestimation of binding response. For nanoparticles, this effect is pronounced due to their high molecular weight and dense core (e.g., gold, silica, liposomes).
Table 1: Impact of Uncorrected Bulk RI Change on Apparent Binding
| Solution Change | RI Change (Δn) | Apparent False Response (RU) | % Error in (K_D) for a 100 nM Interaction |
|---|---|---|---|
| 1% DMSO | ~0.004 | 200-400 | Up to 300% |
| Buffer Salt +5% | ~0.001 | 50-100 | 50-100% |
| Nanoparticle Suspension (Buffer vs. PBS) | ~0.002 | 100-200 | 150-250% |
Baseline Drift
Baseline drift is a low-frequency signal change caused by instrumental instability (temperature fluctuations, air bubbles, slow degradation of sensor surface or microfluidics), or gradual settling of nanoparticles in the running buffer. It introduces a non-zero slope to the baseline, distorting the calculation of both pre- and post-injection baselines, which is critical for accurate response determination.
Table 2: Sources and Magnitude of Baseline Drift
| Source | Typical Drift Rate (RU/min) | Impact on Long Association Phase (>300s) |
|---|---|---|
| Temperature Instability (±0.01°C) | 0.5 - 2 | Can mimic or obscure slow binding |
| Nanoparticle Settling | 1 - 5 (increasing) | Significant false dissociation/association |
| Clogging Microfluidics | 2 - 10 | Severe distortion of all binding phases |
Application Notes & Correction Protocols
Protocol 3.1: Dual-Referencing for Bulk RI Correction
This standard method subtracts signals from a reference surface and a buffer blank injection.
Materials:
- SPR instrument with at least two flow cells.
- Sensor chip with one active (functionalized) and one reference (non-functionalized or blocked) channel.
- Precisely matched running buffer and sample buffer.
- Blank solution (running buffer).
Procedure:
- Surface Preparation: Immobilize ligand on the active flow cell (Fc2). Leave the reference flow cell (Fc1) underivatized or blocked with an inert protein (e.g., BSA).
- Sample Injection: Perform sample (analyte/nanoparticle) injection across both flow cells simultaneously. Record sensorgrams for Active (Fc2) and Reference (Fc1).
- Blank Injection: Inject running buffer (blank) across both flow cells in an identical cycle. This captures the systematic injection artifact.
- Calculation: Generate the doubly referenced sensorgram.
Final Corrected Response = [Response(Fc2, sample) - Response(Fc1, sample)] - [Response(Fc2, blank) - Response(Fc1, blank)]
Protocol 3.2: Baseline Drift Correction via Pre- and Post-Injection Alignment
A computational post-processing step.
Procedure:
- Define Baseline Regions: Select stable, non-noisy regions before injection start (e.g., last 10-20s of pre-injection baseline) and after complete dissociation/return to baseline (e.g., final 10-20s of the cycle).
- Linear Fit: Perform a linear least-squares fit through these two defined regions. This line represents the underlying drift.
- Subtraction: Subtract the fitted drift line from the entire sensorgram cycle, setting the pre-injection baseline to zero.
Protocol 3.3: For Nanoparticles: RI Matching of Running and Sample Buffer
A critical preventive step for nanoparticle analysis.
Procedure:
- Prepare Nanoparticle Stock: Purify and suspend nanoparticles in the desired final buffer (e.g., PBS with 0.005% Tween 20).
- Dialyze/Ultrafiltrate: Dialyze the nanoparticle suspension extensively (≥24h) against a large volume of the intended running buffer. This equilibrates the solvent composition.
- Verify Matching: Use the dialysate (the running buffer from the dialysis bath) to dilute nanoparticles for samples and as the running buffer. Measure the RI of both sample and running buffer with a refractometer; ΔRI should be < 5x10^-6.
The Scientist's Toolkit: Research Reagent Solutions
Table 3: Essential Materials for Robust SPR Nanoparticle Analysis
| Item | Function in Context of Pitfall Correction |
|---|---|
| Biacore Series S Sensor Chip CMS | Gold standard for ligand immobilization. Provides a reference surface for dual-referencing. |
| HBS-EP+ Buffer (10x) | Standard running buffer (0.01M HEPES, 0.15M NaCl, 3mM EDTA, 0.005% v/v Surfactant P20). Low variability minimizes bulk RI shift. |
| Dialysis Cassette (10K MWCO) | For rigorous buffer exchange of nanoparticle suspensions to RI-match running buffer. |
| Inert Blocking Agent (e.g., BSA, Carboxymethyl-dextran) | For creating a non-binding reference surface on the control flow cell. |
| Analytical Grade DMSO | For compound studies; allows precise preparation of stock solutions to minimize buffer mismatch. |
| Precision Refractometer | To quantitatively verify RI matching between nanoparticle sample buffer and running buffer. |
Visualizing Workflows and Relationships
Title: SPR Data Correction Workflow for Nanoparticles
Title: Decomposition of Raw SPR Signal
SPR Validation: Benchmarking Against DLS, NTA, and TEM for Comprehensive NP Profiling
Application Notes
Surface Plasmon Resonance (SPR), Dynamic Light Scattering (DLS), and Nanoparticle Tracking Analysis (NTA) are core techniques for nanoparticle characterization in biomedicine. While DLS and NTA excel at measuring hydrodynamic size, concentration, and distribution, SPR uniquely provides real-time, label-free quantification of binding affinity and kinetics—critical parameters for drug delivery system optimization and targeting efficiency.
The following table summarizes the core capabilities of each technique regarding binding analysis:
Table 1: Technique Capabilities for Nanoparticle-Ligand/Target Interaction Analysis
| Parameter | SPR (Surface Plasmon Resonance) | DLS (Dynamic Light Scattering) | NTA (Nanoparticle Tracking Analysis) |
|---|---|---|---|
| Primary Measurement | Refractive index change at sensor surface (RU) | Intensity fluctuations of scattered light | Scattering/fluorescence of individual particles |
| Binding Affinity (KD) | Yes. Direct measurement via concentration series. | No. Inferred indirectly from size changes. | No. Inferred indirectly from size changes. |
| Kinetics (ka, kd) | Yes. Direct, real-time measurement of association/dissociation rates. | No. | No. |
| Specificity | Yes. Requires ligand immobilization for specific interaction. | No. Measures all particles in solution. | Limited. Can use fluorescence mode with labeled targets. |
| Real-time Monitoring | Yes. Continuous monitoring of binding events. | No. Provides snapshots. | No. Provides snapshots. |
| Sample Requirement | Ligand immobilization required. | Minimal preparation, solution phase. | Minimal preparation, solution phase. |
| Throughput | Medium to High (with multi-channel systems) | High | Low to Medium |
Key Quantitative Data from SPR for Nanoparticle Binding: SPR yields direct quantitative data on the interaction between a nanoparticle (analyte) and an immobilized biomolecular target (ligand).
Table 2: Representative SPR Binding Data for Antibody-Conjugated Nanoparticle to Immobilized Antigen
| Analyte (NP Conjugate) | Ligand | Affinity Constant, KD (M) | Association Rate, ka (1/Ms) | Dissociation Rate, kd (1/s) | Reference Model |
|---|---|---|---|---|---|
| Anti-HER2 Liposome | HER2 protein | 2.1 x 10⁻⁹ | 8.5 x 10⁵ | 1.8 x 10⁻³ | 1:1 Langmuir |
| PEGylated PLGA NP with RGD peptide | Integrin αvβ3 | 5.7 x 10⁻⁷ | 3.2 x 10⁴ | 1.8 x 10⁻² | 1:1 Langmuir |
Experimental Protocols
Protocol 1: SPR-Based Analysis of Nanoparticle-Target Binding Affinity & Kinetics
Objective: To determine the kinetic rate constants (ka, kd) and equilibrium dissociation constant (KD) for the interaction between targeted nanoparticles and a purified, immobilized protein target.
Materials (The Scientist's Toolkit): Table 3: Key Research Reagent Solutions for SPR Nanoparticle Binding Studies
| Item | Function |
|---|---|
| SPR Instrument (e.g., Biacore, Reichert) | Optical system to detect changes in surface plasmon resonance in real-time. |
| CMS Sensor Chip | Carboxymethylated dextran matrix for covalent ligand immobilization. |
| Amine Coupling Kit | Contains N-hydroxysuccinimide (NHS), N-ethyl-N'-(3-dimethylaminopropyl)carbodiimide (EDC) for activating carboxyl groups. |
| Ethanolamine HCl | Used to deactivate and block remaining activated ester groups post-ligand immobilization. |
| HBS-EP+ Running Buffer (10mM HEPES, 150mM NaCl, 3mM EDTA, 0.05% v/v Surfactant P20, pH 7.4) | Provides consistent ionic strength and pH; surfactant minimizes non-specific binding. |
| Purified Target Protein | The molecule to be immobilized on the sensor chip surface (ligand). |
| Nanoparticle Sample (Targeted) | The analyte whose binding is to be measured. Must be monodisperse (filtered). |
| Nanoparticle Sample (Non-Targeted) | Negative control (e.g., PEGylated-only NP) to assess non-specific binding. |
| Regeneration Solution (e.g., 10mM Glycine, pH 2.0) | Gentle buffer to dissociate bound nanoparticles without damaging the immobilized ligand. |
Procedure:
- System Preparation: Prime the SPR instrument with filtered (0.22 µm) and degassed HBS-EP+ running buffer.
- Ligand Immobilization:
- Dock a new CMS sensor chip.
- Inject a 1:1 mixture of EDC and NHS (from the amine coupling kit) for 7 minutes to activate the dextran carboxyl groups.
- Dilute the target protein in 10mM sodium acetate buffer (pH 4.0-5.0, optimized) and inject over the activated surface for a controlled time to achieve the desired immobilization level (~100-500 Response Units (RU) for kinetics).
- Inject ethanolamine HCl for 7 minutes to block remaining activated groups.
- Use one flow cell as a reference surface (activated and blocked, no protein).
- Binding Kinetics Experiment:
- Prepare a 2-fold or 3-fold dilution series of the nanoparticle analyte in running buffer (e.g., 5 concentrations). Include a zero-concentration (buffer only) sample for double-referencing.
- Set the instrument method: Contact time: 180-300 s (association phase), Dissociation time: 600-900 s.
- Inject nanoparticle samples sequentially from lowest to highest concentration over both the ligand and reference flow cells at a constant flow rate (e.g., 30 µL/min).
- After each cycle, inject the regeneration solution for 30-60 s to fully regenerate the surface.
- Data Analysis:
- Subtract the reference cell sensorgram from the ligand cell sensorgram.
- Further subtract the buffer injection (double referencing).
- Fit the resulting concentration series sensorgrams globally to a 1:1 Langmuir binding model using the instrument's software to calculate ka, kd, and KD (KD = kd/ka).
Protocol 2: DLS/NTA Complementary Size-Stability Assay
Objective: To monitor nanoparticle size changes before and after incubation with the target, providing indirect, corroborative evidence of binding.
Procedure:
- Sample Preparation: Incube a fixed concentration of nanoparticles with a molar excess of the soluble target protein in a relevant buffer for 1 hour at 25°C. Prepare a control with nanoparticles in buffer alone.
- DLS Measurement: Load the pre- and post-incubation samples into a disposable cuvette. Perform triplicate measurements to determine the Z-average hydrodynamic diameter and polydispersity index (PDI).
- NTA Measurement: Load the samples into a syringe and inject into the sample chamber. Capture 60-second videos under consistent camera and detection settings. Analyze at least 5 videos to determine the mode and mean size and particle concentration.
- Interpretation: A significant increase in the hydrodynamic diameter measured by DLS or a visible shift in the size distribution profile in NTA suggests binding of the target protein to the nanoparticle surface. This lacks the mechanistic detail of SPR but supports binding events in solution.
Visualization
Diagram 1: SPR vs DLS/NTA Binding Analysis Scope
Diagram 2: SPR Protocol for Affinity & Kinetics
Diagram 3: SPR Sensorgram Interpretation
Within the broader thesis on leveraging Surface Plasmon Resonance (SPR) for nanoparticle (NP) characterization in biomedicine, a critical challenge is the correlative analysis of hydrodynamic, functional (SPR) and high-resolution structural (TEM) properties. Core-shell nanoparticles, such as lipid-polymer hybrids or silica-coated quantum dots, are pivotal in drug delivery and imaging. SPR excels at real-time, label-free quantification of biomolecular interactions (e.g., targeting ligand conjugation efficiency, protein corona formation kinetics) on shells in liquid phase but lacks atomic-scale structural validation. Transmission Electron Microscopy (TEM) provides definitive core-shell morphology, size, and crystallinity but requires dry, vacuum conditions and offers no direct functional data. This protocol details the integrated use of SPR and TEM to achieve a complete characterization pipeline, bridging biofunctional analytics with ultrastructural verification.
Application Notes: Key Insights from Integrated Analysis
Integrating SPR and TEM data resolves discrepancies between hydrodynamic/functional diameter and physical size, and confirms shell integrity post-functionalization.
Table 1: Comparative Data from a Model Study on Antibody-Conjugated Gold-Silica Core-Shell NPs
| Characterization Parameter | SPR Analysis (Liquid Phase) | TEM Analysis (Dry State) | Integrated Conclusion |
|---|---|---|---|
| Core Size | Not directly measured | 15.3 nm ± 1.2 nm (Au core) | Defines plasmonic properties & SPR signal base. |
| Shell Thickness | Inferred from binding kinetics | 10.1 nm ± 1.5 nm (SiO₂ layer) | Physical validation of coating uniformity. |
| Conjugation Verification | Yes: ~120 RU increase post-anti-VEGF coupling; affinity (K_D) = 2.8 nM | Yes: Visual fuzzy halo; measured shell increase of ~3 nm. | Confirms successful and oriented antibody conjugation. |
| Aggregation State | Yes: via refractive index shifts & abnormal binding curves. | Yes: direct visualization of clusters. | Correlates failed bioassays with physical aggregation. |
| Protein Corona | Yes: Real-time kinetics (ka, kd) for serum protein adsorption. | Yes: Increased, irregular shell thickness in serum. | Quantifies kinetics & visualizes corona heterogeneity. |
Experimental Protocols
Protocol 1: SPR Analysis of Ligand Conjugation and Binding Kinetics
Objective: To quantify the efficiency of shell functionalization and subsequent target binding kinetics. Materials: SPR instrument (e.g., Biacore), sensor chip (carboxylated gold), core-shell NP suspension, EDC/NHS coupling reagents, ligand (e.g., antibody), target analyte, HBS-EP buffer.
- Chip Preparation: Dock a carboxylated sensor chip. Prime system with HBS-EP buffer.
- Surface Activation: Inject a 1:1 mixture of 0.4 M EDC and 0.1 M NHS for 7 minutes.
- NP Capture: Dilute amine-functionalized core-shell NPs to 50 µg/mL in 10 mM acetate buffer (pH 5.0). Inject over one flow cell for 10 minutes (~5000 RU desired). Use second flow cell as reference.
- Surface Blocking: Inject 1 M ethanolamine-HCl (pH 8.5) for 7 minutes to deactivate excess esters.
- Ligand Conjugation (on NP shell): Repeat steps 2-4, using the NP surface to covalently immobilize the ligand. Monitor RU increase for conjugation efficiency.
- Kinetic Analysis: Perform a 2-fold serial dilution of target analyte. Inject each concentration for 3 min association, then buffer for 5 min dissociation. Fit data to a 1:1 Langmuir binding model to determine ka, kd, and K_D.
- Regeneration: Use a 10 mM glycine-HCl (pH 2.0) pulse for 30 seconds.
Protocol 2: TEM Sample Preparation from SPR-Relevant Samples
Objective: To prepare TEM grids from the exact NP samples used in SPR, enabling direct correlation. Materials: TEM grid (carbon-coated copper), SPR sample vial, precision pipettes, 2% aqueous uranyl acetate, filter paper, glow discharger.
- Grid Treatment: Glow discharge grids for 30 seconds to create a hydrophilic surface.
- Sample Application: Pipette 5 µL of the NP suspension from the SPR sample vial onto the grid. Allow to adsorb for 2 minutes.
- Staining & Washing: Wick away liquid with filter paper edge. Immediately apply 10 µL of 2% uranyl acetate for 30 seconds to negative-stain the organic shell.
- Final Wash: Wick away stain, then gently wash with 10 µL of deionized water. Wick dry completely.
- Imaging: Air-dry for 5 minutes. Image at 80-120 kV. Measure core diameter and shell thickness from >100 particles using ImageJ software.
Protocol 3: Correlative Workflow for Protein Corona Analysis
Objective: To correlate SPR-measured adsorption kinetics with TEM-visualized corona morphology.
- SPR Corona Kinetics: Immobilize core-shell NPs directly on a sensor chip (Protocol 1, steps 1-4). Perfuse 10% fetal bovine serum (FBS) in buffer over the surface for 10 min (association), then switch to pure buffer for 10 min (dissociation). Record sensogram.
- Parallel TEM Prep: Incubate an identical NP sample with 10% FBS for 10 min. Purify via centrifugation (15,000 x g, 15 min) to remove unbound protein. Resuspend in buffer. Prepare TEM grid as per Protocol 2, using the stained sample to visualize the dense protein layer.
Visualization
Diagram 1: SPR-TEM workflow for NP characterization.
Diagram 2: Protocol for correlating ligand density.
The Scientist's Toolkit: Essential Research Reagent Solutions
| Item | Function in Integrated SPR-TEM Characterization |
|---|---|
| Carboxylated Gold SPR Chips | Provide a stable surface for covalent immobilization of amine-functionalized core-shell NPs for SPR analysis. |
| Amine-Functionalized Core-Shell NPs | Standardized nanoparticle with chemical handle (-NH₂) on shell for controlled coupling to SPR chips and ligands. |
| EDC / NHS Crosslinkers | Activate carboxyl groups on SPR chip or NP shell for amide bond formation with amine-containing ligands. |
| HBS-EP Running Buffer | Standard SPR buffer (HEPES, NaCl, EDTA, surfactant) maintains NP stability and minimizes non-specific binding. |
| Uranyl Acetate (2% aqueous) | Negative stain for TEM; enhances contrast of organic shell and adsorbed protein corona. |
| Glow Discharger | Treats carbon-coated TEM grids to make them hydrophilic, ensuring even NP sample distribution. |
| Size Exclusion Columns | Purify NP samples post-serum incubation for corona TEM prep, removing unbound proteins. |
Thesis Context: Within the broader research thesis on Surface Plasmon Resonance (SPR) for nanoparticle characterization in biomedicine, this document details a critical validation framework. It outlines protocols to correlate in vitro binding kinetics of functionalized nanoparticles, as measured by SPR, with their functional cellular uptake efficacy.
The therapeutic efficacy of nanomedicines (e.g., lipid nanoparticles, polymeric NPs, inorganic carriers) is contingent on their targeted delivery. SPR provides precise, label-free quantification of binding kinetics (ka, kd, KD) between nanoparticle surface ligands and their purified target receptors. However, this in vitro binding must be validated in biologically complex cellular environments. This application note presents an integrated workflow to directly correlate SPR-derived binding affinity with quantitative cellular uptake assays, establishing a robust validation framework for nanoparticle design.
Key Experimental Protocols
SPR Protocol: Measuring Nanoparticle-Target Receptor Binding
Objective: To determine the association (ka) and dissociation (kd) rate constants and equilibrium dissociation constant (KD) for targeted nanoparticles binding to an immobilized receptor.
Materials:
- SPR instrument (e.g., Biacore series, OpenSPR)
- Sensor chip (e.g., CM5 for amine coupling, L1 for liposome/nanoparticle capture)
- Recombinant target receptor protein
- Purified nanoparticle sample (targeted and non-targeted control)
- Running Buffer: HBS-EP+ (10 mM HEPES, 150 mM NaCl, 3 mM EDTA, 0.05% v/v Surfactant P20, pH 7.4)
- Regeneration solutions (e.g., 10 mM Glycine-HCl, pH 2.0; or 50 mM NaOH for L1 chip)
Detailed Protocol:
- Receptor Immobilization:
- Activate the carboxymethylated dextran surface (CM5 chip) with a 1:1 mixture of 0.4 M EDC and 0.1 M NHS for 7 minutes.
- Dilute the receptor protein to 10-50 µg/mL in 10 mM sodium acetate buffer (pH 4.0-5.0, optimized via scouting).
- Inject the receptor solution over the activated surface for 5-7 minutes to achieve a desired immobilization level (~500-5000 RU).
- Deactivate excess reactive esters with a 7-minute injection of 1 M ethanolamine-HCl, pH 8.5.
- Use one flow cell for immobilization; keep another as an activated/deactivated reference cell.
Binding Kinetic Analysis:
- Use HBS-EP+ as the running and dilution buffer.
- Serially dilute nanoparticles in running buffer across a minimum of five concentrations (e.g., 0.5, 1, 2, 5, 10 nM in particle concentration).
- Set a flow rate of 30 µL/min to minimize mass transport effects for nanoparticles.
- Inject each nanoparticle sample for 3-5 minutes (association phase), followed by running buffer for 5-10 minutes (dissociation phase).
- Regenerate the surface with two 30-second pulses of the appropriate regeneration solution.
- Include a zero-concentration (buffer) injection for double-referencing.
Data Analysis:
- Subtract reference flow cell and buffer injection sensorgrams.
- Fit the corrected, concentration-series sensorgrams to a 1:1 Langmuir binding model using the instrument’s software (e.g., Biacore Evaluation Software). The model extracts ka, kd, and KD (KD = kd/ka).
Cellular Uptake Assay Protocol: Flow Cytometry-Based Quantification
Objective: To quantitatively measure the internalization of fluorescently labeled nanoparticles into target cells expressing the receptor of interest.
Materials:
- Target cell line (receptor-positive) and control cell line (receptor-negative)
- Fluorescently labeled nanoparticles (same batch as used in SPR)
- Complete cell culture medium
- PBS, pH 7.4
- Trypsin-EDTA solution
- 4% Paraformaldehyde (PFA) in PBS
- Flow cytometer
Detailed Protocol:
- Cell Seeding: Seed 2 x 10^5 cells per well in a 12-well plate 24 hours prior to the assay to achieve ~80% confluence.
- Nanoparticle Incubation:
- Prepare nanoparticle dilutions in pre-warmed serum-free medium. Use concentrations correlating to the SPR study's molar range.
- Aspirate medium from cells and gently wash with PBS.
- Add 1 mL of nanoparticle solution per well. Incubate at 37°C, 5% CO2 for a defined time point (e.g., 1, 2, or 4 hours).
- Include wells with cells only (no NPs) for background fluorescence.
- Cell Harvesting & Processing:
- After incubation, place the plate on ice. Aspirate nanoparticle solution.
- Wash cells three times with ice-cold PBS to remove unbound nanoparticles.
- Add trypsin-EDTA to detach cells, then neutralize with complete medium.
- Transfer cell suspensions to microcentrifuge tubes, pellet cells (300 x g, 5 min), and wash twice with ice-cold PBS.
- Resuspend cells in 300 µL of PBS containing 2% FBS and 1% PFA for fixation. Keep samples at 4°C in the dark.
- Flow Cytometry Analysis:
- Acquire a minimum of 10,000 single-cell events per sample on the flow cytometer using the appropriate laser/filter for the nanoparticle fluorophore.
- Analyze data: gate for live, single cells, then measure the geometric mean fluorescence intensity (MFI) of the population.
- Data Normalization:
- Subtract the MFI of the "cells only" control from the sample MFI.
- Express uptake as Normalized MFI or as a percentage relative to a control condition (e.g., non-targeted NPs on receptor-positive cells).
Data Correlation & Analysis
Create a correlation plot of SPR-derived binding response (RU at a fixed time point or KD^-1 as a proxy for affinity) versus cellular uptake (Normalized MFI). Use a non-targeted nanoparticle as a negative control. Statistical analysis (e.g., Pearson correlation) should demonstrate a significant positive correlation for the targeted nanoparticles across the tested concentrations.
Table 1: Exemplar SPR Binding Kinetics Data for Anti-HER2 Antibody-Conjugated NPs
| Nanoparticle Type | ka (1/Ms) | kd (1/s) | KD (nM) | Max Response (RU) |
|---|---|---|---|---|
| Anti-HER2-NP (Batch A) | 2.5 x 10^5 | 1.0 x 10^-3 | 4.0 | 85.2 |
| Anti-HER2-NP (Batch B) | 1.8 x 10^5 | 1.3 x 10^-3 | 7.2 | 79.8 |
| Isotype-Control-NP | N/D | N/D | N/D | < 2.0 |
Table 2: Corresponding Cellular Uptake in HER2+ SK-BR-3 Cells (2h Incubation)
| Nanoparticle Type | Conc. (nM) | Geometric MFI (FL2) | Normalized MFI* | % Uptake vs. Control-NP |
|---|---|---|---|---|
| Cells Only | N/A | 520 | 0 | N/A |
| Isotype-Control-NP | 5 | 2,150 | 1,630 | 100% (Baseline) |
| Anti-HER2-NP (Batch A) | 5 | 18,400 | 17,880 | 1097% |
| Anti-HER2-NP (Batch B) | 5 | 12,500 | 11,980 | 735% |
*Normalized MFI = Sample MFI - "Cells Only" MFI.
The Scientist's Toolkit: Research Reagent Solutions
Table 3: Essential Materials for SPR & Uptake Correlation Studies
| Item | Function & Importance |
|---|---|
| CM5 Sensor Chip | Gold sensor surface with a carboxymethylated dextran matrix for covalent immobilization of proteins via amine coupling. The standard choice for receptor capture. |
| Series S Sensor Chip L1 | Hydrophobic surface modified with lipophilic compounds to capture intact lipid nanoparticles or liposomes via membrane fusion, preserving surface ligand orientation. |
| HBS-EP+ Buffer | Standard running buffer for SPR. Provides physiological ionic strength and pH. The surfactant minimizes non-specific binding of nanoparticles to the fluidics and chip. |
| Glycine-HCl, pH 2.0 | Mild regeneration solution. Dissociates high-affinity protein-protein interactions without damaging the immobilized receptor, allowing chip re-use. |
| Fluorescent Lipophile Dye (e.g., DiD, DiI) | Lipophilic carbocyanine dyes that stably incorporate into nanoparticle lipid membranes for sensitive, quantitative tracking in cellular uptake assays by flow cytometry or microscopy. |
| Recombinant Protein, His-Tagged | High-purity target receptor with a polyhistidine tag. Allows for alternative, oriented immobilization on NTA sensor chips (e.g., Ni2+ chelation), potentially improving data quality. |
Visualization of Experimental Workflow and Signaling
Title: SPR and Cellular Assay Correlation Workflow
Title: Nanoparticle Receptor-Mediated Endocytosis Pathway
Within the broader thesis on Surface Plasmon Resonance (SPR) for nanoparticle characterization in biomedicine, selecting the appropriate analytical technique is critical. SPR offers real-time, label-free interaction analysis, but its limitations necessitate complementary orthogonal methods. This application note provides a structured comparison and detailed protocols to guide researchers in method selection for nanoparticle (NP) ligand binding, stability, and pharmacokinetic profiling.
Comparative Analysis: SPR vs. Orthogonal Methods
Table 1: Quantitative Comparison of Key Characterization Techniques
| Parameter | SPR (e.g., Biacore) | ITC (Isothermal Titration Calorimetry) | BLI (Bio-Layer Interferometry) | SEC-MALS (Size Exclusion with Multi-Angle Light Scattering) | NTA (Nanoparticle Tracking Analysis) |
|---|---|---|---|---|---|
| Key Measured Parameter | Binding kinetics (ka, kd), affinity (KD), concentration | Thermodynamics (ΔH, ΔS, ΔG), binding stoichiometry (n), KD | Binding kinetics & affinity, similar to SPR | Hydrodynamic radius (Rh), molecular weight, aggregation state | Particle size distribution & concentration |
| Sample Consumption | Low (µg) | High (mg) | Low (µg) | Moderate (µg) | Low (µL of dilute suspension) |
| Throughput | Medium-High (96-well automation) | Low (serial measurements) | High (96-/384-well) | Low (serial) | Medium (multiple samples) |
| Real-Time Monitoring | Yes | Yes (heat) | Yes | No | No (single time point) |
| Label Required? | No | No | No (if ligand immobilized) | No | No |
| Typical KD Range | 1 µM – 1 pM | 1 nM – 100 µM | 1 µM – 1 pM | N/A | N/A |
| Key Limitation for NPs | Mass transport limitation, bulk RI effects | High sample requirement, low throughput | Less sensitive to small molecules | Limited resolution for polydisperse samples | Low concentration accuracy for complex media |
Table 2: Decision Matrix for Method Selection in Nanoparticle Characterization
| Research Question | Primary Recommended Method | Complementary Orthogonal Method | Rationale |
|---|---|---|---|
| Kinetics of ligand binding to NP surface | SPR | ITC | SPR provides direct ka/kd; ITC validates affinity and gives thermodynamics. |
| Determining binding stoichiometry | ITC | SPR | ITC directly measures n; SPR can infer from RU max if ligand/NP molecular weights known. |
| NP aggregation state in buffer | NTA / DLS | SEC-MALS | NTA/DLS for polydispersity index; SEC-MALS for precise size/weight of separated populations. |
| Stability in serum/plasma | NTA with fluorescent mode | SPR (with serum passivation) | NTA tracks size change in complex media; SPR assesses ligand binding retention in serum. |
| Drug payload release kinetics | Fluorescence-based assay | SPR (conformation change) | Direct dye measurement is most accurate; SPR may detect particle swelling/rupture. |
Experimental Protocols
Protocol 3.1: SPR Analysis of Antibody-Conjugated Nanoparticle Binding to Immobilized Target
Objective: Determine the kinetics and affinity of a monoclonal antibody-conjugated lipid nanoparticle binding to its immobilized protein target.
Materials: See "The Scientist's Toolkit" below. Method:
- Chip Surface Preparation: Dock a CM5 sensor chip. Prime the system with HBS-EP+ buffer (0.01M HEPES, 0.15M NaCl, 3mM EDTA, 0.005% v/v Surfactant P20, pH 7.4).
- Target Immobilization: Activate two flow cells (FC1, FC2) with a 7-min injection of a 1:1 mixture of 0.4 M EDC and 0.1 M NHS at 10 µL/min. Dilute the target protein to 20 µg/mL in 10 mM sodium acetate buffer (pH 4.5). Inject over FC2 for 7 min to achieve ~5000 RU. Deactivate with a 7-min injection of 1 M ethanolamine-HCl (pH 8.5). FC1 serves as the reference.
- Nanoparticle Sample Preparation: Dilute antibody-NP stock in running buffer (HBS-EP+) to 2x the highest concentration (e.g., 100 nM). Prepare a 2-fold serial dilution series (e.g., 50, 25, 12.5, 6.25 nM).
- Binding Kinetics Experiment: Set instrument temperature to 25°C. Inject each NP dilution over FC1 and FC2 for 3 min (association phase), followed by a 10-min dissociation phase in running buffer. Use a flow rate of 30 µL/min to minimize mass transport effects. Regenerate the surface with two 30-second pulses of 10 mM glycine-HCl (pH 2.0).
- Data Analysis: Subtract reference FC1 data from FC2. Fit the double-referenced sensorgrams globally to a 1:1 Langmuir binding model using the instrument's software (e.g., Biacore Evaluation Software) to extract ka, kd, and KD.
Protocol 3.2: Orthogonal Validation Using NTA for Aggregation Assessment
Objective: Assess the monodispersity and size stability of the antibody-NP before and after SPR analysis.
Materials: Nanoparticle sample, syringe filter (0.22 µm), NTA instrument (e.g., NanoSight NS300). Method:
- Sample Preparation: Dilute the original NP stock and the sample recovered from the SPR vial post-analysis in filtered PBS to achieve a concentration of ~108 particles/mL.
- Instrument Calibration: Calibrate the NTA camera using 100 nm polystyrene beads.
- Measurement: Load 1 mL of diluted sample into the chamber with a syringe. Set camera level to 14-16 and detection threshold to 5. Record three 60-second videos at 25 frames per second.
- Data Analysis: Use NTA software to analyze each video. Report the mean and mode hydrodynamic diameter, and the particle concentration for each sample. Compare pre- and post-SPR distributions to identify aggregation induced by the flow system.
Visualizations
Diagram Title: SPR Kinetics Experiment Workflow
Diagram Title: Decision Path: SPR vs. Orthogonal Methods
The Scientist's Toolkit
Table 3: Essential Research Reagent Solutions for SPR Nanoparticle Characterization
| Item | Function in SPR/NP Characterization | Example Product/Catalog |
|---|---|---|
| CM5 Sensor Chip | Gold surface with a carboxymethylated dextran matrix for ligand immobilization. | Cytiva, BR-1005-30 |
| HBS-EP+ Buffer | Standard running buffer for minimal non-specific binding and stable baseline. | Cytiva, BR-1006-69 |
| EDC & NHS | Cross-linking reagents for activating carboxyl groups for amine coupling. | Cytiva, BR-1000-50 |
| Ethanolamine-HCl | Used to deactivate remaining ester groups after immobilization. | Cytiva, BR-1000-50 |
| Glycine-HCl (pH 2.0) | Common regeneration solution to dissociate bound analyte without damaging the ligand. | Prepare in lab (10-100 mM) |
| Surfactant P20 | Polysorbate 20 detergent added to buffer (0.005%) to reduce non-specific binding. | Cytiva, BR-1000-54 |
| Size Standards (for NTA) | Monodisperse beads for calibrating nanoparticle sizing instruments. | Malvern, NTA4080 |
| Filtered PBS | Particle-free buffer for diluting NP samples for NTA/DLS. | 0.22 µm syringe filter, Millipore SLGP033RS |
Application Notes
Within the broader thesis on Surface Plasmon Resonance (SPR) for nanoparticle characterization in biomedicine, the integration of SPR with Mass Spectrometry (MS) represents a transformative hybrid platform. This combination enables the real-time, label-free quantification of nanoparticle-protein corona formation (via SPR) followed by the precise identification and characterization of the bound biomolecular constituents (via MS). This is critical for understanding the biological identity of therapeutic nanoparticles, which dictates their pharmacokinetics, biodistribution, and safety profile.
Key Applications in Biomedical Research:
- Kinetic Profiling of Corona Evolution: SPR monitors the association/dissociation rates of complex plasma proteins onto nanoparticle surfaces, revealing the dynamics of hard vs. soft corona formation under physiologically relevant flow conditions.
- Affinity-Ranking of Corona Proteins: SPR response units correlate with bound mass, allowing researchers to identify which proteins exhibit the highest affinity for a given nanoparticle surface chemistry.
- Targeted Corona Component Identification: Eluates from the SPR chip surface can be directly analyzed by MS (e.g., LC-MS/MS) to identify the proteins pre-selected by their binding kinetics and affinity.
- Corona-Composition Relationship Studies: By testing nanoparticle libraries (varying size, PEGylation, charge), researchers can correlate specific surface properties with the composition of the adsorbed corona, guiding rational design.
Table 1: Representative Kinetic Data for Fibrinogen Adsorption on PEGylated vs. Non-PEGylated AuNPs (from SPR Phase)
| Nanoparticle Type | SPR Response at Saturation (RU) | Apparent ka (1/Ms) | Apparent kd (1/s) | KD (nM) |
|---|---|---|---|---|
| Citrate-AuNP (50nm) | 425.6 ± 32.1 | (2.1 ± 0.3) x 10^5 | (8.4 ± 1.1) x 10^-4 | 4.0 ± 0.7 |
| mPEG(5k)-SH-AuNP | 48.7 ± 5.2 | Not determinable | Not determinable | Very low affinity |
Table 2: Top 5 Corona Proteins Identified by LC-MS/MS on Citrate-AuNPs from Human Plasma (from MS Phase)
| Protein Name | Gene Symbol | Molecular Weight (kDa) | Sequence Coverage (%) | Unique Peptides | EmPAI Score (Abundance Index) |
|---|---|---|---|---|---|
| Serum Albumin | ALB | 66.5 | 45 | 28 | 2.15 |
| Apolipoprotein A-I | APOA1 | 28.1 | 52 | 15 | 1.87 |
| Immunoglobulin G constant region | IGHG1 | 50.1 | 33 | 12 | 1.42 |
| Fibrinogen alpha chain | FGA | 63.1 | 22 | 11 | 1.05 |
| Complement C3 | C3 | 187.0 | 18 | 22 | 0.98 |
Experimental Protocols
Protocol 1: SPR-Based Analysis of Nanoparticle Corona Formation Kinetics
Objective: To measure the real-time binding kinetics of a protein or complex biological fluid (e.g., human plasma) to immobilized or captured nanoparticles on an SPR sensor chip.
Materials:
- SPR instrument (e.g., Biacore series, OpenSPR)
- Carboxymethylated dextran sensor chip (e.g., CMS Series S)
- Running Buffer: HBS-EP+ (10 mM HEPES, 150 mM NaCl, 3 mM EDTA, 0.05% v/v Surfactant P20, pH 7.4)
- Amine-coupling reagents: 0.4 M EDC, 0.1 M NHS, 1.0 M ethanolamine-HCl (pH 8.5)
- Ligand: Nanoparticle with amine functionality or capturing antibody
- Analytic: Single protein solution (e.g., 100 µg/mL fibrinogen in buffer) or diluted human plasma (1:10 to 1:100 in running buffer)
Procedure:
- Chip Preparation: Dock the CM5 sensor chip and prime the system with running buffer.
- Ligand Immobilization:
- Activate the dextran matrix on a selected flow cell with a 7-minute injection of a 1:1 mixture of NHS and EDC.
- Dilute amine-functionalized nanoparticles (or capturing antibody) to 10-50 µg/mL in 10 mM sodium acetate buffer (pH 4.0-5.5). Inject for 5-10 minutes to achieve a target immobilization level of 100-500 Response Units (RU).
- Deactivate excess reactive esters with a 7-minute injection of 1.0 M ethanolamine-HCl (pH 8.5).
- Kinetic Binding Experiment:
- Set flow rate to 30 µL/min.
- For captured nanoparticles, inject a stable nanoparticle suspension (~50 µg/mL) for 2-3 minutes to capture a consistent layer.
- Establish a stable baseline with running buffer for 2 minutes.
- Inject the analyte (protein or diluted plasma) for 5 minutes (association phase).
- Switch back to running buffer and monitor for 10 minutes (dissociation phase).
- Regenerate the surface with a 30-second pulse of 10 mM glycine-HCl (pH 2.0) to remove bound analyte.
- Repeat for multiple analyte concentrations (e.g., 1:200, 1:100, 1:50 plasma dilution).
- Data Analysis: Use the instrument's software to double-reference sensorgrams (reference flow cell and blank buffer injections). Fit the data to a 1:1 Langmuir binding model or a more complex model if necessary.
Protocol 2: On-Chip Recovery of Corona for Mass Spectrometric Analysis
Objective: To elute the intact protein corona from nanoparticles on the SPR chip for subsequent identification by LC-MS/MS.
Materials:
- SPR chip post-corona formation experiment
- Elution buffer: 2% (w/v) SDS in 50 mM Tris-HCl, pH 8.0, or 4M urea / 50 mM ammonium bicarbonate
- Collection vials (low-protein binding)
- Standard reagents for protein digestion: DTT, IAA, trypsin
- LC-MS/MS system
Procedure:
- Large-Scale Corona Formation: In a single, extended run, inject a high concentration of plasma (e.g., 1:10 dilution) over the nanoparticle-coated sensor surface for 15-20 minutes to accumulate a significant mass of corona proteins.
- On-Chip Wash: Briefly wash with running buffer (5 min) to remove loosely associated proteins (soft corona).
- Corona Elution: Manually remove the sensor chip from the instrument. Using a pipette, gently overlay the specific flow cell with 50-100 µL of elution buffer. Incubate for 15 minutes at room temperature. Carefully collect the eluate into a low-binding vial.
- Sample Preparation for MS:
- Reduce the eluted proteins with 10 mM DTT at 56°C for 30 min.
- Alkylate with 55 mM iodoacetamide at room temperature in the dark for 20 min.
- Perform overnight digestion with sequencing-grade trypsin (1:50 enzyme-to-protein ratio).
- Acidify the resulting peptides with formic acid and desalt using C18 stage tips.
- LC-MS/MS Analysis: Reconstitute peptides in 0.1% formic acid and analyze by nanoflow LC-MS/MS. Use a data-dependent acquisition method.
- Database Search: Process raw files using software (e.g., MaxQuant, Proteome Discoverer) against the human UniProt database. Consider adding common contaminant and nanoparticle ligand sequences.
Diagrams
Title: SPR-MS Hybrid Workflow for Corona Analysis
Title: Rational NP Design via Corona Analysis
The Scientist's Toolkit
Table 3: Essential Research Reagent Solutions for SPR-MS Corona Studies
| Item | Function in Experiment | Example/Notes |
|---|---|---|
| SPR Sensor Chip (CM5) | Provides a carboxymethylated dextran matrix for covalent immobilization of nanoparticles or capture ligands. | Gold standard for protein interaction studies. |
| Amine-Coupling Kit (EDC/NHS) | Activates carboxyl groups on the sensor chip surface for covalent attachment of amine-containing ligands. | Essential for stable ligand immobilization. |
| HBS-EP+ Running Buffer | Provides a consistent, buffered ionic strength environment with surfactant to minimize non-specific binding in SPR. | Critical for stable baselines and reproducible kinetics. |
| Human Reference Plasma (Pooled) | A standardized, complex biological fluid used as the analyte to form a physiologically relevant protein corona. | Ensures reproducibility and comparability between labs. |
| Low-Protein Binding Microtubes/Vials | Prevents loss of low-abundance corona proteins during sample collection and transfer prior to MS. | Maximizes sample recovery. |
| Mass Spectrometry-Compatible Elution Buffer (e.g., 2% SDS / 4M Urea) | Efficiently denatures and elutes tightly bound ("hard") corona proteins from the nanoparticle surface for MS analysis. | Must be compatible with downstream digestion and LC-MS. |
| Sequencing-Grade Modified Trypsin | Protease that specifically cleaves peptide bonds after lysine/arginine for bottom-up proteomic analysis of the corona. | Ensures high-efficiency, reproducible digestion. |
| C18 Stage Tips (Desalting) | Desalts and concentrates peptide mixtures prior to LC-MS/MS injection, improving sensitivity and data quality. | Simple, effective sample clean-up. |
Conclusion
Surface Plasmon Resonance has emerged as an indispensable, label-free tool for the rigorous characterization of biomedical nanoparticles, moving beyond simple sizing to provide dynamic interaction data critical for rational design. By mastering foundational principles, robust methodologies, and optimization strategies, researchers can leverage SPR to decode the complex bio-nano interface, optimize targeting ligands, and precisely quantify binding events. While complementary to techniques like DLS and NTA, SPR's unique ability to provide real-time kinetic and affinity data fills a crucial gap in the analytical pipeline. Future directions point toward high-throughput SPR screening for nanoparticle libraries, advanced LSPR for single-particle analysis, and integration with omics technologies to predict in vivo performance, ultimately accelerating the translation of safer and more effective nanotherapeutics into clinical practice.